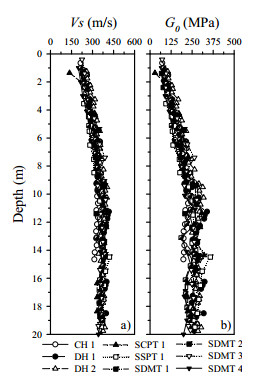
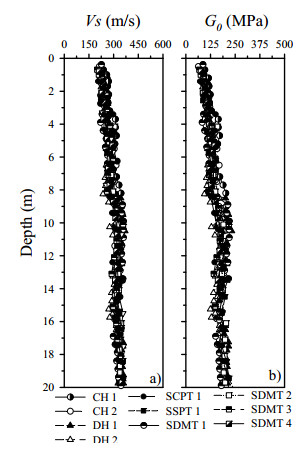
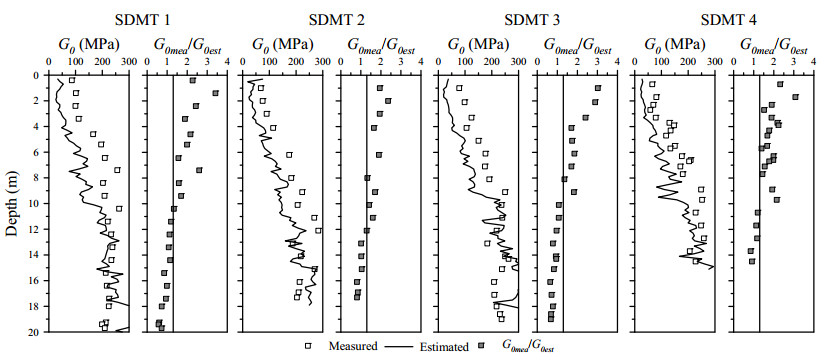
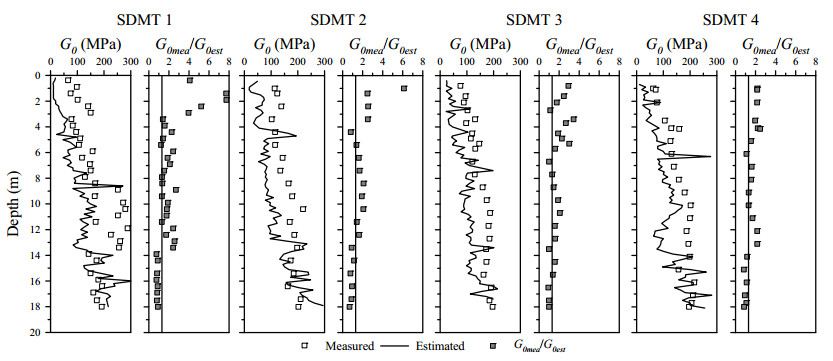
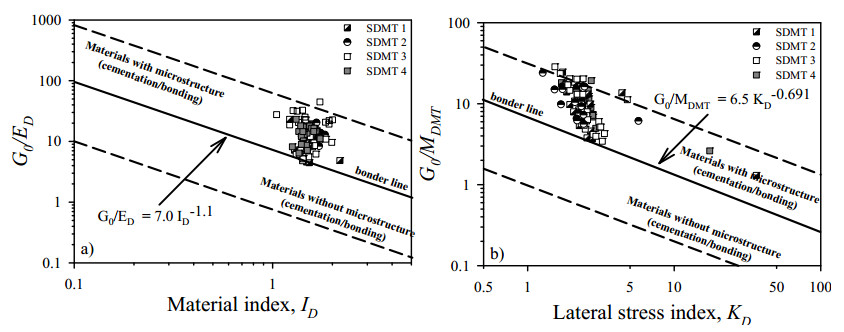
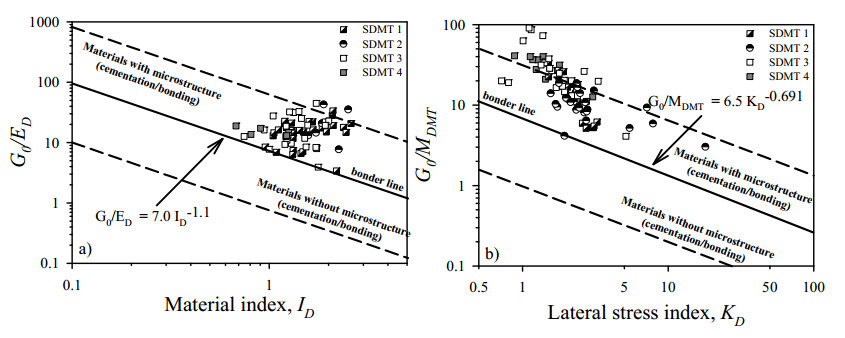
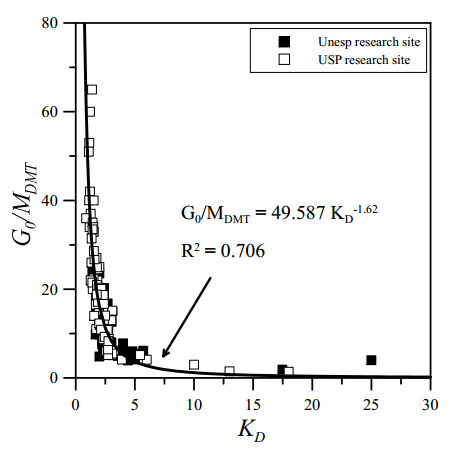
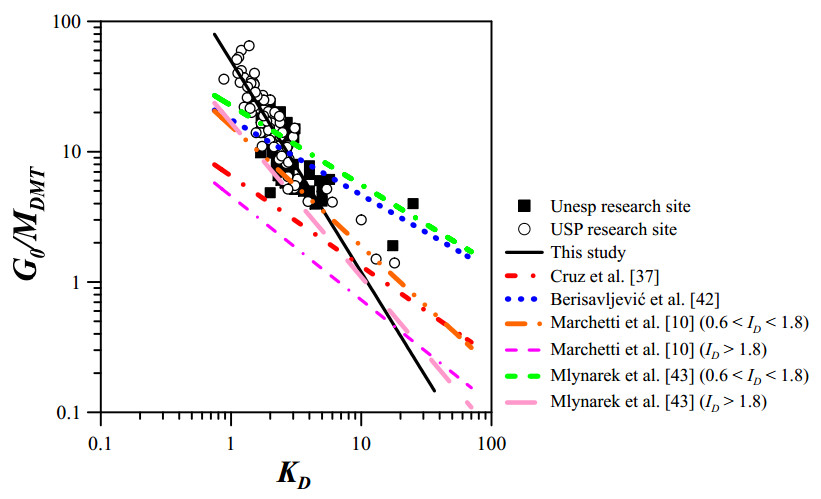
Geotechnical site characterization requires the determination of the stratigraphic profile, the groundwater level position, and the appropriate geomechanical design parameters required for each project. It is also necessary to assess both the spatial and temporal site variability. The shear wave velocity profile (Vs) and, consequently, the maximum shear modulus (G0) are very important parameters for geotechnical projects. Although a large part of Brazil is covered by tropical soils, the literature on the dynamic behavior of these soils is limited. The seismic dilatometer test (SDMT) has been used in several site investigation campaigns, both at research test sites and in construction projects. This paper presents comparisons of the maximum shear modulus (G0) profiles at two well-documented tropical soil sites using the SDMT and other in situ testing techniques such as the crosshole (CH) and downhole (DH) methods, the seismic piezocone penetration test (SCPTu), and seismic standard penetration tests (SSPTs). G0 measurements obtained with the SDMT were found to be generally accurate and in good agreement with the CH, DH, SCPTu, and SSPT data used as references in the comparisons. Furthermore, this paper shows that the classical empirical correlations used to estimate G0 from the intermediate parameters (ED, KD, and MDMT) of the flat dilatometer test (DMT) were not able to estimate G0 for both studied sites. This may be related to the presence of microstructure (e.g., cementation/bonding and aging) as well as a possible soil suction influence typical of the investigated tropical soil sites. The G0/ED and G0/MDMT ratios determined by the SDMT were used to assess the presence of microstructure and any possible soil suction influence. In addition, an equation was proposed to estimate G0 from the intermediate DMT parameters.
Citation: Breno Padovezi Rocha, Luis Pedro Rojas Herrera, Heraldo Luiz Giacheti. Maximum shear modulus (G0) determination by different in situ testing techniques in two tropical soil sites[J]. AIMS Geosciences, 2025, 11(2): 468-488. doi: 10.3934/geosci.2025019
Geotechnical site characterization requires the determination of the stratigraphic profile, the groundwater level position, and the appropriate geomechanical design parameters required for each project. It is also necessary to assess both the spatial and temporal site variability. The shear wave velocity profile (Vs) and, consequently, the maximum shear modulus (G0) are very important parameters for geotechnical projects. Although a large part of Brazil is covered by tropical soils, the literature on the dynamic behavior of these soils is limited. The seismic dilatometer test (SDMT) has been used in several site investigation campaigns, both at research test sites and in construction projects. This paper presents comparisons of the maximum shear modulus (G0) profiles at two well-documented tropical soil sites using the SDMT and other in situ testing techniques such as the crosshole (CH) and downhole (DH) methods, the seismic piezocone penetration test (SCPTu), and seismic standard penetration tests (SSPTs). G0 measurements obtained with the SDMT were found to be generally accurate and in good agreement with the CH, DH, SCPTu, and SSPT data used as references in the comparisons. Furthermore, this paper shows that the classical empirical correlations used to estimate G0 from the intermediate parameters (ED, KD, and MDMT) of the flat dilatometer test (DMT) were not able to estimate G0 for both studied sites. This may be related to the presence of microstructure (e.g., cementation/bonding and aging) as well as a possible soil suction influence typical of the investigated tropical soil sites. The G0/ED and G0/MDMT ratios determined by the SDMT were used to assess the presence of microstructure and any possible soil suction influence. In addition, an equation was proposed to estimate G0 from the intermediate DMT parameters.

| [1] |
Schnaid F, Nierwinski HP, Odebrecht E (2020) Classification and State-Parameter Assessment of Granular Soils Using the Seismic Cone. J Geotech Geoenvironmental Eng 146. https://doi.org/10.1061/(ASCE)GT.1943-5606.0002306 doi: 10.1061/(ASCE)GT.1943-5606.0002306

|
| [2] |
Rocha BP, Silveira IA, Rodrigues RA, et al. (2023) Identifying Collapsible Soils from Seismic Cone (SCPT): A Qualitative Approach. Buildings 13: 830. https://doi.org/10.3390/buildings13030830 doi: 10.3390/buildings13030830
|
| [3] |
Rocha BP, de Carvalho Rodrigues AL, Rodrigues RA, et al. (2022) Using a Seismic Dilatometer to Identify Collapsible Soils. Int J Civ Eng 20: 857–867. https://doi.org/10.1007/s40999-021-00687-9 doi: 10.1007/s40999-021-00687-9
|
| [4] |
Bang ES, Kim DS (2007) Evaluation of shear wave velocity profile using SPT based uphole method. Soil Dyn Earthq Eng 27: 741–758. https://doi.org/10.1016/j.soildyn.2006.12.004 doi: 10.1016/j.soildyn.2006.12.004
|
| [5] |
Atkinson JH (2000) Non-linear soil stiffness in routine design. Géotechnique 50: 487–508. https://doi.org/10.1680/geot.2000.50.5.487 doi: 10.1680/geot.2000.50.5.487
|
| [6] |
Dos Santos RA, Rocha BP, Giacheti HL (2020) DMT for Load-Settlement Curve Prediction in a Tropical Sandy Soil Compared to Plate Load Tests. Geotech Test J 43: 113–131. https://doi.org/10.1520/GTJ20180079 doi: 10.1520/GTJ20180079
|
| [7] |
Wang Z, Zhang N, Cai G, et al. (2019) Field Investigation of Maximum Dynamic Shear Modulus of Clay Deposit Using Seismic Piezocone. Int J Civ Eng 17: 699–708. https://doi.org/10.1007/s40999-018-0306-z doi: 10.1007/s40999-018-0306-z
|
| [8] |
Hunter J, Benjumea B, Harris J, et al. (2002) Surface and downhole shear wave seismic methods for thick soil site investigations. Soil Dyn Earthq Eng 22: 931–941. https://doi.org/10.1016/S0267-7261(02)00117-3 doi: 10.1016/S0267-7261(02)00117-3
|
| [9] | Stokoe KH, Joh SH, Woods RD (2004) Some contributions of in situ geophysical measurements to solving geotechnical engineering problems., 2nd International Conference on Site Characterization, 97–132. |
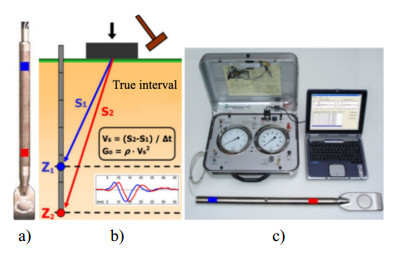
| [10] | Marchetti S, Monaco P, Totani G, et al. (2008) In situ tests by seismic dilatometer (SDMT), In: Laier JE, Crapps DK, Hussein MH (Eds.), From research to practice in geotechnical engineering, ASCE Geotech. Special Publication No. 180 (honoring Dr. John H. Schmertmann), 292–311. |
| [11] | Vargas M (1985) The Concept of Tropical Soils, In: Solos AB de M dos (Ed.), 1st International Conference on Geomechanics in Tropical Lateritic and Saprolitic Soils, Brasilia, 101–134. |
| [12] |
Fernandes J, Rocha B, Giacheti H (2023) Maximum shear modulus and modulus degradation curves of an unsaturated tropical soil. Soils Rocks 46: e2023013122. https://doi.org/10.28927/SR.2023.013122 doi: 10.28927/SR.2023.013122
|
| [13] | ASTM D4428-07 (2007) Standard Test Methods for Crosshole Seismic Testing. ASTM Int West Conshohocken, PA 11. |
| [14] | ASTM D7400-19 (2019) Standard Test Methods for Downhole Seismic Testing, West Conshohocken, PA, ASTM International. |
| [15] |
Campanella RG, Stewart WP (1992) Seismic cone analysis using digital signal processing for dynamic site characterization. Can Geotech J 29: 477–486. https://doi.org/10.1139/t92-052 doi: 10.1139/t92-052
|
| [16] |
Karl L, Haegeman W, Degrande G (2006) Determination of the material damping ratio and the shear wave velocity with the Seismic Cone Penetration Test. Soil Dyn Earthq Eng 26: 1111–1126. https://doi.org/10.1016/j.soildyn.2006.03.001 doi: 10.1016/j.soildyn.2006.03.001
|
| [17] |
Pedrini RAA, Rocha BP, Giacheti HL (2018) The Up-Hole Seismic Test Together with the SPT: Description of the System and Method. Soils Rocks 41: 133–148. https://doi.org/10.28927/SR.412133 doi: 10.28927/SR.412133
|
| [18] |
Marchetti S (1980) In Situ Tests by Flat Dilatometer. J Geotech Eng Div 106: 299–321. https://doi.org/10.1061/AJGEB6.0000934 doi: 10.1061/AJGEB6.0000934
|
| [19] |
Marchetti S, Monaco P (2018) Recent Improvements in the Use, Interpretation, and Applications of DMT and SDMT in Practice. Geotech Test J 41: 837–850. https://doi.org/10.1520/GTJ20170386 doi: 10.1520/GTJ20170386
|
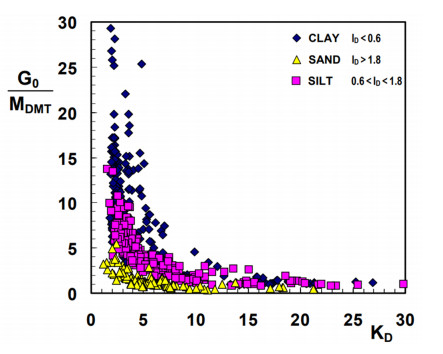
| [20] | Monaco P, Marchetti S, Totani G, et al. (2009) Interrelationship between small strain modulus G0 and operative modulus, In: Kokusho T, Tsukamoto Y, Yoshimine M (Eds.), Performance-based Design in Earthquake Geotechnical Engineering- from case history to practice, proc. IS-Tokyo 2009, Tsukuba, 1315–1323. |
| [21] |
Robertson PK (2016) Cone penetration test (CPT)-based soil behaviour type (SBT) classification system — an update. Can Geotech J 53: 1910–1927. https://doi.org/10.1139/cgj-2016-0044 doi: 10.1139/cgj-2016-0044
|
| [22] |
Cotecchia F, Chandler RJ (1997) The influence of structure on the pre-failure behaviour of a natural clay. Géotechnique 47: 523–544. https://doi.org/10.1680/geot.1997.47.3.523 doi: 10.1680/geot.1997.47.3.523
|
| [23] |
Cuccovillo T, Coop MR (1997) Yielding and pre-failure deformation of structured sands. Géotechnique 47: 491–508. https://doi.org/10.1680/geot.1997.47.3.491 doi: 10.1680/geot.1997.47.3.491
|
| [24] |
Yamamuro JA, Wood FM, Lade PV (2008) Effect of depositional method on the microstructure of silty sand. Can Geotech J 45: 1538–1555. https://doi.org/10.1139/T08-080 doi: 10.1139/T08-080
|
| [25] |
Leroueil S, Vaughan PR (1990) The general and congruent effects of structure in natural soils and weak rocks. Géotechnique 40: 467–488. https://doi.org/10.1680/geot.1990.40.3.467 doi: 10.1680/geot.1990.40.3.467
|
| [26] | Lambe TW, Whitman R V. (1969) Soil Mechanics, New York, John Wiley & Sons. |
| [27] |
Berisavljević D, Berisavljević Z (2019) Determination of the presence of microstructure in a soil using a seismic dilatometer. Bull Eng Geol Environ 78: 1709–1725. https://doi.org/10.1007/s10064-018-1234-5 doi: 10.1007/s10064-018-1234-5
|
| [28] |
Giacheti HL, Bezerra RC, Rocha BP, et al. (2019) Seasonal influence on cone penetration test: An unsaturated soil site example. J Rock Mech Geotech Eng 11: 361–368. https://doi.org/10.1016/j.jrmge.2018.10.005 doi: 10.1016/j.jrmge.2018.10.005
|
| [29] | De Mio G (2005) Geological conditioning aspects for piezocone test interpretation for stratigraphical logging in geotechnical and geo-environmental site investigation (in Portuguese). |
| [30] | Nogami JS, Villibor DF (1981) Uma nova classificação de solos para finalidades rodoviárias, Simpósio Brasileiro de Solos Tropicais em Engenharia, Rio de Janeiro, ABMS, 30–41. |
| [31] |
Rocha BP, Giacheti HL (2018) Site Characterization of a Tropical Soil by In Situ Tests. DYNA 85: 211–219. https://doi.org/10.15446/dyna.v85n206.67891 doi: 10.15446/dyna.v85n206.67891
|
| [32] |
Rocha BP, Rodrigues RA, Giacheti HL (2021) The Flat Dilatometer Test in an Unsaturated Tropical Soil Site. Geotech Geol Eng 39: 5957–5969. https://doi.org/10.1007/s10706-021-01849-1 doi: 10.1007/s10706-021-01849-1
|
| [33] |
Vitali OPM, Pedrini RAA, Oliveira LPR, et al. (2012) Developing a System for Down-Hole Seismic Testing Together with the CPTU. Soils Rocks 35: 75–87. https://doi.org/10.28927/SR.351075 doi: 10.28927/SR.351075
|
| [34] | NBR 9604 AN (2024) Soil — Opening of a well or inspection trench, with removal of disturbed and undisturbed samples — Procedure, Rio de Janeiro. |
| [35] |
Cho GC, Santamarina JC (2001) Unsaturated Particulate Materials—Particle-Level Studies. J Geotech Geoenvironmental Eng 127: 84–96. https://doi.org/10.1061/(ASCE)1090-0241(2001)127:1(84) doi: 10.1061/(ASCE)1090-0241(2001)127:1(84)
|
| [36] |
Gutierrez NHM, de Nóbrega MT, Vilar OM (2009) Influence of the microstructure in the collapse of a residual clayey tropical soil. Bull Eng Geol Environ 68: 107–116. https://doi.org/10.1007/s10064-008-0180-z doi: 10.1007/s10064-008-0180-z
|
| [37] | Cruz N, Rodrigues C, Viana Da Fonseca A (2012) Detecting the presence of cementation structures in soils, based in DMT interpreted charts, In: Coutinho RQ, Mayne PW (Eds.), 4th International Conference on Site Characterization (ISC4)., Porto de Galinhas, Taylor & Francis Group, 1723–1728. |
| [38] |
Tanaka H, Tanaka M (1998) Characterization of Sandy Soils Using CPT and DMT. Soils Found 38: 55–65. https://doi.org/10.3208/sandf.38.3_55 doi: 10.3208/sandf.38.3_55
|
| [39] |
Hryciw RD (1990) Small‐Strain‐Shear Modulus of Soil by Dilatometer. J Geotech Eng 116: 1700–1716. https://doi.org/10.1061/(ASCE)0733-9410(1990)116:11(1700) doi: 10.1061/(ASCE)0733-9410(1990)116:11(1700)
|
| [40] |
Leonards GA, Frost JD (1988) Settlement of Shallow Foundations on Granular Soils. J Geotech Eng 114: 791–809. https://doi.org/10.1061/(ASCE)0733-9410(1988)114:7(791) doi: 10.1061/(ASCE)0733-9410(1988)114:7(791)
|
| [41] | Baldi G, Bellotti R, Ghionna V, et al. (1989) Modulus of Sands from CPT's and DMT's, XII ICSMFE, Rio de Janeiro, 165–170. |
| [42] |
Berisavljević D, Berisavljević Z, Čebašek V, et al. (2014) Characterisation of collapsing loess by seismic dilatometer. Eng Geol 181: 180–189. https://doi.org/10.1016/j.enggeo.2014.07.011 doi: 10.1016/j.enggeo.2014.07.011
|
| [43] | Mlynarek Z, Wierzbicki J, Monaco P (2022) Use of DMT and CPTU to assess the G0 profile in the subsoil, In: Tonni G & (Ed.), Cone Penetration Testing 2022, Taylor & Francis Group, 7. https://doi.org/10.1201/9781003308829-82 |
Figures(16) / Tables(1)

Breno Padovezi Rocha, Luis Pedro Rojas Herrera, Heraldo Luiz Giacheti. Maximum shear modulus (G0) determination by different in situ testing techniques in two tropical soil sites[J]. AIMS Geosciences, 2025, 11(2): 468-488. doi: 10.3934/geosci.2025019


 DownLoad: