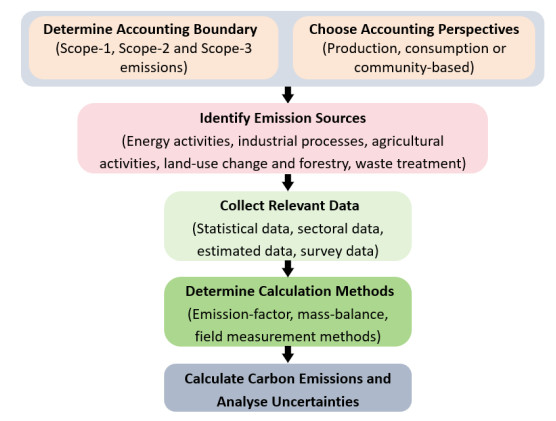
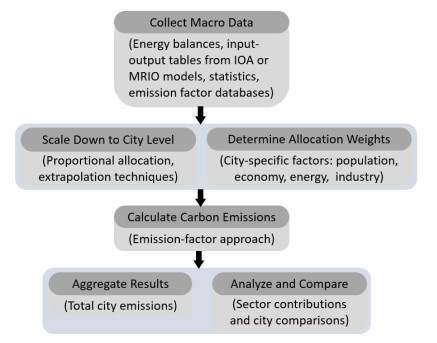
As global climate change intensifies, city-level carbon accounting has become increasingly important, as cities are significant sources of carbon emissions. This paper provides an overview of key steps and considerations in city-level carbon accounting methods, with a particular focus on the bottom-up approach that involves defining accounting boundaries, selecting accounting perspectives, identifying emission sources, collecting data, determining calculation methods, and performing calculations and uncertainty analyses. Additionally, the paper introduces the top-down method that uses macro-level data to estimate carbon emissions at the city level and briefly discusses emerging methods for city-level carbon accounting. The strengths and limitations of these approaches are examined. The paper also provides an overview of different databases used for carbon accounting and evaluates their appropriateness for estimating carbon emissions at the city level. It also analyzes key research topics in the literature related to urban carbon accounting. Common challenges in city-level carbon accounting are discussed, along with recommendations for future research in this field.
Citation: Lei Fan, Haoyu Guan. A comparative overview of city-level carbon accounting: Key processes and considerations[J]. AIMS Environmental Science, 2025, 12(3): 400-418. doi: 10.3934/environsci.2025018
As global climate change intensifies, city-level carbon accounting has become increasingly important, as cities are significant sources of carbon emissions. This paper provides an overview of key steps and considerations in city-level carbon accounting methods, with a particular focus on the bottom-up approach that involves defining accounting boundaries, selecting accounting perspectives, identifying emission sources, collecting data, determining calculation methods, and performing calculations and uncertainty analyses. Additionally, the paper introduces the top-down method that uses macro-level data to estimate carbon emissions at the city level and briefly discusses emerging methods for city-level carbon accounting. The strengths and limitations of these approaches are examined. The paper also provides an overview of different databases used for carbon accounting and evaluates their appropriateness for estimating carbon emissions at the city level. It also analyzes key research topics in the literature related to urban carbon accounting. Common challenges in city-level carbon accounting are discussed, along with recommendations for future research in this field.

| [1] | Change IPCC (2007) Climate change 2007: The physical science basis. Agenda. Available from: https://digitallibrary.un.org/record/614243?ln=en&v=pdf. |
| [2] | Liu F, Fan L, Gu X (2024) Key contributors to regional carbon emissions in China, using the Yangtze River delta, southwest, and northeast regions as examples, In: Proceedings of 2024 International Conference on Smart Electrical Grid and Renewable Energy (SEGRE 2024). Lecture Notes in Electrical Engineering, Singapore: Springer, 1336. https://doi.org/10.1007/978-981-96-1965-8_53 |
| [3] |
Wang S, Chen B (2018) Three-tier carbon accounting model for cities. Appl Energy 229: 163–175. https://doi.org/10.1016/j.apenergy.2018.07.109 doi: 10.1016/j.apenergy.2018.07.109

|
| [4] |
Hao Y, Su M, Zhang L, et al. (2015) Integrated accounting of urban carbon cycle in Guangyuan, a mountainous city of China: The impacts of earthquake and reconstruction. J Clean Prod 103: 231–240. https://doi.org/10.1016/j.jclepro.2014.05.091 doi: 10.1016/j.jclepro.2014.05.091
|
| [5] | Yang L, Hong J (2016) An accounting model of carbon footprint in urban distribution systems, In: Proceedings of the 2016 International Conference on Intelligent Control and Computer Application (ICCA 2016), Atlantis Press, 110–113. https://doi.org/10.2991/icca-16.2016.24 |
| [6] | Ren Z, Li X (2014) A review of carbon accounting models for urban building sector, In: Proceedings of the 8th International Symposium on Heating, Ventilation and Air Conditioning, Springer Berlin Heidelberg, 1: 617–624. https://doi.org/10.1007/978-3-642-39584-0_68 |
| [7] |
Liu Y, Mauter MS (2022) High-resolution carbon accounting framework for urban water supply systems. Environ Sci Technol 56: 13920–13930. https://doi.org/10.1021/acs.est.2c04127 doi: 10.1021/acs.est.2c04127
|
| [8] |
Yin L, Sharifi A, Liqiao H, et al. (2022) Urban carbon accounting: An overview. Urban Clim 44: 101195. https://doi.org/10.1016/j.uclim.2022.101195 doi: 10.1016/j.uclim.2022.101195
|
| [9] |
Zhang Z, Hu G, Mu X, et al. (2022) From low carbon to carbon neutrality: A bibliometric analysis of the status, evolution and development trend. J Environ Manage 322: 116087. https://doi.org/10.1016/j.jenvman.2022.116087 doi: 10.1016/j.jenvman.2022.116087
|
| [10] |
Xu L, Wang Y (2022) City carbon emission accounting in China: International statistical standards measurement and methodology construction. Stat Res 39: 12–30. https://doi.org/10.19343/j.cnki.11-1302/c.2022.07.002 doi: 10.19343/j.cnki.11-1302/c.2022.07.002
|
| [11] |
Moran D, Kanemoto K, Jiborn M, et al. (2018) Carbon footprints of 13,000 cities. Environ Res Lett 13: 064041. https://doi.org/10.1088/1748-9326/aac72a doi: 10.1088/1748-9326/aac72a
|
| [12] |
Sun X, Mi Z, Sudmant A, et al. (2022) Using crowdsourced data to estimate the carbon footprints of global cities. Adv Appl Energy 8: 100111. https://doi.org/10.1016/j.adapen.2022.100111 doi: 10.1016/j.adapen.2022.100111
|
| [13] | Cities Alliance, International Standard for Determining Greenhouse Gas Emissions for Cities. 2010. Available from: https://www.citiesalliance.org/sites/default/files/CA_Images/GHG%20Global%20Standard%20-%20Version%20June%202010.pdf. |
| [14] | World Resources Institute, C40 CITIES, and ICLEI, Global protocol for community-scale greenhouse gas emission inventories: an accounting and reporting standard for cities, 2014. Available from: https://ghgprotocol.org/sites/default/files/ghgp/standards/GHGP_GPC_0.pdf. |
| [15] |
Lombardi M, Laiola E, Tricase C, et al. (2017) Assessing the urban carbon footprint: An overview. Environ Impact Asses 66: 43–52. https://doi.org/10.1016/j.eiar.2017.06.005 doi: 10.1016/j.eiar.2017.06.005
|
| [16] |
Cai B, Zhang L (2014) Urban CO2 emissions in China: Spatial boundary and performance comparison. Energ Policy 66: 557–567. https://doi.org/10.1016/j.enpol.2013.10.072 doi: 10.1016/j.enpol.2013.10.072
|
| [17] |
Dhakal S (2009) Urban energy use and carbon emissions from cities in China and policy implications. Energ Policy 37: 4208–4219. https://doi.org/10.1016/j.enpol.2009.05.020 doi: 10.1016/j.enpol.2009.05.020
|
| [18] |
Wang M, Madden M, Liu X (2017) Exploring the relationship between urban forms and CO2 emissions in 104 Chinese cities. J Urban Plan Dev 143: 04017014. https://doi.org/10.1061/(ASCE)UP.1943-5444.0000400 doi: 10.1061/(ASCE)UP.1943-5444.0000400
|
| [19] |
Park C, Jeong S, Park H, et al. (2021) Evaluation of the potential use of satellite-derived XCO2 in detecting CO2 enhancement in megacities with limited ground observations: A case study in Seoul using Orbiting Carbon Observatory-2. Asia-Pac J Atmos Sci 57: 289–299. https://doi.org/10.1007/s13143-020-00202-5 doi: 10.1007/s13143-020-00202-5
|
| [20] |
Huo D, Huang X, Dou X, et al. (2022) Carbon monitor cities near-real-time daily estimates of CO2 emissions from 1500 cities worldwide. Sci Data 9: 533. https://doi.org/10.1038/s41597-022-01657-z doi: 10.1038/s41597-022-01657-z
|
| [21] |
Mirabella N, Allacker K (2021) Urban GHG accounting: Discrepancies, constraints and opportunities. Build Cities 2: 1–15. https://doi.org/10.5334/bc.50 doi: 10.5334/bc.50
|
| [22] |
Sudmant A, Gouldson A, Hopkins JM, et al. (2018) Producer cities and consumer cities: Using production-and consumption-based carbon accounts to guide climate action in China, the UK, and the US. J Clean Prod 176: 654–662. https://doi.org/10.1016/j.jclepro.2017.12.139 doi: 10.1016/j.jclepro.2017.12.139
|
| [23] |
Liang DZ, Lu H, Guan Y, et al. (2023) Population density regulation may mitigate the imbalance between anthropogenic carbon emissions and vegetation carbon sequestration. Sustain Cities Soc 92: 104502. https://doi.org/10.1016/j.scs.2023.104502 doi: 10.1016/j.scs.2023.104502
|
| [24] | WRI, C40, ICLEI. Global protocol for community-scale greenhouse gas emission inventories (GPC): An accounting and reporting standard for cities. World Resources Institute, C40 Cities Climate Leadership Group, and ICLEI Local Governments for Sustainability, 2014. Available from: https://www.wri.org/research/global-protocol-community-scale-greenhouse-gas-emission-inventories |
| [25] |
Chen G, Shan Y, Hu Y, et al. (2019) Review on city-level carbon accounting. Environ Sci Technol 53: 5545–5558. https://doi.org/10.1021/acs.est.8b07071 doi: 10.1021/acs.est.8b07071
|
| [26] |
Wiedmann T, Chen G, Owen A, et al. (2021) Three-scope carbon emission inventories of global cities. J Ind Ecol 25: 735–750. https://doi.org/10.1111/jiec.13063 doi: 10.1111/jiec.13063
|
| [27] |
Harris S, Weinzettel J, Bigano A, et al. (2020) Low carbon cities in 2050? GHG emissions of European cities using production-based and consumption-based emission accounting methods. J Clean Prod 248: 119206. https://doi.org/10.1016/j.jclepro.2019.119206 doi: 10.1016/j.jclepro.2019.119206
|
| [28] |
Bai X, Chen J, Shi P (2012) Landscape urbanization and economic growth in China: Positive feedbacks and sustainability dilemmas. Environ Sci Technol 46: 132–139. https://doi.org/10.1021/es202329f doi: 10.1021/es202329f
|
| [29] |
Wiedmann T, Lenzen M (2018) Environmental and social footprints of international trade. Nat Geosci 11: 314–321. https://doi.org/10.1038/s41561-018-0113-9 doi: 10.1038/s41561-018-0113-9
|
| [30] |
Hertwich EG, Wood R (2018) The growing importance of scope 3 greenhouse gas emissions from industry. Environ Res Lett 13: 104013. https://doi.org/10.1088/1748-9326/aae19a doi: 10.1088/1748-9326/aae19a
|
| [31] |
Minx JC, Wiedmann T, Wood R, et al. (2009) Input-output analysis and carbon footprinting: an overview of applications. Econ Syst Res 21: 187–216. https://doi.org/10.1080/09535310903541298 doi: 10.1080/09535310903541298
|
| [32] |
Sówka I, Bezyk Y (2018) Greenhouse gas emission accounting at urban level: A case study of the city of Wroclaw (Poland). Atmos Pollut Res 9: 289–298. https://doi.org/10.1016/j.apr.2017.10.005 doi: 10.1016/j.apr.2017.10.005
|
| [33] |
Ramaswami A, Chavez A, Chertow M (2011) Carbon footprinting of cities and implications for analysis of urban material and energy flows. J Ind Ecol 15: 792–806. https://doi.org/10.1111/j.1530-9290.2012.00569.x doi: 10.1111/j.1530-9290.2012.00569.x
|
| [34] |
Chavez A, Ramaswami A (2013) Articulating a trans-boundary infrastructure supply chain greenhouse gas emission footprint for cities: Mathematical relationships and policy relevance. Energ Policy 54: 376–384. https://doi.org/10.1016/j.enpol.2012.10.037 doi: 10.1016/j.enpol.2012.10.037
|
| [35] |
Kennedy C, Steinberger J, Gasson B, et al. (2010) Methodology for inventorying greenhouse gas emissions from global cities. Energ Policy 38: 4828–4837. https://doi.org/10.1016/j.enpol.2009.08.050 doi: 10.1016/j.enpol.2009.08.050
|
| [36] | Carlock G, Kurkul K, Chen K, et al. (2020) Technical Note: Methods for estimating community-scale sectoral data from national and regional statistics for the purpose of greenhouse gas accounting and climate action planning, 2020. Available from: https://www.dataportalforcities.org/sites/default/files/contents/inline-files/Review%20Draft%20Technical%20Note%20and%20United%20States%20Methodology%20Appendix_Jul2020.pdf. |
| [37] | China Emissions Accounts and Datasets (CEADS). Data Resources. Available from: https://www.ceads.net.cn/. |
| [38] | Carbon Disclosure Project (CDP). Data and Resources. Available from: https://www.cdp.net/en. |
| [39] | C40 Cities Climate Leadership Group (C40). Data Resources. Available from: https://www.c40.org/. |
| [40] | European Environment Agency (EEA). Carbon Dioxide Information and Analysis. Available from: https://www.eea.europa.eu/data-and-maps/data-providers-and-partners/carbon-dioxide-information-and-analysis. |
| [41] | Carbon Dioxide Information Analysis Center (CDIAC). Data Resources. Available from: https://data.ess-dive.lbl.gov/portals/CDIAC. |
| [42] | Fossil Fuel Data Assimilation System (FFDAS). Data Resources. Available from: https://ffdas.rc.nau.edu/. |
| [43] | Open-source Data Inventory for Anthropogenic CO2 (ODIAC). Data Resources. Available from: https://odiac.org/index.html#/. |
| [44] |
Nassar YF, Salem MA, Iessa KR, et al. (2021) Estimation of CO2 emission factor for the energy industry sector in Libya: A case study. Environ Dev Sustain 23: 13998-14026. https://doi.org/10.1007/s10668-021-01248-9 doi: 10.1007/s10668-021-01248-9
|
| [45] | Hansen AB (2019) Evaluation of a carbon calculator: Challenges and opportunities with calculating emissions from consumption behaviour. Available from: https://hdl.handle.net/20.500.12380/300424 |
| [46] |
Downie A, Lau D, Cowie A, et al. (2014) Approaches to greenhouse gas accounting methods for biomass carbon. Biomass Bioenerg 60: 18–31. https://doi.org/10.1016/j.biombioe.2013.11.009 doi: 10.1016/j.biombioe.2013.11.009
|
| [47] |
Zhang JJ, Morawska L (2002) Combustion sources of particles: 2. Emission factors and measurement methods. Chemosphere 49: 1059–1074. https://doi.org/10.1016/S0045-6535(02)00240-0 doi: 10.1016/S0045-6535(02)00240-0
|
| [48] | Bernstein L, Bosch P, Canziani O, et al. (2008) IPCC, 2007: climate change 2007: synthesis report. Available from: https://pure.iiasa.ac.at/8667. |
| [49] |
Winiwarter W, Muik B. (2010) Statistical dependence in input data of national greenhouse gas inventories: Effects on the overall inventory uncertainty. Clim Chang 103: 19–36. https://doi.org/10.1007/s10584-010-9921-7 doi: 10.1007/s10584-010-9921-7
|
| [50] |
Bun R, Hamal K, Gusti M, et al. (2010) Spatial GHG inventory at the regional level: Accounting for uncertainty. Clim Chang 103: 227–244. https://doi.org/10.1007/s10584-010-9921-7 doi: 10.1007/s10584-010-9921-7
|
| [51] |
Cai B, Lu J, Wang J, et al. (2019) A benchmark city-level carbon dioxide emission inventory for China in 2005. Appl Energy 233: 659–673. https://doi.org/10.1016/j.apenergy.2018.10.016 doi: 10.1016/j.apenergy.2018.10.016
|
| [52] |
Shan Y, Guan D, Liu J, et al. (2017) Methodology and applications of city level CO2 emission accounts in China. J Clean Prod 161: 1215–1225. https://doi.org/10.1016/j.jclepro.2017.06.075 doi: 10.1016/j.jclepro.2017.06.075
|
| [53] |
Romero Y, Chicchon N, Duarte F, et al. (2020) Quantifying and spatial disaggregation of air pollution emissions from ground transportation in a developing country context: Case study for the Lima Metropolitan Area in Peru. Sci Total Environ 698: 134313. https://doi.org/10.1016/j.scitotenv.2019.134313 doi: 10.1016/j.scitotenv.2019.134313
|
| [54] |
Fan F, Lei Y (2016) Decomposition analysis of energy-related carbon emissions from the transportation sector in Beijing. Transport Res D-Tr E 42: 135–145. https://doi.org/10.1016/j.trd.2015.11.001 doi: 10.1016/j.trd.2015.11.001
|
| [55] |
Wiedmann T, Chen G, Barrett J (2016) The concept of city carbon maps: A case study of Melbourne, Australia. J Ind Ecol 20: 676–691. https://doi.org/10.1111/jiec.12346 doi: 10.1111/jiec.12346
|
| [56] |
Kennedy S, Sgouridis S (2011) Rigorous classification and carbon accounting principles for low and zero carbon cities. Energ Policy. 39: 5259–5268. https://doi.org/10.1016/j.enpol.2011.05.038 doi: 10.1016/j.enpol.2011.05.038
|
| [57] |
Gu X, Chen C, Fang Y, et al. (2025) CECA: An intelligent large-language-model-enabled method for accounting embodied carbon in buildings. Build Environ 272: 112694. https://doi.org/10.1016/j.buildenv.2025.112694 doi: 10.1016/j.buildenv.2025.112694
|
| [58] |
Liang W, Qiang G, Fan L, et al. (2025) Automatic indoor thermal comfort monitoring based on BIM and IoT technology. Buildings 14: 3361. https://doi.org/10.3390/buildings14113361 doi: 10.3390/buildings14113361
|
| [59] |
Zhu Q, Cai Y, Fang Y, et al. (2024) Samba: Semantic segmentation of remotely sensed images with state space model. Heliyon 10: e38495. https://doi.org/10.1016/j.heliyon.2024.e38495 doi: 10.1016/j.heliyon.2024.e38495
|
| [60] |
Cai Y, Huang H, Wang K, et al. (2021) Selecting optimal combination of data channels for semantic segmentation in city information modelling (CIM). Remote Sens 13: 1367. https://doi.org/10.3390/rs13071367 doi: 10.3390/rs13071367
|
Figures(4) / Tables(3)

Lei Fan, Haoyu Guan. A comparative overview of city-level carbon accounting: Key processes and considerations[J]. AIMS Environmental Science, 2025, 12(3): 400-418. doi: 10.3934/environsci.2025018


 DownLoad: