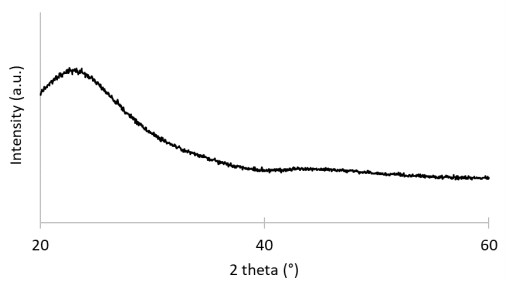
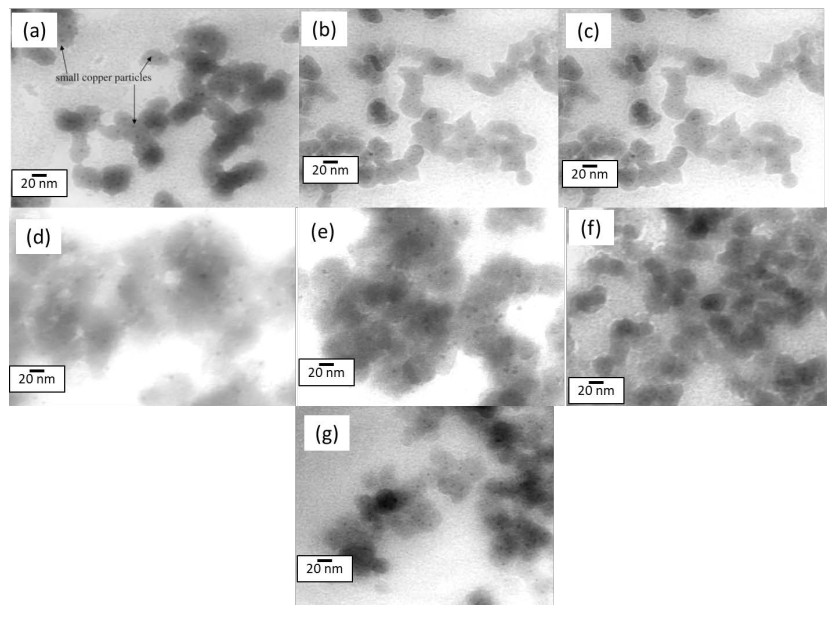
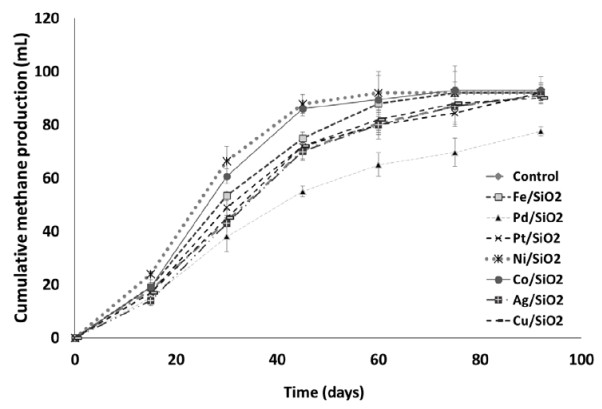
The present work investigates the enhancement effect of seven different catalysts made of Cu/SiO2, Pd/SiO2, Pt/SiO2, Ni/SiO2, Co/SiO2, Ag/SiO2 and Fe/SiO2 nanoparticles (NPs) on methane production during thermophilic anaerobic digestion. The tested NPs were synthesized by the sol-gel process and encapsulated in porous silica (SiO2) to prevent their coagulation and agglomeration. Transmission electron microscopy (TEM) pictures confirmed the specific morphologies of all seven catalysts.
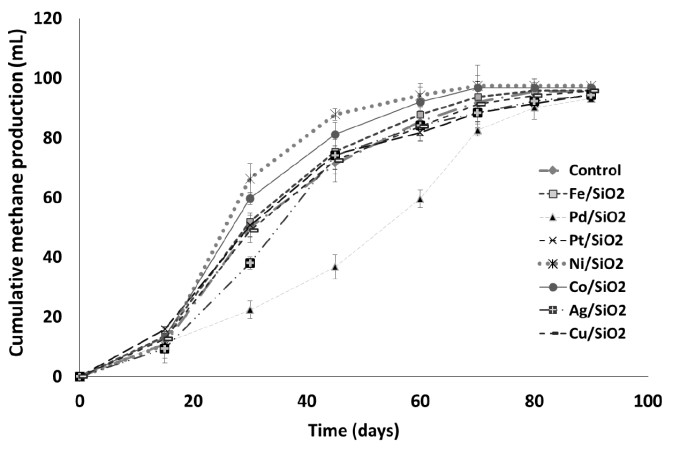
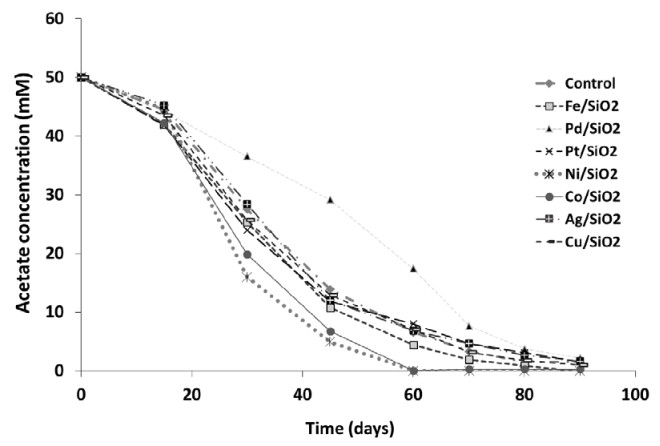
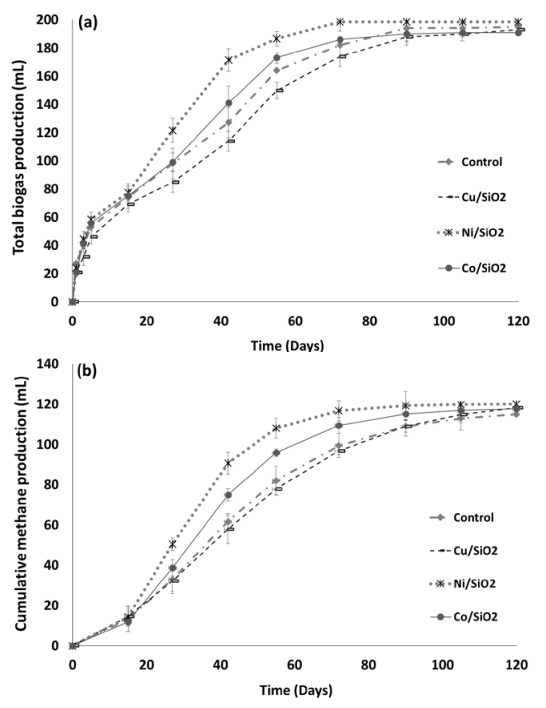
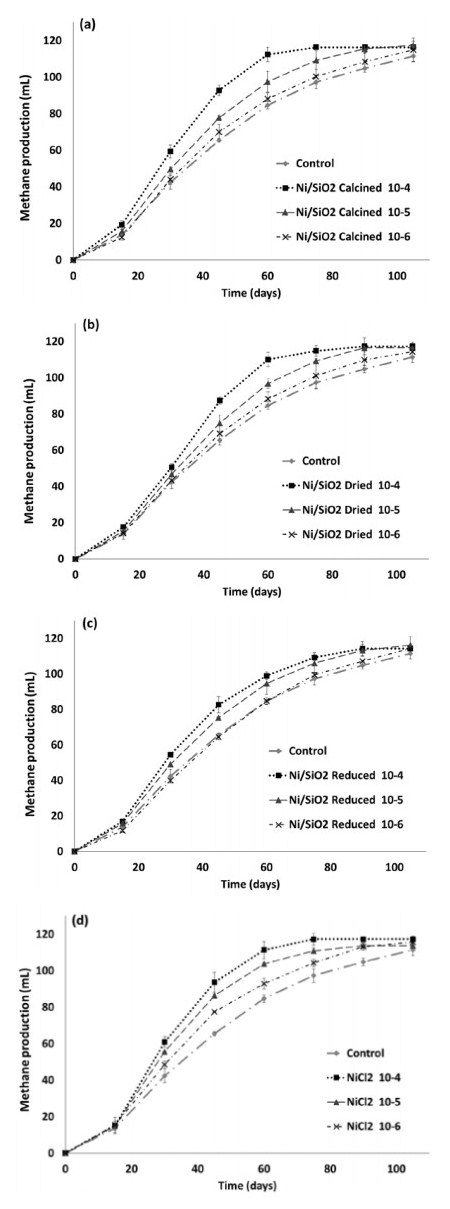
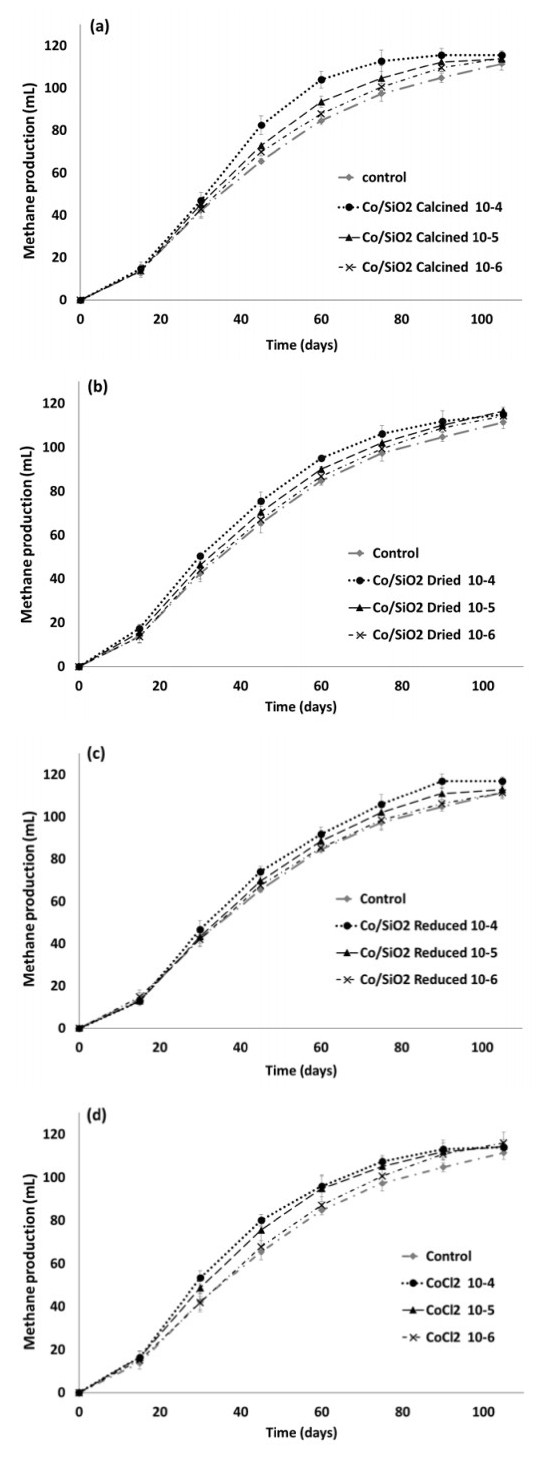
Then, these 7 NPs were tested first in batch experiments with acetate as a carbon substrate for bio-methane production. Ni/SiO2 and Co/SiO2 showed the best enhancement of methane production from acetate. From this part, both NPs were tested for bio-methane production on two different substrates: starch and glucose. With the starch substrate, the improvements of methane production were equal to 47% and 22%, respectively, for Ni- and Co/SiO2 compared to control sample. In the last part of this work, the influences of NP concentration and thermal pre-treatment applied to the NPs on bio-methane production from glucose were investigated. The results showed that all forms of nickel and cobalt NPs enhance the methane production, and their effect increased with the increase of their concentrations. The best sample was the calcined nickel NPs at a concentration of 10–4 mol L–1, leading to a methane production rate of 72.5% compared to the control.
Citation: Alaa E. Al-Ahmad, Stéphanie D. Lambert, Julien G. Mahy, Benoît Heinrichs, Wissal Wannoussa, Ludivine Tasseroul, Frédéric Weekers, Philippe Thonart, Serge Hiligsmann. Investigation of the potential effect of encapsulated metal nanoparticles on enhancement of thermophilic anaerobic digestion[J]. AIMS Environmental Science, 2023, 10(6): 764-793. doi: 10.3934/environsci.2023042
The present work investigates the enhancement effect of seven different catalysts made of Cu/SiO2, Pd/SiO2, Pt/SiO2, Ni/SiO2, Co/SiO2, Ag/SiO2 and Fe/SiO2 nanoparticles (NPs) on methane production during thermophilic anaerobic digestion. The tested NPs were synthesized by the sol-gel process and encapsulated in porous silica (SiO2) to prevent their coagulation and agglomeration. Transmission electron microscopy (TEM) pictures confirmed the specific morphologies of all seven catalysts.
Then, these 7 NPs were tested first in batch experiments with acetate as a carbon substrate for bio-methane production. Ni/SiO2 and Co/SiO2 showed the best enhancement of methane production from acetate. From this part, both NPs were tested for bio-methane production on two different substrates: starch and glucose. With the starch substrate, the improvements of methane production were equal to 47% and 22%, respectively, for Ni- and Co/SiO2 compared to control sample. In the last part of this work, the influences of NP concentration and thermal pre-treatment applied to the NPs on bio-methane production from glucose were investigated. The results showed that all forms of nickel and cobalt NPs enhance the methane production, and their effect increased with the increase of their concentrations. The best sample was the calcined nickel NPs at a concentration of 10–4 mol L–1, leading to a methane production rate of 72.5% compared to the control.

| [1] |
Ter Heijne A, Hamelers HVM, Buisman CJN (2007) Microbial fuel cell operation with continuous biological ferrous iron oxidation of the catholyte. Environ Sci Technol 41: 4130–4134. https://doi.org/10.1021/es0702824 doi: 10.1021/es0702824

|
| [2] |
Alkan-Ozkaynak A, Karthikeyan KG (2011) Anaerobic digestion of thin stillage for energy recovery and water reuse in corn-ethanol plants. Bioresour Technol 102: 9891–9896. https://doi.org/10.1016/j.biortech.2011.08.028 doi: 10.1016/j.biortech.2011.08.028
|
| [3] |
Rocha-Meneses L, Hari A, Inayat A, et al (2022) Application of nanomaterials in anaerobic digestion processes: A new strategy towards sustainable methane production. Biochem Eng J 188: 108694. https://doi.org/10.1016/j.bej.2022.108694 doi: 10.1016/j.bej.2022.108694
|
| [4] |
Weiland P (2010) Biogas production: Current state and perspectives. Appl Microbiol Biotechnol 85:849–860. https://doi.org/10.1007/s00253-009-2246-7 doi: 10.1007/s00253-009-2246-7
|
| [5] |
Zheng X, Zou D, Wu Q, et al (2022) Review on fate and bioavailability of heavy metals during anaerobic digestion and composting of animal manure. Waste Management 150: 75–89. https://doi.org/10.1016/j.wasman.2022.06.033 doi: 10.1016/j.wasman.2022.06.033
|
| [6] |
Zhao W, Zheng Y-M, Shuai, et al (2009) Effect of Hexavalent Chromium on Performance of Membrane Bioreactor in Wastewater Treatment. J Environ Engin 135: 796–805. https://doi.org/10.1061/ASCE0733-93722009135:9796 doi: 10.1061/ASCE0733-93722009135:9796
|
| [7] |
Lee YJ, Lee DJ (2019) Impact of adding metal nanoparticles on anaerobic digestion performance – A review. Bioresour Technol 292: 121926. https://doi.org/10.1016/j.biortech.2019.121926 doi: 10.1016/j.biortech.2019.121926
|
| [8] |
Pobeheim H, Munk B, Johansson J, Guebitz GM (2010) Influence of trace elements on methane formation from a synthetic model substrate for maize silage. Bioresour Technol 101: 836–839. https://doi.org/10.1016/j.biortech.2009.08.076 doi: 10.1016/j.biortech.2009.08.076
|
| [9] | Hausinger RP (1987) Nickel Utilization by Microorganisms. Microbiol Rev 51: 22–42 |
| [10] | Diekert G, Konheiser U, Piechulla K, Mikrobiologie RKT (1981) Nickel Requirement and Factor F430 Content of Methanogenic Bacteria. J Bacteriol 148: 459–464 |
| [11] |
Banks CJ, Zhang Y, Jiang Y, Heaven S (2012) Trace element requirements for stable food waste digestion at elevated ammonia concentrations. Bioresour Technol 104: 127–135. https://doi.org/10.1016/j.biortech.2011.10.068 doi: 10.1016/j.biortech.2011.10.068
|
| [12] |
Hassanein A, Naresh Kumar A, Lansing S (2021) Impact of electro-conductive nanoparticles additives on anaerobic digestion performance - A review. Bioresour Technol 342: 126023. https://doi.org/10.1016/j.biortech.2021.126023 doi: 10.1016/j.biortech.2021.126023
|
| [13] |
Feng XM, Karlsson A, Svensson BH, Bertilsson S (2010) Impact of trace element addition on biogas production from food industrial waste - Linking process to microbial communities. FEMS Microbiol Ecol 74: 226–240. https://doi.org/10.1111/j.1574-6941.2010.00932.x doi: 10.1111/j.1574-6941.2010.00932.x
|
| [14] |
Zhu X, Blanco E, Bhatti M, Borrion A (2021) Impact of metallic nanoparticles on anaerobic digestion: A systematic review. Sci Total Environ 757: 143747. https://doi.org/10.1016/j.scitotenv.2020.143747 doi: 10.1016/j.scitotenv.2020.143747
|
| [15] | Patel GB (1984) Characterization and nutritional properties of Methanothrix concilii sp. nov., a mesophilic, aceticlastic methanogen. Can J Microbiol 30: 1383-1396. |
| [16] |
Zhang B, Zhao Z, Ma R, et al (2024) Unveiling the mechanisms of Fe (Ⅲ)-loaded chitosan composite (CTS-Fe) in enhancing anaerobic digestion of waste activated sludge. J Environ Sci (China) 138: 200–211. https://doi.org/10.1016/j.jes.2023.04.001 doi: 10.1016/j.jes.2023.04.001
|
| [17] |
Jadhava P, Muhammad N, Bhuyar P, et al (2021) A review on the impact of conductive nanoparticles (CNPs) in anaerobic digestion: Applications and limitations. Environ Technol Innov 23: 101526. https://doi.org/10.1016/j.eti.2021.101526 doi: 10.1016/j.eti.2021.101526
|
| [18] |
Bakari O, Njau KN, Noubactep C (2023) Effects of zero-valent iron on sludge and methane production in anaerobic digestion of domestic wastewater. Case Stud Chemical Environ Engin 8: 100377. https://doi.org/10.1016/j.cscee.2023.100377 doi: 10.1016/j.cscee.2023.100377
|
| [19] | Schonheit P, Moll J, Thauer RK (1979) Nickel, Cobalt, and Molybdenum Requirement for Growth of Methanobacterium thermoautotrophicum. Arch Microbiol 123: 105–107 |
| [20] |
Zandvoort MH, van Hullebusch ED, Fermoso FG, Lens PNL (2006) Trace metals in anaerobic granular sludge reactors: Bioavailability and dosing strategies. Eng Life Sci 6: 293–301. https://doi.org/10.1002/elsc.200620129 doi: 10.1002/elsc.200620129
|
| [21] | Ehrlich HL (2002) Geomicrobiology. M. Dekker |
| [22] | Králik M, Biffis A (2001) Catalysis by metal nanoparticles supported on functional organic polymers. J Mol Catal A Chem 177: 113–138 |
| [23] | Sergeev GB (2003) Cryochemistry of metal nanoparticles. J Nanopart Res 5: 529–537 |
| [24] |
Barrena R, Moral-Vico J, Font X, Sánchez A (2022) Enhancement of Anaerobic Digestion with Nanomaterials: A Mini Review. Energies (Basel) 15: 5087. https://doi.org/10.3390/en15145087 doi: 10.3390/en15145087
|
| [25] |
Gonzalez-Estrella J, Sierra-Alvarez R, Field JA (2013) Toxicity assessment of inorganic nanoparticles to acetoclastic and hydrogenotrophic methanogenic activity in anaerobic granular sludge. J Hazard Mater 260: 278–285. https://doi.org/10.1016/j.jhazmat.2013.05.029 doi: 10.1016/j.jhazmat.2013.05.029
|
| [26] |
Mu H, Chen Y, Xiao N (2011) Effects of metal oxide nanoparticles (TiO2, Al2O3, SiO2 and ZnO) on waste activated sludge anaerobic digestion. Bioresour Technol 102: 10305–10311. https://doi.org/10.1016/j.biortech.2011.08.100 doi: 10.1016/j.biortech.2011.08.100
|
| [27] |
Luna-delRisco M, Orupõld K, Dubourguier HC (2011) Particle-size effect of CuO and ZnO on biogas and methane production during anaerobic digestion. J Hazard Mater 189: 603–608. https://doi.org/10.1016/j.jhazmat.2011.02.085 doi: 10.1016/j.jhazmat.2011.02.085
|
| [28] |
Zhao W, Zhang Y, Du B, et al (2013) Enhancement effect of silver nanoparticles on fermentative biohydrogen production using mixed bacteria. Bioresour Technol 142: 240–245. https://doi.org/10.1016/j.biortech.2013.05.042 doi: 10.1016/j.biortech.2013.05.042
|
| [29] |
Han H, Cui M, Wei L, et al (2011) Enhancement effect of hematite nanoparticles on fermentative hydrogen production. Bioresour Technol 102: 7903–7909. https://doi.org/10.1016/j.biortech.2011.05.089 doi: 10.1016/j.biortech.2011.05.089
|
| [30] |
Gran S, Motiee H, Mehrdadi N, Tizghadam M (2022) Impact of Metal Oxide Nanoparticles (NiO, CoO and Fe3O4) on the Anaerobic Digestion of Sewage Sludge. Waste Biomass Valori 13: 4549–4563. https://doi.org/10.1007/s12649-022-01816-8 doi: 10.1007/s12649-022-01816-8
|
| [31] |
Zhang Y, Shen J (2007) Enhancement effect of gold nanoparticles on biohydrogen production from artificial wastewater. Int J Hydrogen Energy 32: 17–23. https://doi.org/10.1016/j.ijhydene.2006.06.004 doi: 10.1016/j.ijhydene.2006.06.004
|
| [32] |
Beckers L, Hiligsmann S, Lambert SD, et al (2013) Improving effect of metal and oxide nanoparticles encapsulated in porous silica on fermentative biohydrogen production by Clostridium butyricum. Bioresour Technol 133: 109–117. https://doi.org/10.1016/j.biortech.2012.12.168 doi: 10.1016/j.biortech.2012.12.168
|
| [33] |
Jiao J, Wan J, Ma Y, Wang Y (2019) Enhanced photocatalytic activity of AgNPs-in-CNTs with hydrogen peroxide under visible light irradiation. Environmental Science and Pollution Research 26: 26389–26396. https://doi.org/10.1007/s11356-019-05877-6 doi: 10.1007/s11356-019-05877-6
|
| [34] |
Majles Ara MH, Dehghani Z, Sahraei R, Nabiyouni G (2010) Non-linear optical properties of silver nanoparticles prepared by hydrogen reduction method. Opt Commun 283: 1650–1653. https://doi.org/10.1016/j.optcom.2009.09.025 doi: 10.1016/j.optcom.2009.09.025
|
| [35] | Bulavinets T, Varyshchuk V, Yaremchuk I, Bobitski Y (2018) Design and synthesis of silver nanoparticles with different shapes under the influence of photon flows. In: Springer Proceedings in Physics. Springer Science and Business Media, LLC, pp 231–241. |
| [36] |
Koohpeima F, Mokhtari MJ, Khalafi S (2017) The effect of silver nanoparticles on composite shear bond strength to dentin with different adhesion protocols. J Appl Oral Sci 25: 367–373. https://doi.org/10.1590/1678-7757-2016-0391 doi: 10.1590/1678-7757-2016-0391
|
| [37] |
Song H, Zhang H, Sun Z, et al (2019) Triangular silver nanoparticle U-bent fiber sensor based on localized surface plasmon resonance. AIP Adv 9. https://doi.org/10.1063/1.5111820 doi: 10.1063/1.5111820
|
| [38] | Van Cleve T, Gibara E, Linic S (2016) Electrochemical Oxygen Reduction Reaction on Ag Nanoparticles of Different Shapes. ChemCatChem 8: 256–261 |
| [39] |
Saeed W, Abbasi Z, Bilal M, et al (2023) Interactive behavior of graphene quantum dots towards noble metal surfaces. Physica E Low Dimens Syst Nanostruct 147: 115596. https://doi.org/10.1016/j.physe.2022.115596 doi: 10.1016/j.physe.2022.115596
|
| [40] |
Zhang Y, Yang Z, Zou Y, et al (2023) Novel Ag-coated nanofibers prepared by electrospraying as a SERS platform for ultrasensitive and selective detection of nitrite in food. Food Chem 135563. https://doi.org/10.1016/j.foodchem.2023.135563 doi: 10.1016/j.foodchem.2023.135563
|
| [41] |
Truong TK, Nguyen TQ, Phuong La HP, et al (2021) Insight into the degradation of p-nitrophenol by visible-light-induced activation of peroxymonosulfate over Ag/ZnO heterojunction. Chemosphere 268: 129291. https://doi.org/10.1016/j.chemosphere.2020.129291 doi: 10.1016/j.chemosphere.2020.129291
|
| [42] |
Wasilewska A, Klekotka U, Zambrzycka M, et al (2023) Physico-chemical properties and antimicrobial activity of silver nanoparticles fabricated by green synthesis. Food Chem 400: 133960. https://doi.org/10.1016/j.foodchem.2022.133960 doi: 10.1016/j.foodchem.2022.133960
|
| [43] |
Dhanya NP (2017) Non linear optical investigations of silver nanoparticles synthesised by curcumin reduction. Opt Mater (Amst) 73: 384–387. https://doi.org/10.1016/j.optmat.2017.08.026 doi: 10.1016/j.optmat.2017.08.026
|
| [44] |
Mahy JG, Claude V, Sacco L, Lambert SD (2017) Ethylene polymerization and hydrodechlorination of 1, 2-dichloroethane mediated by nickel(Ⅱ) covalently anchored to silica xerogels. J Solgel Sci Technol 81: 59–68. https://doi.org/10.1007/s10971-016-4272-0 doi: 10.1007/s10971-016-4272-0
|
| [45] |
Claude V, Mahy JG, Douven S, et al (2019) Ni- and Fe-doped g-Al2O3 or olivine as primary catalyst for toluene reforming. Mater Today Chem 14: 100197. https://doi.org/10.1016/j.mtchem.2019.100197 doi: 10.1016/j.mtchem.2019.100197
|
| [46] |
Douven S, Mahy JG, Wolfs C, et al (2020) Efficient N, Fe Co-doped TiO2 active under cost-effective visible LED light: From powders to films. Catalysts 10: 547. https://doi.org/10.3390/catal10050547 doi: 10.3390/catal10050547
|
| [47] |
Abou Elez RMM, Attia ASA, Tolba HMN, et al (2023) Molecular identification and antiprotozoal activity of silver nanoparticles on viability of Cryptosporidium parvum isolated from pigeons, pigeon fanciers and water. Sci Rep 13: 3109. https://doi.org/10.1038/s41598-023-30270-2 doi: 10.1038/s41598-023-30270-2
|
| [48] |
Manikandan DB, Sridhar A, Krishnasamy Sekar R, et al (2021) Green fabrication, characterization of silver nanoparticles using aqueous leaf extract of Ocimum americanum (Hoary Basil) and investigation of its in vitro antibacterial, antioxidant, anticancer and photocatalytic reduction. J Environ Chem Eng 9: 104845. https://doi.org/10.1016/j.jece.2020.104845 doi: 10.1016/j.jece.2020.104845
|
| [49] |
Rahman AU, Khan AU, Yuan Q, et al (2019) Tuber extract of Arisaema flavum eco-benignly and effectively synthesize silver nanoparticles: Photocatalytic and antibacterial response against multidrug resistant engineered E. coli QH4. J Photochem Photobiol B 193: 31–38. https://doi.org/10.1016/j.jphotobiol.2019.01.018 doi: 10.1016/j.jphotobiol.2019.01.018
|
| [50] |
Samuel MS, Jose S, Selvarajan E, et al (2020) Biosynthesized silver nanoparticles using Bacillus amyloliquefaciens; Application for cytotoxicity effect on A549 cell line and photocatalytic degradation of p-nitrophenol. J Photochem Photobiol B 202: 111642. https://doi.org/10.1016/j.jphotobiol.2019.111642 doi: 10.1016/j.jphotobiol.2019.111642
|
| [51] |
Mahy JG, Tasseroul L, Zubiaur A, et al (2014) Highly dispersed iron xerogel catalysts for p-nitrophenol degradation by photo-Fenton effects. Microporous and Mesoporous Materials 197: 164–173. https://doi.org/10.1016/j.micromeso.2014.06.009 doi: 10.1016/j.micromeso.2014.06.009
|
| [52] |
Mahy JG, Tasseroul L, Tromme O, et al (2019) Hydrodechlorination and complete degradation of chlorinated compounds with the coupled action of Pd/SiO < inf > 2 < /inf > and Fe/SiO < inf > 2 < /inf > catalysts: Towards industrial catalyst synthesis conditions. J Environ Chem Eng 7: 103014. https://doi.org/10.1016/j.jece.2019.103014 doi: 10.1016/j.jece.2019.103014
|
| [53] |
Mahy JG, Delbeuck T, Tran KY, et al (2023) Green Chemistry for the Transformation of Chlorinated Wastes: Catalytic Hydrodechlorination on Pd-Ni and Pd-Fe Bimetallic Catalysts Supported on SiO2. Gels 9: 275. https://doi.org/10.3390/gels9040275 doi: 10.3390/gels9040275
|
| [54] |
Lambert S, Alié C, Pirard JP, Heinrichs B (2004) Study of textural properties and nucleation phenomenon in Pd/SiO2, Ag/SiO2 and Cu/SiO2 cogelled xerogel catalysts. J Non Cryst Solids 342: 70–81. https://doi.org/10.1016/j.jnoncrysol.2004.06.005 doi: 10.1016/j.jnoncrysol.2004.06.005
|
| [55] |
Heinrichs B, Rebbouh L, Geus JW, et al (2008) Iron(Ⅲ) species dispersed in porous silica through sol-gel chemistry. J Non Cryst Solids 354: 665–672. https://doi.org/10.1016/j.jnoncrysol.2007.07.071 doi: 10.1016/j.jnoncrysol.2007.07.071
|
| [56] |
Mahy JG, Lambert SD, Léonard GLM, et al (2016) Towards a large scale aqueous sol-gel synthesis of doped TiO2: Study of various metallic dopings for the photocatalytic degradation of p-nitrophenol. J Photochem Photobiol A Chem 329: 189–202. https://doi.org/10.1016/j.jphotochem.2016.06.029 doi: 10.1016/j.jphotochem.2016.06.029
|
| [57] |
Hiligsmann S, Masset J, Hamilton C, et al (2011) Comparative study of biological hydrogen production by pure strains and consortia of facultative and strict anaerobic bacteria. Bioresour Technol 102: 3810–3818. https://doi.org/10.1016/j.biortech.2010.11.094 doi: 10.1016/j.biortech.2010.11.094
|
| [58] |
Hamilton C, Hiligsmann S, Beckers L, et al (2010) Optimization of culture conditions for biological hydrogen production by Citrobacter freundii CWBI952 in batch, sequenced-batch and semicontinuous operating mode. Int J Hydrogen Energy 35: 1089–1098. https://doi.org/10.1016/j.ijhydene.2009.10.073 doi: 10.1016/j.ijhydene.2009.10.073
|
| [59] |
Gil MM, Brandão TRS, Silva CLM (2006) A modified Gompertz model to predict microbial inactivation under time-varying temperature conditions. J Food Eng 76: 89–94. https://doi.org/10.1016/j.jfoodeng.2005.05.017 doi: 10.1016/j.jfoodeng.2005.05.017
|
| [60] | Zwietering MH, Jongenburger I, Rombouts FM, et al (1990) Modeling of the Bacterial Growth Curve. Appl Environ Microbiol 1875–1881 |
| [61] |
Zhu B, Gikas P, Zhang R, et al (2009) Characteristics and biogas production potential of municipal solid wastes pretreated with a rotary drum reactor. Bioresour Technol 100: 1122–1129. https://doi.org/10.1016/j.biortech.2008.08.024 doi: 10.1016/j.biortech.2008.08.024
|
| [62] |
Lambert S, Cellier C, Grange P, et al (2004) Synthesis of Pd/SiO2, Ag/SiO2, and Cu/SiO2 cogelled xerogel catalysts: Study of metal dispersion and catalytic activity. J Catal 221: 335–346. https://doi.org/10.1016/j.jcat.2003.07.014 doi: 10.1016/j.jcat.2003.07.014
|
| [63] | Toshima N (2004) METAL NANOPARTICLES FOR CATALYSIS. In: Liz-Marzán L, Kamat P (eds) Nanoscale Materials. Springer, pp 79–96 |
| [64] | Hickey RF, Vanderwielen J, Switzenbaum MS (1989) THE EFFECT OF HEAVY METALS ON METHANE PRODUCTION AND HYDROGEN AND CARBON MONOXIDE LEVELS DURING BATCH ANAEROBIC SLUDGE DIGESTION. Water Res 23: 207–218 |
| [65] |
Sasaki K, Morita M, Hirano S ichi, et al (2009) Effect of adding carbon fiber textiles to methanogenic bioreactors used to treat an artificial garbage slurry. J Biosci Bioeng 108: 130–135. https://doi.org/10.1016/j.jbiosc.2009.03.003 doi: 10.1016/j.jbiosc.2009.03.003
|
| [66] | Fathepure BZ (1987) Factors Affecting the Methanogenic Activity of Methanothrix soehngenii VNBFt. Appl Environ Microbiol 53: 2978–2982 |
| [67] |
Wu D, Yang Z, Tian G (2011) Inhibitory effects of Cu (Ⅱ) on fermentative methane production using bamboo wastewater as substrate. J Hazard Mater 195: 170–174. https://doi.org/10.1016/j.jhazmat.2011.08.021 doi: 10.1016/j.jhazmat.2011.08.021
|
| [68] |
Karri S, Sierra-Alvarez R, Field JA (2006) Toxicity of copper to acetoclastic and hydrogenotrophic activities of methanogens and sulfate reducers in anaerobic sludge. Chemosphere 62: 121–127. https://doi.org/10.1016/j.chemosphere.2005.04.016 doi: 10.1016/j.chemosphere.2005.04.016
|
| [69] | Pavlostathis SG, Maeng SK (2000) FATE AND EFFECT OF SILVER ON THE ANAEROBIC DIGESTION PROCESS. Water Res 34: 3957–3966 |
| [70] | Williams CM, Shih JCH, Spears JW (1986) Effect of Nickel on Biological Methane Generation from a Laboratory Poultry Waste Digester. Biotechnol Bioeng 28: 1608–1610 |
| [71] | Canovas-Diaz M, Howell JA (1986) EFFECT OF NICKEL ON METHANE PRODUCTION AND BUTYRIC ACID UTILIZATION IN A DOWNFLOW FIXED-FILM REACTOR. Biotechnol Lett 8: 287–292 |
| [72] | Gonzalez-Gil G, Kleerebezem R, Lettinga G (1999) Effects of Nickel and Cobalt on Kinetics of Methanol Conversion by Methanogenic Sludge as Assessed by On-Line CH 4 Monitoring. Appl Environ Microbiol 65: 1789–1793 |
| [73] |
Hu QH, Li XF, Liu H, et al (2008) Enhancement of methane fermentation in the presence of Ni2+ chelators. Biochem Eng J 38: 98–104. https://doi.org/10.1016/j.bej.2007.07.002 doi: 10.1016/j.bej.2007.07.002
|
| [74] | Murray WD, Van Den Berg L (1981) Effects of Nickel, Cobalt, and Molybdenum on Performance of Methanogenic Fixed-Film Reactorst. Appl Environ Microbiol 42: 502–505 |
| [75] | Kumar A, Miglani P, Gupta RK, Bhattacharya TK (2006) Impact of Ni(Ⅱ), Zn(Ⅱ) and Cd(Ⅱ) on biogassification of potato waste. J Environ Biol 27: 61–66 |
| [76] |
Lo HM, Chiang CF, Tsao HC, et al (2012) Effects of spiked metals on the MSW anaerobic digestion. Waste Manage Res 30: 32–48. https://doi.org/10.1177/0734242X10383079 doi: 10.1177/0734242X10383079
|
| [77] | Kalyuzhnyi S V (1997) BATCH ANAEROBIC DIGESTION OF GLUCOSE AND ITS MATHEMATICAL MODELING. Ⅱ. DESCRIPTION, VERIFICATION AND APPLICATION OF MODEL. Bioresour Technol 59: 249–258 |
| [78] |
Mulrooney SB, Hausinger RP (2003) Nickel uptake and utilization by microorganisms. FEMS Microbiol Rev 27: 239–261. https://doi.org/10.1016/S0168-6445(03)00042-1 doi: 10.1016/S0168-6445(03)00042-1
|
| [79] | Ragsdale SW (2006) Nickel Enzymes & Cofactors. In: Encyclopedia of Inorganic Chemistry. John Wiley & Sons, pp 1–16 |
| [80] |
Yang Y, Zhang C, Hu Z (2013) Impact of metallic and metal oxide nanoparticles on wastewater treatment and anaerobic digestion. Environ Sci Processes Impacts 15: 39–48. https://doi.org/10.1039/c2em30655g doi: 10.1039/c2em30655g
|
| [81] |
Mu H, Chen Y (2011) Long-term effect of ZnO nanoparticles on waste activated sludge anaerobic digestion. Water Res 45: 5612–5620. https://doi.org/10.1016/j.watres.2011.08.022 doi: 10.1016/j.watres.2011.08.022
|
| [82] |
Li Q, Mahendra S, Lyon DY, et al (2008) Antimicrobial nanomaterials for water disinfection and microbial control: Potential applications and implications. Water Res 42: 4591–4602. https://doi.org/10.1016/j.watres.2008.08.015 doi: 10.1016/j.watres.2008.08.015
|
| [83] |
Abdelsalam E, Samer M, Attia YA, et al (2016) Comparison of nanoparticles effects on biogas and methane production from anaerobic digestion of cattle dung slurry. Renew Energy 87: 592–598. https://doi.org/10.1016/j.renene.2015.10.053 doi: 10.1016/j.renene.2015.10.053
|
| [84] |
Grosser A, Grobelak A, Rorat A, et al (2021) Effects of silver nanoparticles on performance of anaerobic digestion of sewage sludge and associated microbial communities. Renew Energy 171: 1014–1025. https://doi.org/10.1016/j.renene.2021.02.127 doi: 10.1016/j.renene.2021.02.127
|
Figures(10) / Tables(7)

Alaa E. Al-Ahmad, Stéphanie D. Lambert, Julien G. Mahy, Benoît Heinrichs, Wissal Wannoussa, Ludivine Tasseroul, Frédéric Weekers, Philippe Thonart, Serge Hiligsmann. Investigation of the potential effect of encapsulated metal nanoparticles on enhancement of thermophilic anaerobic digestion[J]. AIMS Environmental Science, 2023, 10(6): 764-793. doi: 10.3934/environsci.2023042


 DownLoad: