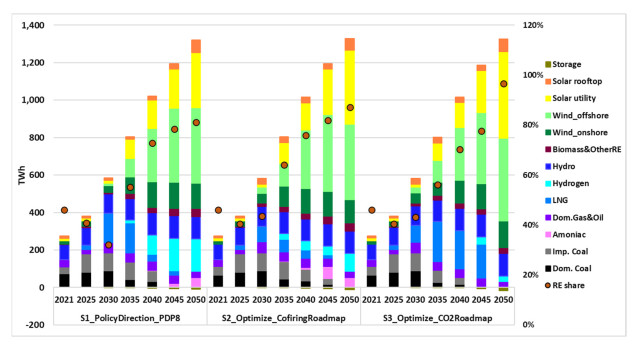
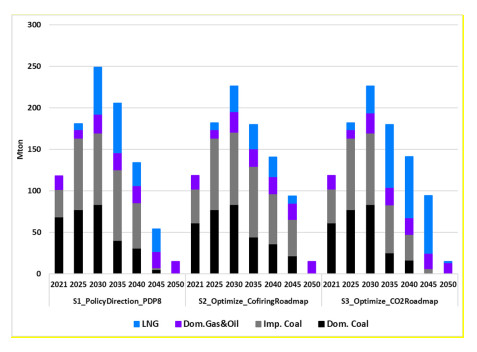
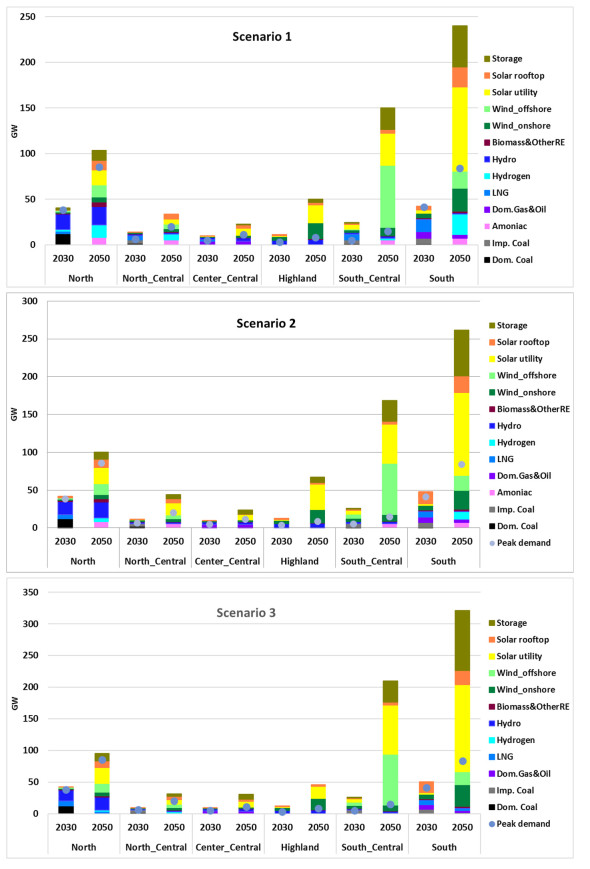
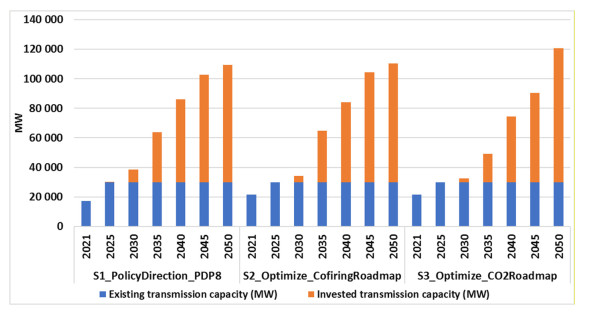
Nomenclature: e: electricity; h: heat; f: fuel; t: time; x: transmission line; a: area; HY: Hydro; w: Emissions; a: annual capacity; η: marginal efficiency; cv: extraction coefficient; cb: back pressure coefficient; k: idle fuel consumption; r: variable resource; m: minimum unit load; loss: loss factor; A: annual resource; T: target; W: emission factor; u: wind speed at turbine height; γ: installed capacity of wind turbine; M: maximum wind speed; g: power curve characteristic coefficient of wind turbine; Kw: smoothing coefficient, characterizing wind power distribution in the calculation area; ϵ: wind speed compensation coefficient, representing the discrepancy between actual power and theoretical power curve from manufacturer; G: generation (MW); D: demand (MW); K: capacity (MW); X: transmission (MW); Ⅰ: investments (MW); S: start units (#); Dn: shutdown units (#); O: units online (#); L: storage level (MWh); Z: system costs
1.
Introduction
Climate change is one of the most significant challenges in the world today, making the reduction of greenhouse gas emissions and the achievement of Net Zero emissions a critical objective. As of November 2023, approximately 145 countries have announced or are considering Net Zero targets, including major emitters such as China (2060), the EU (2050), the USA (2050), and India (2070), which together account for more than half of global greenhouse gas emissions [1]. Despite growing global commitment, fossil fuels still accounted for 60.7% of global electricity production in 2023, more than double the share of renewable energy (RE) [2].
Being among the countries most severely impacted by climate change [3], Vietnam has committed to achieving Net Zero emissions by 2050, specifically aiming for the power sector's emissions not to exceed 35 million tons of CO2 by 2050 [4,5]. The power sector is central to this transition, and effective long-term generation expansion planning plays a vital role in achieving national Net Zero targets. These mechanisms generally fall into two main categories: (ⅰ) market-based systems, found in parts of Europe, the Americas, Central Africa, Australia, and New Zealand; and (ⅱ) centralized planning systems, adopted in other regions for long-term regulation and planning [6,7,8,9,10,11]. Vietnam currently utilizes a centralized planning approach, governed by the Planning Law [12], with its latest plan, Power Development Plan Ⅷ, approved on May 15, 2023 [13].
A significant challenge in pursuing the Net Zero goal involves managing existing and committed thermal power plants. Potential solutions include decommissioning, co-firing green fuel (biomass, green hydrogen, green ammonia), installing Carbon Capture, Utilization and Storage (CCUS) technologies for existing plants, considering new thermal candidates with these technologies, or avoiding new thermal power plants altogether. Different planning approaches can guide these decisions within a long-term framework.
One common approach (hereafter referred to as Approach 1) involves directly constraining the CO2 emissions pathway and allowing the model to determine the optimal set of actions to meet this constraint. This approach is widely adopted in generation expansion studies for various countries pursuing Net Zero targets. The Approach 1 has been adopted in the generation expansion studies in most countries, including European countries [14], the UK [15], Turkey [16], China [17], Taiwan [18], South Korea [19], and Pakistan [20], where a CO2 pathway is established to meet their Net Zero commitments, based on the 1.5 ℃ Mitigation Pathway [21].
An alternative approach (hereafter referred to as Approach 2) involves predefining the timeline and co-firing ratios for thermal plants, which naturally leads to a reduction in CO2 emissions. In Vietnam, PDP Ⅷ [13], for instance, specifies a predefined co-firing pathway for coal and liquefied natural gas (LNG) plants over time, prohibiting new coal plants after 2030 and new LNG plants after 2035. While Approach 1 can lead to cost-optimal outcomes, Approach 2 may minimize certain legal or social risks associated with plant changes [22].
Previous studies have examined Vietnam's power system planning toward Net Zero or related goals, utilizing elements of these approaches. The Vietnam Energy Outlook Report (EOR) (both 2021 and 2023 editions) [23,24] developed scenarios aiming for Net Zero by 2050 using Approach 1 (direct CO2 constraints). However, EOR 2021 did not fully consider all thermal plant solutions like co-firing or CCUS for existing plants [23], and crucially, both EOR studies used different datasets compared to the published PDP Ⅷ regarding key inputs like load forecasts, co-firing costs, fuel price forecasts, and renewable energy potential, making direct comparisons difficult. The Vietnam Low Emission Energy Program (VLEEP Ⅱ) [25], which supported long-term power planning in PDP Ⅷ, followed Approach 2 (the co-firing pathway) but also used inconsistent data compared to the published planning (e.g., demand forecast). Other studies modeling the planning of the Vietnamese power system focused on the necessity of a transmission system with a high share of renewable energy sources; however, these studies involved numerous simplifications, including a limited range of power source types, incomplete operating parameters, fuel constraints, and RE potential, not considering the Net Zero target [26,27]. In a study by Do Thi Hiep & Clemens Hoffmann [28], a CO2 emission pathway was established with two scenarios of emission reductions. 8% and 25% by 2030 (Approach 1), aligned with Vietnam's commitments at COP 21; however, this study lacked a focus on Net Zero target and relied on outdated data.
Although several studies have investigated Vietnam's power system planning using either Approach 1 or Approach 2, they typically rely on datasets that are not fully aligned with the official data from PDP Ⅷ. This presents a critical research gap: to date, no study has systematically applied both fundamental planning approaches to the Vietnamese power system using a unified dataset consistent with the approved PDP Ⅷ. The lack of such a comparative analysis with aligned input data makes it difficult to definitively evaluate the implications of different strategies and to confirm what truly represents the optimal pathway for Vietnam to achieve its Net Zero goal by 2050. This study addresses that gap by conducting a long-term generation expansion planning analysis for Vietnam under the same input assumptions, employing both Approach 2 (co-firing pathway) as PDP Ⅷ and Approach 1 (CO2 emission pathway), which considers all thermal power plant options, including early decommissioning, co-firing with green fuels, retrofitting with CCUS, and the development of new thermal candidates with or without low-carbon technologies. The CO2 emission pathway in Approach 1 will be taken from Approach 2 to make the same basis for comparison purposes. Through this unique comparative analysis using a consistent data foundation, this study aims to generate robust findings and provide reasonable recommendations for the optimal pathway toward achieving Vietnam's Net Zero emissions target by 2050, with insights into the feasibility and economic efficiency of the co-firing pathway emphasized in PDP Ⅷ.
The remainder of this paper is organized as follows: Section 2 presents the methodology in detail, including the formulation of the capacity expansion optimization problem, scenario development, and input data used for the simulation. Section 3 provides an analysis of the results obtained from the three scenarios, which are further discussed in Section 4. Finally, Section 5 concludes the study.
2.
Materials and assumption
2.1. Methodology
The methodology of the study uses the power development planning problem, also known as capacity expansion optimization, applied to the Vietnamese power system. The traditional power development planning problem has been thoroughly researched and refined according to various studies and reports [29,30,31,32,33,34]. The inputs to the problem include load forecasts, technology parameters, fuel types, potential, and profiles of renewable energy sources, while the output is the optimal electricity generation mix for each region/area during the planning period, along with the inter-regional transmission capacity requirements. Currently, some new factors have been considered in the power development planning problem, such as demand response integration, electric vehicles, hydrogen storage, fuel co-firing, and the Net Zero goal in many studies [35,36,37,38,39].
In the capacity expansion planning problem, the objective function commonly used is to minimize the total cost of the electricity system over the planning period. This includes investment costs for generation and transmission infrastructure, operating costs of the system, including fuel costs, operation and maintenance costs, and unit commitment costs, emission costs (external costs), inter-regional transmission costs, penalties for energy shortfalls, generation curtailments, and reserve shortages.
The objective function of the capacity expansion planning problem [31,40,41] is shown below:
The constraints of this problem include fundamental constraints such as source-load balance, supply reliability, primary fuel source potential limits, system operation constraints, and inter-regional transmission limits. Additionally, planners may consider policy constraints that reflect desired future energy development directions.
Energy balance constraints group:
+ Total generation and imports are equal to total demand and exports:
+ Generation for heat is equal to heat demand:
+ Fuel consumption balancing (consider idle fuel consumption when unit's online):
Technology constraints group:
+ Capacity limits constraint for thermal units including extraction technology (5) and back pressure technology (6):
+ Renewable energy constraint:
+ Reservoir hydro constraint:
Transmission constraints group:
Unit Commitment (UC) constraints group:
+ Commitment logic constraint
+ Minimum fuel use of units:
+ Maximum fuel input of units:
Resource constraints:
+ Fuel supply limitation (for thermal unit):
+ Capacity constraint (for RE potential):
Policy targets group:
+ Policy of minimum capacity development by fuel:
+ Policy of maximum emission cap:
Full load hours requirement group (for dispatching):
In this study, BALMOREL software, also used for PDP Ⅷ, will be employed. This software is open-source (licensed GAMS required), widely validated, and capable of developing the models.
2.2. Proposal for scenarios
As presented in section 1, this study calculates the optimal power development plan for Vietnam's power system using both approaches based on the load forecast and the data published in the approved PDP Ⅷ. The first approach involves directly constraining CO2 emissions to gradually reduce to "0" and allowing the model to optimally choose the development path. The second approach will establish a fuel transition roadmap as outlined in PDP Ⅷ (where CO2 emissions naturally decrease over time). Three scenarios were analyzed: Scenario S1 and Scenario S2 followed Approach 1, while Scenario S3 followed Approach 2. Table 1 summarizes the constraints for the three scenarios.
Scenario S1: Predefined fuel conversion pathway with policy direction of PDP Ⅷ: Scenario S1 complied with the development orientation and policies outlined in PDP Ⅷ, as follows:
Commitment to include in the model all new thermal power plants according to approved PDP Ⅷ, including 13 LNG projects (22.5 GW), 6 coal-fired power projects (6.1 GW), 3 domestic gas-fired power plants (7.2 GW), 25 medium/large hydropower projects over 30 MW (2.8 GW) up to 2030, and 2 LNG projects (3 GW) up to 2035.
Develop a fuel transition roadmap for existing and committed thermal power plants based on technological feasibility and ensuring economic viability for projects as follows: (ⅰ) Coal-fired power plants will co-fire biomass (for circulating fluidized bed CFB technology), co-fire ammonia (for pulverized coal (PC) technology) at least 20% (in terms of energy output) after 20 years of operation (starting from 2030), co-fire at least 60% after 25 years of operation, and fully transition to clean fuel after 30 years of operation. For LNG gas-fired power plants, co-fire hydrogen at least 20% (in terms of energy output) after 10 years of operation, co-fire at least 60% after 15 years of operation, and fully transition to hydrogen after 20 years of operation. By 2050, all coal-fired and gas-fired power plants must fully transition to clean fuel (including plants that have not yet reached the scheduled transition period).
For new thermal power sources: The policy direction is to not develop any new coal-fired power plants after 2030 and not develop any new LNG power plants after 2035.
The capacity limit for ground-mounted solar power up to 2050 is set at 100 GW according to the policy direction of PDP Ⅷ (the technical potential for ground-mounted solar power in PDP Ⅷ is 837 GW). However, the policy aims to develop only about 100 GW by 2050, utilizing a portion of the nation's unused land as Resolution No. 39/2021/QH15 (approximately 500 hectares by 2050) for solar power development [42].
Scenario S2: Optimization of fuel conversion pathway. Scenario S2 also utilized the fuel transition pathway for thermal power plants, similar to Scenario S1. However, it allowed for more flexibility in the optimization model by only committing the thermal power plants currently under construction and medium/large hydropower plants (as opposed to all thermal power plants outlined in PDP Ⅷ, as in Scenario 1). The model permitted the development of new thermal power plants following the fuel transition pathway. The details are as follows:
Commitment to build in the model thermal power plants under construction including 2 LNG projects (2824 MW), 6 coal thermal power projects (6125 MW), 3 domestic gas thermal power clusters (7240 MW) and 25 medium/large hydropower projects of over 30 MW (2.8 GW) by 2030.
Follow the fuel transition pathway as outlined in Scenario 1.
For new thermal power plants: Only allow the development of thermal power plants that use clean fuels (green hydrogen, green ammonia) or new coal/LNG power plants that implement fuel transition or install carbon capture and storage (CCS) technology.
The potential for ground-mounted solar power is increased to 200 GW, twice the amount in Scenario 1, based on the assumption of reallocation of land and technological advancements, to investigate whether more land should be allocated for solar PV.
Scenario S3: Optimization of CO2 emissions pathway. Unlike Scenarios S1 and S2, Scenario S3 followed the approach of directly constraining CO2 emissions for each year. To enable comparison between scenarios, S3 will use the CO2 emission pathway based on the emission results from S2. S3 will also only commit thermal power plants currently under construction, while allowing the development of all thermal power plants (even those not transitioning to clean fuels) for the model to optimally choose based on emission constraints and cost optimization. This scenario permits the early decommissioning of plants based on cost optimization:
Commit thermal power plants currently under construction, including 2 LNG projects (2824 MW), 6 coal-fired power projects (6125 MW), 3 domestic gas power clusters (7240 MW), and 25 medium/large hydropower projects over 30 MW (2.8 GW) by 2030.
Follow the CO2 emission pathway based on the calculations from Scenario 2.
For new thermal power sources: Allow the development of all thermal power candidates (including coal and LNG turbines that do not switch to cleaner fuels).
Set the potential limit for ground-mounted solar power at 200 GW, similar to Scenario 2.
Allow the model to optimize and decommission plants early before the end of their lifespan.
Additionally, in all three scenarios, ground-mounted solar power by 2030 will be limited to 10.2 GW, same as in PDP Ⅷ for ensuring land use constraints.
2.3. Data inputs and assumptions
The power system of Vietnam is divided into 6 regions as shown in Figure 1. The output of the calculations will be the optimal generation mix for each region and the inter-regional transmission capacity.
The load forecast is based on the PDP Ⅷ, which projects that Vietnam's commercial electricity consumption will reach 505 billion kWh by 2030 and 1114 billion kWh by 2050. The forecasted loss and self-consumption rates are 6% and 5%, respectively, for 2030, and 5% and 4%, respectively, for 2050. Vietnam has two major load centers located at the two ends of the country: the Northern region and the Southern region. Detailed forecasts for commercial electricity consumption for the 6 regions and the typical daily load curves for each month of the 6 regions are shown in Figures 2 and 3 respectively.
Input data for thermal power sources: Input parameters regarding technology (efficiency, technical specifications, financial data, etc.) are shown in Tables S1 and S2, and fuel price forecasts are taken from the data published in the PDP Ⅷ (Table S3).
Input data for renewable energy sources:
- Solar and small hydropower sources are modeled using two characteristics: maximum capacity equivalent full-load hours (FLHs) and hourly operation profiles (VAR_T). From these two characteristics combined with installed capacity, the electricity production can be calculated at each simulation step. FLHs and VAR_T for solar power sources are taken from the Global Solar Atlas [43]. FLHs and VAR_T for small hydropower are obtained and rebuild based on Vietnam Electricity Group (EVN)'s annual report for 2021 [44].
- For reservoir hydropower sources, water can be stored to generate electricity during hours with the highest water value. The simulation characteristics of reservoir hydropower include maximum capacity equivalent full-load hours (FLHs) and weekly water inflow profiles (VAR_S), which are also taken from EVN's annual report for 2021 [44]. Additionally, reservoir characteristics (storage capacity and minimum generating capacity) are sourced from the Data Report prepared for EOR 2021 [24].
- Wind power sources can also be simulated using FLHs and VAR_T characteristics; however, Balmorel allows for wind power simulation using a method that calculates the output power directly from wind speed based on the power curve. This method has the advantage of accounting for technological advancements in wind power over the years (e.g., low-wind-speed turbines with higher FLHs and the "smoothing" effect). The power curve of a wind turbine is essentially a modified logistic function:
Since PDP Ⅷ does not publish these characteristics, the parameters are taken from [24]. The wind speed profile for the six regions is sourced from Renewable Ninja using MERRA Ⅱ data [45].
The potential of renewable energy sources (wind power, solar power, biomass power, small hydropower) and pumped-storage hydropower is taken from the data published in PDP Ⅷ and shown from Table S4 to S10.
3.
Calculation results
This section presents the key outcomes derived from the generation expansion planning model applied to Vietnam's power system under three defined scenarios (S1, S2, S3) targeting a Net Zero goal. The analysis covers several critical aspects, including the installed capacity mix, electricity generation, CO2 emission trajectories, regional power capacity, transmission infrastructure needs, and overall system costs.
3.1. Installed capacity
The result of installed capacity of power generation mix of the 3 scenarios is shown in Figure 4, and the key points are as follows:
Scenario S1—Although this scenario is the policy direction of PDP Ⅷ and commits to building all approved thermal power sources, the calculation results show a few differences:
By 2030, the flexible sources and battery storage in the Northern region reach 1.6 and 1.1 GW, respectively (compared to both 0.3 GW in PDP Ⅷ), which indicates a shortage of peaking and reserve sources in the Northern region until 2030. The installed capacity of onshore and offshore wind power decreases to 13.2 and 3.1 GW, respectively, much lower compared to 21.9 and 6 GW in PDP Ⅷ. This discrepancy does not necessarily imply that less wind capacity should be built; rather, it highlights that the approved PDP Ⅷ follows an operational back-up scenario, where 5.6 GW of LNG thermal power is advanced to 2030. Since Scenario S1 assumes the construction of all approved thermal power capacity from PDP Ⅷ, there is a tendency toward "excess" thermal power compared to the optimal level, leading to lower wind power capacity than in the approved PDP Ⅷ. In fact, the offshore wind capacity in Scenario S1 is equivalent to Scenario 2 of PDP Ⅷ that is based on optimal calculation with no backup capacity added. Other power sources such as hydropower, solar power, and biomass power in Scenario S1 are equivalent to PDP Ⅷ.
By 2050, all thermal power sources will be fully converted to clean fuels, except for 7.9 GW of domestic gas, similar to PDP Ⅷ. Regarding renewable energy sources, the optimal model selects the development of the entire potential of solar power with a total capacity of 225.5 GW (100 GW ground-mounted solar power, 77 GW floating solar power, and 48.5 GW rooftop solar power), the entire potential of hydropower at 35.7, 55.7 GW onshore wind power, and 104 GW offshore wind power. Compared to PDP Ⅷ, solar power increases by approximately 36 GW, offshore wind power increases by about 13 GW, and onshore wind power decreases by 20 GW. To ensure the integration capability of renewable energy sources (especially solar power), the model shows the need to introduce about 85 GW of storage capacity (nearly doubling compared to PDP Ⅷ) and about 10 GW of flexible sources (reduced by about four times compared to PDP Ⅷ, as these sources are only allowed to use hydrogen).
Scenario S2 follows the same predefined co-firing pathway as Scenario S1 but assumes that the 22.7 GW of committed LNG plants cannot be constructed and operated as scheduled. To compensate for this, the model develops 5.4 GW of new co-firing LNG capacity in the North and increases the renewable energy capacity such as offshore wind power, rooftop solar power, and biomass power to nearly double the S1, corresponding to 7.5, 21.5, and 3.8 GW; onshore wind power and hydropower also increase by 40% and 5% to 18.6 GW and 5%, respectively. However, the entire capacity of flexible sources (1.6 GW) and storage sources (1.1 GW) in the Northern region from Scenario S1 will not develop in Scenario S2, as new 5.4 GW LNG power in the North could already provide peak and backup capacity.
In the period up to 2050, the model does not develop any additional new thermal power sources with fuel-switching constraints or CCS installation beyond the 5.4 GW already developed in the Northern region by 2030. In Scenario S2, with the ground-mounted solar power limit extended to 200 GW, an additional 62.5 GW is developed compared to Scenario S1, reaching a capacity of 239.5 GW. Consequently, storage sources also increase to 115.8 GW (an increase of 30.7 GW compared to Scenario S1), while other renewable energy sources develop similarly to Scenario S1. This shows that in the long term, the combination of solar and storage is more competitive than the thermal plants with co-firing or CCS.
Scenario S3 follows the most general approach by constraining the CO2 emissions pathway to reach the Net Zero target (retrieved from the CO2 emissions trajectory of Scenario S2).
In 2030, with the same level of emissions as Scenario S2, Scenario S3 develops 7.9 GW of pure LNG sources without fuel conversion in the Northern region, replacing the 5.4 GW of fuel-converted LNG in Scenario S2. Renewable energy sources in 2030 in Scenario S3 are similar to those in Scenario S2, except for biomass power and rooftop solar power, which are slightly reduced by 0.8 and 1.2 GW, respectively, compared to Scenario S2.
Up to 2035, the model continues to develop an additional 23 GW of pure LNG sources, all located in the Northern region. In Scenario S3, the model allows for the early retirement of power plants before the end of their technical lifespan if fixed operation and maintenance costs cannot be recovered. By 2050, all thermal power sources are retired except for 4.1 GW of coal-fired power and 6.4 GW of LNG gas turbines as backup (along with 7.9 GW of domestic gas turbines that still generate power normally). The ammonia and hydrogen in 2050 are only 4.3 GW, being new flexible sources in the Northern and North Central regions (compared to 41.8 GW in Scenario S2 and 69.8 GW in Scenario S1). To compensate, the model chooses to increase 40.5 GW of solar power compared to Scenario S2 (entire potential of 325.5 GW of solar power), and increase 9.3 GW of onshore wind, 13.4 GW of offshore wind, and 45.9 GW of storage capacity compared to Scenario S2.
3.2. Electricity generation
Electricity generation results of the 3 scenarios are shown in Figure 5. A notable feature is that in Scenarios S1 and S2, the electricity production from thermal power plants still accounts for a relatively high proportion, ranging from 15% to 20% in 2050. Meanwhile, in Scenario S3, the proportion of electricity production from thermal power plants drops to only 5%. The share of renewable energy in Scenario S1 increases from 32% in 2030 to 80% in 2050; in Scenario S2, it rises from 44% in 2030 to 86% in 2050; and in Scenario S3, it grows from 43% in 2030 to 95% in 2050. The reason for this is because Scenarios S1 and S2 follow the co-firing roadmap so the thermal plants can generate high clean fuel (green hydrogen/ammonia/biomass) without CO2 emission, while Scenario S3 follows a CO2 roadmap and chooses to retire thermal plants and develop more RE combination with storage.
3.3. CO2 emissions
The CO2 emission peaks in all 3 scenarios occur in 2030 instead of 2035 as in PDP Ⅷ, as shown in Figure 6. This difference from PDP Ⅷ is likely due to the distinct co-firing pathways assumed, as PDP Ⅷ does not provide specific details on co-firing requirements between 20% and 100% (refer to Section 1), while Scenario S1 requires at least 60% of co-firing with biomass/ammonia in coal fired plants after 25 years and 60% co-firing of hydrogen in LNG plants after 15 years (refer to Section 2.3). As a result, during the period of 2031–2035, some thermal power plants in Scenario S1 are refurbished to co-fire with 20% hydrogen (e.g., Hiep Phuoc, Nhon Trach Ⅲ, Ⅳ) and 20%–60% ammonia (29 units that began operation before 2015), which contributes to a reduction in CO2 emissions after 2030. In Scenario S1, emissions peak at 249 million tons in 2030 and then decrease to 15 million tons by 2050. Scenario S2 shows similar emissions from coal-fired power plants compared to Scenario S1, but emissions from LNG sources decrease significantly due to the reduced capacity of LNG in this scenario, resulting in a lower peak of 226 million tons in 2030. Scenario S3 follows the same emission pathway as Scenario S2, but emissions from coal decrease and from LNG increase due to the trend of expanding LNG capacity and decommissioning aging coal plants.
3.4. Capacity by regions
The detailed results of Vietnam's power capacity structure by region for 2030 and 2050 are presented in Figure 7. The North Central, Center Central, Highlands, and South-Central regions have low demands and thus tend to have surplus capacity. Specifically, the North Central and Center Central regions develop large thermal power plants in addition to some wind and solar power, while the Central Highlands and South-Central regions strongly develop renewable energy sources, with the South-Central region having the best offshore wind potential in Vietnam.
The remaining two regions, North and South, are two major load centers with different directions. The South, with its excellent wind and solar potential, will strongly develop these renewable energy sources (in 2050) with 158 GW of wind and solar power combined with 45.4 GW of storage in Scenario S1,176.3 GW of wind and solar power combined with 60.5 GW of storage in Scenario S2, and 214.6 GW of wind and solar power combined with 95 GW of storage in Scenario S3. The South is also supplied by strong interconnections with the Central Highlands and South-Central regions where there is excess capacity of hydro, wind, and solar power.
In the reverse direction, the North, with lower wind speed and solar radiation potential, will only develop in the best potential areas (in 2050, wind and solar capacities in Scenarios S1, S2, and S3 are 43.8, 49.9, and 53.3 GW respectively) and will need to build a high-voltage direct current (HVDC) transmission system from the South Central to the North regions to transmit renewable power combined with storage (in 2050, the capacities of wind, solar, and storage in the South Central region in Scenarios S1, S2, and S3 are 116.3 and 23.8 GW, 132.4 and 27.5 GW, and 171.9 and 33.7 GW, respectively).
3.5. Inter-regional transmission requirements
Figure 8 shows the volume of transmission grids in 3 scenarios, where in 2030, the volume of inter-regional transmission grid construction in Scenario S1 is higher than in Scenarios S2 and S3, with the North Central/North interface increased by 5.8 GW to a total of 11.8 GW in 2030 (equivalent to the PDP Ⅷ). This is due to the higher LNG thermal power capacity in Scenario S1 (five times greater than in Scenario S2), with these sources mainly concentrated in the South and North Central regions, leading to a greater need for transmission to the North's load center.
In 2050, the volume of transmission grid construction is similar in Scenarios S1 and S2, while Scenario S3 has a larger transmission volume, primarily due to the HVDC transmission system. The calculations indicate that the HVDC transmission system from the Central South to the North will play a crucial role in supplying electricity to the North's load center, with capacities in the three scenarios being 34.3, 34.5, and 45 GW, respectively. In contrast, the role of the HVDC system from Central Vietnam to the North is less clear, with capacities reaching only 3.6 to 4 GW in Scenarios S1 and S2 and just 0.1 GW in Scenario S3. The detailed results of the optimal transmission capacity required to be developed by 2050 for Scenarios S1 and S3 are presented in Figure 9.
3.6. Power system cost
Figure 10 presents the detailed results of the total costs by year for each scenario. As constraints are gradually relaxed from Scenario S1 to Scenarios S2 and S3, the total costs tend to decrease. While Scenario S1 involves commitments to many thermal power sources with high fuel costs (especially when switching to hydrogen and ammonia fuels), Scenario S3 involves the development of many renewable energy sources with high initial investment costs (per unit of electricity) but lower fuel costs. According to the calculations, Scenario S2 has construction costs similar to Scenario S1 but with reduced fuel costs, resulting in a total cost reduction of approximately $7.8 billion by 2050 compared to Scenario S1. Scenario S3 has the highest investment costs (for both power sources and transmission lines) but reduces fuel costs, leading to a total cost reduction of about $4.2 billion compared to Scenario S2.
4.
Discussion
This section provides an analysis of the results and, based on that analysis, offers several recommendations regarding Vietnam's pathway toward achieving its Net Zero target.
Scenario S1 re-simulates the policy direction outlined in PDP Ⅷ. In the period up to 2030, the capacity of flexible thermal power sources and storage in the North increases by 3 to 5 times compared to the original PDP Ⅷ Scenario. This indicates a potential shortage in peak and backup capacity in the Northern region, which is forecasted to become Vietnam's largest load center by 2030. However, the strengths of this region, namely hydropower in the Northwest and coal-fired power in the Northeast (close to coal mines), have largely been exploited to their full potential. Meanwhile, the solar and wind power potential in the North is considered lower than that in the Central and Southern regions. From 2019 to 2022, most coal-fired and solar power plants were operating predominantly in the Central and Southern areas. The PDP Ⅷ operating scenario includes a reserve margin of about 15%, suggesting a risk of oversupply. If LNG power plants operate at full capacity, the demand for new wind power installations may decrease. Toward 2050, installed capacities in Scenario S1 are relatively similar to those in PDP Ⅷ, with hydropower and solar power reaching their full potential at approximately 36 and 220 GW, respectively, and wind power reaching about 160 GW, two-thirds of which is offshore. However, the computational model projects nearly double the storage capacity and about 10 GW less flexible thermal capacity compared to PDP Ⅷ, indicating that increased investment in storage may offer a more cost-effective solution.
In Scenario S2, when reducing 22.7 GW of committed LNG thermal power sources, the model only develops 5.4 LNG sources for fuel conversion in the North. This result is in line with Scenario S1 in which the North needs to supplement thermal power to supplement mid-load and peak-load capacity. Some LNG thermal power sources in the Central and Southern regions could be replaced by renewable energy sources with storage. These committed LNG thermal sources in the Central and Southern regions were mainly approved in the period before the establishment of PDP Ⅷ when the signal was given that the South lacked electricity; however, the review in the Ⅷ Plan showed that the load in the South did not increase as forecasted and in the period of 2019–2021, this area added about 20 GW of wind and geothermal power sources. This suggests that updating the load forecast and grid development should be done more frequently (annually or every two years) in order to promptly adjust the power source development plan. In the period up to 2050, when it is assumed that the potential of ground-based solar power will be doubled compared to PDP Ⅷ (on the basis of increasing the efficiency of the panels and increasing the ability to allocate land funds), the model of choosing to develop more solar power without developing more fuel conversion thermal power sources, this suggests that it is possible that the fuel conversion option is not as cost-competitive as the development of renewable energy with storage.
Scenario S3, with the most general approach of binding CO2 emissions, has reaffirmed the findings in Scenario S2. In this scenario, the model chooses to develop 7.9 GW of pure LNG (non-converted fuel) thermal power sources by 2030 and increase this source by 23 GW by 2035 entirely in the North, which confirms that the development of thermal plants in the North is crucial, and Vietnam should implement measures to ensure these plants are constructed and operated as planned. In addition, the retirement of some coal-fired power plants and the development of LNG thermal power sources with halved CO2 emissions can be an effective intermediate step to switch to renewable energy sources in the period up to 2050 to achieve the Net Zero goal. In the period up to 2050, the model chooses to develop the full potential of 325 GW of solar power (Scenario S3 also assumes double the potential of terrestrial solar power compared to Plan Ⅷ) and 150 GW of storage (double that of Scenario S1 and 4 times that of PDP Ⅷ), and retire thermal power plants without implementing fuel conversion; the penetration rate (proportion of electricity produced) of renewable energy including hydropower increases to 95% while thermal power output decreases to 5%. The total system cost in the S3 scenario is the lowest, which shows that with the current assumptions, the fuel conversion plan for thermal power plants will be less economically efficient than the plan for retiring thermal power plants and replacing them with renewable energy with storage. This result is similar to the Vietnam Energy Outlook Report 2023; however, this result may change if the social costs associated with the closure of thermal power plants are fully considered when the input data is ready.
In all three scenarios, nuclear power technology and CCUS installation do not appear in the results, implying that these are expensive options and cannot compete with the option of increasing the proportion of renewable energy combined with storage. Currently, the computational model does not take into account SMR small-scale modular nuclear power technology due to data limitations, which is a promising technology with a smaller capacity that can fit the needs of the system and can become a competitive solution when widely commercialized.
In the period up to 2050, the output from thermal power sources will only contribute from 15% to 20% in the S1 and S2 scenarios and will decrease to only 5% in the S3 scenario; as such, thermal power sources will tend to switch from running in the background, running backwards to running over the top. Therefore, considering an improvement on the flexible operation of thermal power sources, especially coal-fired power, will become an important factor to ensure the ability to integrate a high proportion of renewable energy sources.
For solar power sources, the fact that the entire potential is selected by the model to be developed even if it is assumed that the potential of ground-based solar power is doubled compared to PDP Ⅷ in Scenario S3 shows that the orientation of allocating more land for solar power development (if possible) can become cost-effective in power development.
In addition to the development of renewable energy sources combined with storage, the results of all 3 scenarios show that the HVDC ultra-high voltage transmission system will also play an important role in ensuring power supply to the Northern load center. In Vietnam's power system, with a terrain spanning over 2000 km, the load is concentrated at 2 ends of the North and South, while the potential for wind (onshore wind and offshore wind) and good solar radiation are concentrated in the Central and Southern regions. Therefore, considering the development of the transmission power system will be an important point for planning Vietnam's electricity development. The South, with its excellent wind and solar potential, will strongly develop these renewable energy sources in combination with strong interconnections with the Central Highlands and South Central regions where there is excess capacity of hydro, wind, and solar power. In the reverse direction, the North, with lower wind speed and solar radiation potential, will only develop in the best potential areas and will need to rely on HVDC transmission system from the South Central to transmit renewable power combined.
The peak CO2 emissions in 2030 in the three scenarios range from 226 to 249 million tons. Therefore, to achieve a lower peak emission level, e.g., to reach Just Energy Transition Partnerships (JETP)'s target at 170 million tons by 2030 [13], it is necessary to reduce emissions from coal-fired power plants. The following measures can be considered: increase flexibility, convert old coal-fired plants to flexible sources that can survive with lower output or combination of RE and storage, small partly co-firing with clean fuel (with low retrofit cost), or decommission of plants.
5.
Conclusions
A long-term generation expansion plan for Vietnam power system using both Approach 1 (CO2 emission pathway) and Approach 2 (co-firing pathway) was discussed, utilizing the same data input and considering all options for the thermal power plants (early decommissioning/co-firing with green fuel/installing CCUS with existing plants, developing new thermal candidates with co-firing green fuel/installing CCUS, or no new thermal candidate). Three scenarios were analyzed: (1) Scenario S1, a co-firing pathway with no new thermal power plants; (2) Scenario S2, a co-firing pathway allowing thermal candidate with co-firing/CCUS; and (3) Scenario S3, setting CO2 emissions pathway.
A few noteworthy recommendations for Vietnam are drawn based on the calculation results with current assumptions. In the period up to 2030, the Northern load center may need to add peak and backup sources such as flexible thermal power plants, storage, or LNG thermal power sources. By 2050, the fuel conversion plan for thermal power plants will be less economically efficient than the plan for retiring thermal power plants and replacing them with renewable energy with storage to pursue the NetZero target. Developing more renewable energy combined with energy storage and HVDC should be the focus, while co-firing green fuel, nuclear power, and CCUS installation are not included in the optimal pathway. Allocating more land for solar power development (if possible) can become cost-effective in power development.
While the study provides meaningful insights, it still has certain limitations due to data availability. In particular, the analysis does not account for social costs associated with the closure of thermal power plants, these plants are assumed to retire once their revenue no longer covers fixed costs, and does not include small modular reactor (SMR) nuclear power. Future research will aim to incorporate these two elements, along with additional emerging factors such as demand response (DR), electric vehicles (EVs), and endogenous power-to-X (PtX) optimization, to further enhance the model's comprehensiveness and applicability.
Use of AI tools declaration
The authors declare they have not used Artificial Intelligence (AI) tools in the creation of this article.
Conflict of interest
The authors declare no conflicts of interest.
Author contributions
V.D.N., D.D.H., T.H.T.N.: Conceptualization, methodology, formal analysis, writing—original draft, T.H.T.N., D.H.N.: supervision, resources, project administration, V.D.N., T.H.T.N.: writing—review and editing, validation. All authors have read and agreed to the published version of the manuscript.
Supplementary