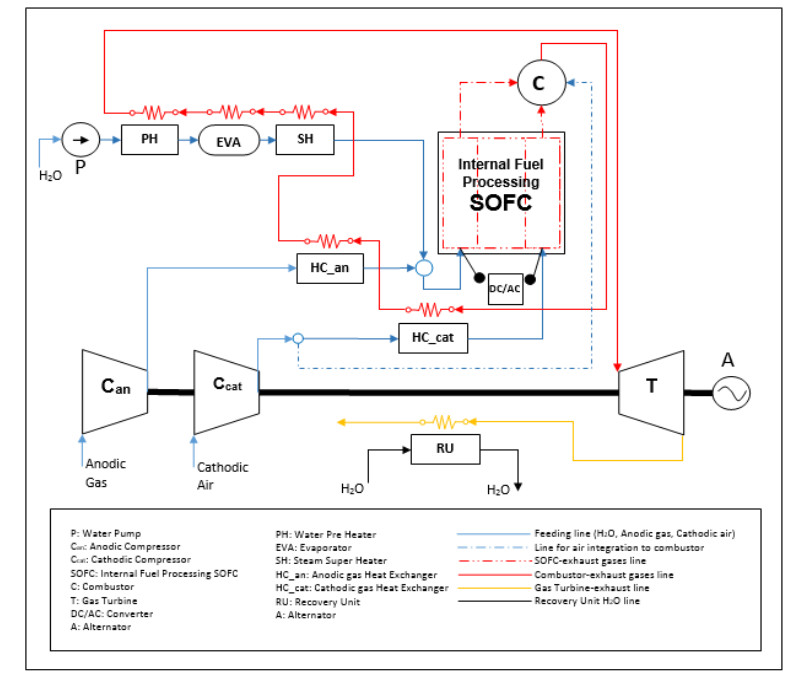
The paper presents a wide and deep analysis of the techno-energy and economic performance of a Solid Oxide Fuel Cell/Gas Turbine hybrid system fed by gas at different compositions of H2, CO, H2O, CO2, CH4, and N2. The layout of the system accounts for pressurizing of entering fluids, heat up to the set Solid Oxide Fuel Cell inlet conditions, Solid Oxide Fuel Cell thermo-electrochemical processing, Solid Oxide Fuel Cell—exhaust fluids combustion, turbo-expansion after heat up, and final recovery unit for cogeneration purposes.
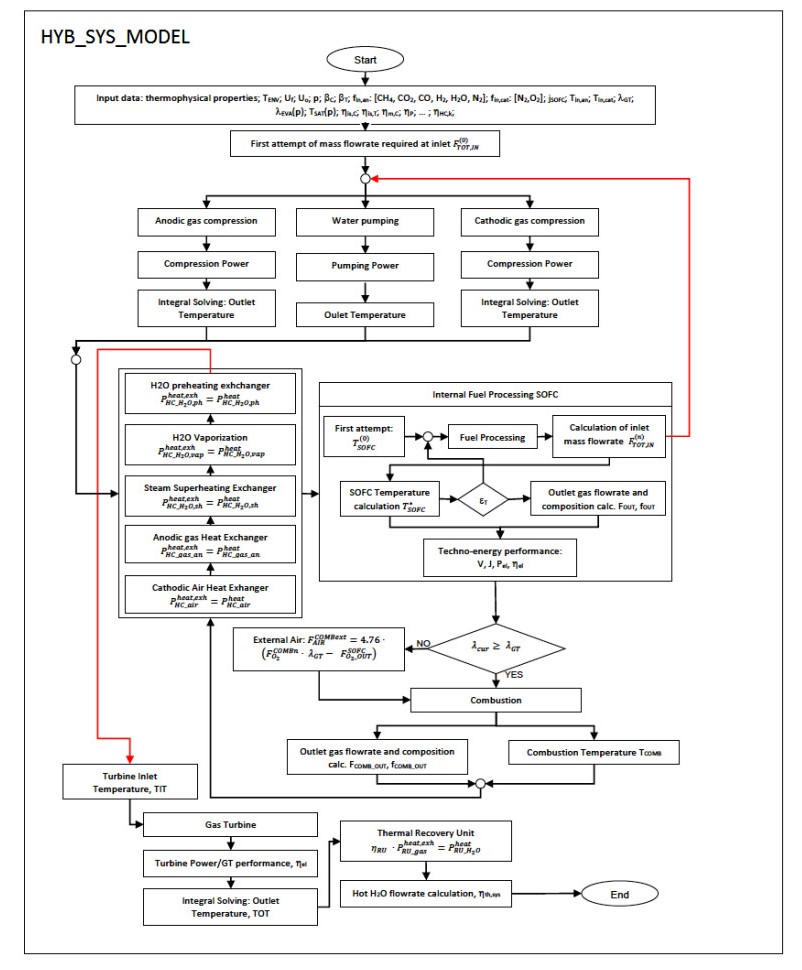
An ad hoc numerical modeling is developed and then run in a Matlab calculation environment. The influence on the system is evaluated by investigating the change of the fuel composition, and by managing the main operating parameters such as pressure and the fuel utilization factor. The analysis reports on the specific mass flowrates necessary to the purpose required, by assessing the SOFC outlet molar compositions, specific energies (work) at main system elements, specific thermal energies at main system elements, energy and technical performance for Solid Oxide Fuel Cell energy unit; the performance such as electric and thermal efficiency, temperatures at main system elements. A final sensitivity analysis on the performance, Levelized Cost of Energy and Primary Energy Saving, is made for completion. The first simulation campaign is carried out on a variable anodic mixture composed of H2, CO, H2O, considering the H2/CO ratio variable within the range 0.5-14, and H2O molar fraction variable in the range 0.1-0.4; used to approach a possible syngas in which they are significantly high compared to other possible compounds. While other simulation campaigns are conducted on real syngases, produced by biomass gasification. The overall Solid Oxide Fuel Cell/Gas Turbine system showed a very promising electric efficiency, ranging from 53 to 63%, a thermal efficiency of about 37%, an LCOE ranging from 0.09 to 0.14 $·kWh-1, and a Primary Energy Saving in the range of 33-52%, which resulted to be highly affected by the H2/CO ratio.
Also, real syngases at high H2/CO ratio are noticed as the highest quality, revealing electric efficiency higher than 60%. Syngases with methane presence also revealed good performance, according to the fuel processing of methane itself to hydrogen. Low-quality syngases revealed electric efficiencies of about 51%. Levelized Cost of Energy varied from 0.09 (for high-quality gas) to 0.19 (for low-quality gas) $·kWh-1, while Primary Energy Saving ranged from 44 to 52%.
Citation: O. Corigliano, G. De Lorenzo, P. Fragiacomo. Techno-energy-economic sensitivity analysis of hybrid system Solid Oxide Fuel Cell/Gas Turbine[J]. AIMS Energy, 2021, 9(5): 934-990. doi: 10.3934/energy.2021044
The paper presents a wide and deep analysis of the techno-energy and economic performance of a Solid Oxide Fuel Cell/Gas Turbine hybrid system fed by gas at different compositions of H2, CO, H2O, CO2, CH4, and N2. The layout of the system accounts for pressurizing of entering fluids, heat up to the set Solid Oxide Fuel Cell inlet conditions, Solid Oxide Fuel Cell thermo-electrochemical processing, Solid Oxide Fuel Cell—exhaust fluids combustion, turbo-expansion after heat up, and final recovery unit for cogeneration purposes.
An ad hoc numerical modeling is developed and then run in a Matlab calculation environment. The influence on the system is evaluated by investigating the change of the fuel composition, and by managing the main operating parameters such as pressure and the fuel utilization factor. The analysis reports on the specific mass flowrates necessary to the purpose required, by assessing the SOFC outlet molar compositions, specific energies (work) at main system elements, specific thermal energies at main system elements, energy and technical performance for Solid Oxide Fuel Cell energy unit; the performance such as electric and thermal efficiency, temperatures at main system elements. A final sensitivity analysis on the performance, Levelized Cost of Energy and Primary Energy Saving, is made for completion. The first simulation campaign is carried out on a variable anodic mixture composed of H2, CO, H2O, considering the H2/CO ratio variable within the range 0.5-14, and H2O molar fraction variable in the range 0.1-0.4; used to approach a possible syngas in which they are significantly high compared to other possible compounds. While other simulation campaigns are conducted on real syngases, produced by biomass gasification. The overall Solid Oxide Fuel Cell/Gas Turbine system showed a very promising electric efficiency, ranging from 53 to 63%, a thermal efficiency of about 37%, an LCOE ranging from 0.09 to 0.14 $·kWh-1, and a Primary Energy Saving in the range of 33-52%, which resulted to be highly affected by the H2/CO ratio.
Also, real syngases at high H2/CO ratio are noticed as the highest quality, revealing electric efficiency higher than 60%. Syngases with methane presence also revealed good performance, according to the fuel processing of methane itself to hydrogen. Low-quality syngases revealed electric efficiencies of about 51%. Levelized Cost of Energy varied from 0.09 (for high-quality gas) to 0.19 (for low-quality gas) $·kWh-1, while Primary Energy Saving ranged from 44 to 52%.

| [1] | BP Statistical Review of World Energy, 2019, 68th edition. |
| [2] | Perera F (2018) Pollution from fossil-fuel combustion is the leading environmental threat to global pediatric health and equity: Solutions exist. Int J Environ Res Public Health 15: 16. |
| [3] |
Petrov O, Bi X, Lau A (2017) Impact assessment of biomass-based district heating systems in densely populated communities. Part Ⅱ: Would the replacement of fossil fuels improve ambient air quality and human health? Atmos Environ 161: 191-199. doi: 10.1016/j.atmosenv.2017.05.001

|
| [4] |
Corigliano O, Fragiacomo P (2015) Technical analysis of hydrogen-rich stream generation through CO2 reforming of biogas by using numerical modeling. Fuel 158: 538-548. doi: 10.1016/j.fuel.2015.05.063
|
| [5] |
Corigliano O, Fragiacomo P (2017) Numerical modeling of an indirect internal CO2 reforming solid oxide fuel cell energy system fed by biogas. Fuel 196: 352-361. doi: 10.1016/j.fuel.2017.01.123
|
| [6] |
Corigliano O, Fragiacomo P (2017) Numerical simulations for testing performances of an Indirect Internal CO2 Reforming Solid Oxide Fuel Cell System fed by biogas. Fuel 196: 378-390. doi: 10.1016/j.fuel.2017.01.106
|
| [7] |
De Lorenzo G, Corigliano O, Lo Faro M, et al. (2016) Thermoelectric characterization of an intermediate temperature solid oxide fuel cell system directly fed by dry biogas. Energy Convers Manage 127: 90-102. doi: 10.1016/j.enconman.2016.08.079
|
| [8] |
Perna A, Minutillo M, Jannelli E, et al. (2018) Performance assessment of a hybrid SOFC/MGT cogeneration power plant fed by syngas from a biomass down-draft gasifier. Appl Energy 227: 80-91. doi: 10.1016/j.apenergy.2017.08.077
|
| [9] |
Toonssen R, Sollai S, Aravind PV, et al. (2011) Alternative system designs of biomass gasification SOFC/GT hybrid systems. Int J Hydrogen Energy 36: 10414-10425. doi: 10.1016/j.ijhydene.2010.06.069
|
| [10] |
Reyhani HA, Meratizaman M, Ebrahimi A, et al. (2016) Thermodynamic and economic optimization of SOFC-GT and its cogeneration opportunities using generated syngas from heavy fuel oil gasification. Energy 107: 141-164. doi: 10.1016/j.energy.2016.04.010
|
| [11] |
Bellomare F, Rokni M (2013) Integration of a municipal solid waste gasification plant with solid oxide fuel cell and gas turbine. Renewable Energy 55: 490-500. doi: 10.1016/j.renene.2013.01.016
|
| [12] |
Tse LKC, Wilkins S, McGlashan N, et al. (2011) Solid oxide fuel cell/gas turbine trigeneration system for marine applications. J Power Sources 196: 3149-3162. doi: 10.1016/j.jpowsour.2010.11.099
|
| [13] |
Chan SH, Ho K, Tian Y (2003) Multi-level modeling of SOFC-gas turbine hybrid system. Int J Hydrogen Energy 28: 889-900. doi: 10.1016/S0360-3199(02)00160-X
|
| [14] |
McPhail SJ, Aarva A, Devianto H, et al. (2011) SOFC and MCFC: commonalities and opportunities for integrated research. Int J Hydrogen Energy 36: 10337-10345. doi: 10.1016/j.ijhydene.2010.09.071
|
| [15] |
Bakalis DP, Stamatis AG (2014) Optimization methodology of turbomachines for hybrid SOFC—GT applications. Energy 70: 86-94. doi: 10.1016/j.energy.2014.03.093
|
| [16] |
Chen J, Li j, Zhou D, et al. (2018) Control strategy design for a SOFC-GT hybrid system equipped with anode and cathode recirculation ejectors; Appl Therm Eng 132: 67-79. doi: 10.1016/j.applthermaleng.2017.12.079
|
| [17] |
Ali Azizi M, Brouwer J (2018) Progress in solid oxide fuel cell-gas turbine hybrid power systems: System design and analysis, transient operation, controls and optimization. Appl Energy 215: 237-289. doi: 10.1016/j.apenergy.2018.01.098
|
| [18] | Veyo SE, Lundberg WL, Vora SD, et al. (2003) Tubular SOFC Hybrid Power System Status. ASME. Turbo Expo: Power for Land, Sea, and Air, Volume 2: Turbo Expo: 649-655. |
| [19] | Brouwer J (2006) Hybrid gas turbine fuel cell systems, Chapter 4. In: Dennis Richard A, editors, The Gas Turbine Handbook, U.S. Department of Energy, DOE/NETL-2006/1230. |
| [20] |
Yan Z, Zhao P, Wang J, et al. (2013) Thermodynamic analysis of an SOFC-GT-ORC integrated power system with liquefied natural gas as heat sink. Int J Hydrogen Energy 38: 3352-3363. doi: 10.1016/j.ijhydene.2012.12.101
|
| [21] |
Ebrahimi M, Moradpoor I (2016) Combined solid oxide fuel cell, micro-gas turbine and organic Rankine cycle for power generation (SOFC-MGT-ORC). Energy Convers Manage 116: 120-133. doi: 10.1016/j.enconman.2016.02.080
|
| [22] |
Choi JH, Ahn JH, Kim TS (2014) Performance of a triple power generation cycle combining gas/steam turbine combined cycle and solid oxide fuel cell and the influence of carbon capture. Appl Therm Eng 71: 301-309. doi: 10.1016/j.applthermaleng.2014.07.001
|
| [23] |
Eveloy V, Karunkeyoon W, Rodgers P, et al. (2016) Energy, exergy and economic analysis of an integrated solid oxide fuel cell e gas turbine e organic Rankine power generation system. Int J Hydrogen Energy 41: 13843-13858. doi: 10.1016/j.ijhydene.2016.01.146
|
| [24] |
Sarmah P, Gogoi TK (2017) Performance comparison of SOFC integrated combined power systems with three different bottoming steam turbine cycles. Energy Convers Manage 132: 91-101. doi: 10.1016/j.enconman.2016.11.009
|
| [25] |
Roberts RA, Brouwer J (2005) Dynamic simulation of a pressurized 220 kW Solid Oxide Fuel-Cell-Gas-Turbine Hybrid System: Modeled performance compared to measured results. ASME J Fuel Cell Sci Technol 3: 18-25. doi: 10.1115/1.2133802
|
| [26] | Veyo SE, Vora SD, Litzinger KP et al. (2002) Status of pressurized SOFC/gas turbine power system development at siemens Westinghouse. ASME Turbo Expo 2002: power for land, sea, and air. American Society of Mechanical Engineers: 823-829. |
| [27] | Gengo T, Kobayashi Y, Ando Y, et al. (2008) Development of 200 kW class SOFC combined cycle system and future view. Technical review. Mitsubishi Heavy Industries, Ltd.; 2008. p. 45. |
| [28] |
Zhang X, Chan SH, Li G, et al. (2010) A review of integration strategies for solid oxide fuel cells. J Power Sources 195: 685-702. doi: 10.1016/j.jpowsour.2009.07.045
|
| [29] |
Seidler S, Henke M, Kallo J, et al. (2011) Pressurized solid oxide fuel cells: experimental studies and modeling. J Power Sources 196: 7195-7202. doi: 10.1016/j.jpowsour.2010.09.100
|
| [30] | Available from: https://arpa-e.energy.gov/sites/default/files/2020-11/05_Tucker_2020_INTEGRATE_Annual%20meeting_NETL_20201027%20V1.pdfhttp://www.nfcrc.uci.edu/3/research/researchsummaries/Hybrid_FC-GT_Systems/HYBRIDfuelCELL_Hybrid_220kwSOFC.pdf. |
| [31] | Available from: http://www.nfcrc.uci.edu/3/research/researchsummaries/Hybrid_FC-GT_Systems/HYBRIDfuelCELL_GASturbineSystems AnalysesHybridFuelCellGasTurbineSystems.pdf. |
| [32] |
Buonomano A, Calise F, Dentice d'Accadia M, et al. (2015) Hybrid solid oxide fuel cells-gas turbine systems for combined heat and power: A review. Appl Energy 156: 32-85. doi: 10.1016/j.apenergy.2015.06.027
|
| [33] |
Ozcan H, Dincer I (2015) Performance evaluation of an SOFC based trigeneration system using various gaseous fuels from biomass gasification. Int J Hydrogen Energy 40: 7798-7807. doi: 10.1016/j.ijhydene.2014.11.109
|
| [34] |
Hajabdollahi Z, Fu PF (2017) Multi-objective based configuration optimization of SOFC-GT cogeneration plant. Appl Therm Eng 1125: 549-559. doi: 10.1016/j.applthermaleng.2016.10.103
|
| [35] |
Granovskii M, Dincer I, Rosen MA (2007) Performance comparison of two combined SOFC gas turbine systems. J Power Sources 165: 307-314. doi: 10.1016/j.jpowsour.2006.11.069
|
| [36] |
Chinda P, Brault P (2012) The hybrid solid oxide fuel cell (SOFC) and gas turbine (GT) systems steady state modeling. Int J Hydrogen Energy 37: 9237-9248. doi: 10.1016/j.ijhydene.2012.03.005
|
| [37] |
Zabihian F, Fung AS (2013) Performance analysis of hybrid solid oxide fuel cell and gas turbine cycle: Application of alternative fuels. Energy Convers Manage 76: 571-580. doi: 10.1016/j.enconman.2013.08.005
|
| [38] |
Santin M, Traverso A, Magistri L, et al. (2010) Thermoeconomic analysis of SOFC-GT hybrid systems fed by liquid fuels. Energy 35: 1077-1083. doi: 10.1016/j.energy.2009.06.012
|
| [39] |
Al-Khori K, Bicer Y, Koç M (2020) Integration of Solid Oxide Fuel Cells into oil and gas operations: needs, opportunities, and challenges. J Clean Prod 245: 118924. doi: 10.1016/j.jclepro.2019.118924
|
| [40] |
Zhang X, Chan SH, Li G, et al. (2010) A review of integration strategies for solid oxide fuel cells. J Power Sources 195: 685-702. doi: 10.1016/j.jpowsour.2009.07.045
|
| [41] |
Soottitantawat A, Arpornwichanop A, Kiatkittipong W, et al. (2009) Reviews on Solid Oxide Fuel Cells technology. Eng J 13: 65-83. doi: 10.4186/ej.2009.13.1.65
|
| [42] |
Milewski J, Miller A, Sałacinski J (2007) Off-design analysis of SOFC hybrid system. Int J Hydrogen Energy 32: 687-698. doi: 10.1016/j.ijhydene.2006.08.007
|
| [43] | Chen H, Yang C, Zhou N, et al. (2019) Performance Comparison of Internal and External Reforming for Hybrid SOFC-GT Applications by Using 1D Real-Time Fuel Cell Mode. Proceedings of the ASME Turbo Expo 2019: Turbomachinery Technical Conference and Exposition. Volume 3: Coal, Biomass, Hydrogen, and Alternative Fuels; Cycle Innovations; Electric Power; Industrial and Cogeneration; Organic Rankine Cycle Power Systems. Phoenix, Arizona, USA. June 17-21, 2019. V003T06A028. ASME. |
| [44] | Harun F, Shadle L, Oryshchyn D, et al. (2017) Fuel Utilization Effects on System Efficiency and Solid Oxide Fuel Cell Performance in Gas Turbine Hybrid Systems. Proceedings of ASME Turbo Expo 2017: Power for Land, Sea and Air GT2017-64055, Charlotte, NC., 2017. |
| [45] | Gandiglio M, Lanzini A, Leone P, et al. (2013) Thermoeconomic analysis of large solid oxide fuel cell plants: Atmospheric vs. pressurized performance. Energy 55: 142-155. |
| [46] |
Park SK, Kim TS (2006) Comparison between pressurized design and ambient pressure design of hybrid solid oxide fuel cell gas turbine systems. J Power Sources 163: 490-499. doi: 10.1016/j.jpowsour.2006.09.036
|
| [47] |
Zhao Y, Shah N, Brandon N (2011) Comparison between two optimization strategies for solid oxide fuel cell-gas turbine hybrid cycles. Int J Hydrogen Energy 36: 10235-10246. doi: 10.1016/j.ijhydene.2010.11.015
|
| [48] |
Calise F, Dentice d'Accadia M, Vanoli L, et al. (2007) Full load synthesis/design optimization of a hybrid SOFC GT power plant. Energy 32: 446-458. doi: 10.1016/j.energy.2006.06.016
|
| [49] |
Calise F, Dentice d'Accadia M, Vanoli L, et al. (2006) Single-level optimization of a hybrid SOFC GT power plant. J Power Sources 159: 1169-1185. doi: 10.1016/j.jpowsour.2005.11.108
|
| [50] |
Song TW, Sohn JL, Kim JH, et al. (2005) Performance analysis of a tubular solid oxide fuel cell/micro gas turbine hybrid power system based on a quasi-two dimensional model. J Power Sources 142: 30-42. doi: 10.1016/j.jpowsour.2004.10.011
|
| [51] |
Yang WJ, Park SK, Kim TS, et al. (2006) Design performance analysis of pressurized solid oxide fuel cell/gas turbine hybrid systems considering temperature constraints. J Power Sources 160: 462-473. doi: 10.1016/j.jpowsour.2006.01.018
|
| [52] |
Huang Y, Turan A (2019) Fuel sensitivity and parametric optimization of SOFC-GT hybrid system operational characteristics. Therm Sci Eng Prog 14: 100407. doi: 10.1016/j.tsep.2019.100407
|
| [53] |
Wang X, Lv X, Weng Y (2020) Performance analysis of a biogas-fueled SOFC/GT hybrid system integrated with anode-combustor exhaust gas recirculation loops. Energy 197: 117213. doi: 10.1016/j.energy.2020.117213
|
| [54] |
Chitgar N, Moghimi M (2020) Design and evaluation of a novel multi-generation system based on SOFC-GT for electricity, fresh water and hydrogen production. Energy 19715: 117162. doi: 10.1016/j.energy.2020.117162
|
| [55] |
Rayner AJ, Briggs J, Tremback R, et al. (2017) Design of an organic waste power plant coupling anaerobic digestion and solid oxide fuel cell technologies. Renewable Sustainable Energy Rev 71: 563-571. doi: 10.1016/j.rser.2016.12.084
|
| [56] |
Lv X, Ding X, Weng Y (2019) Performance analysis of island energy system of SOFC and GT with gasified biomass fuel. Energy Procedia 159: 406-411. doi: 10.1016/j.egypro.2018.12.068
|
| [57] |
Jia J, Shu L, Zang G, et al. (2018) Energy analysis and techno-economic assessment of a co-gasification of woody biomass and animal manure, solid oxide fuel cells and micro gas turbine hybrid system. Energy 149: 750-761. doi: 10.1016/j.energy.2018.02.057
|
| [58] |
Wongchanapai S, Iwai H, Saito M, et al. (2013) Performance evaluation of a direct-biogas solid oxide fuel cell-micro gas turbine (SOFC-MGT) hybrid combined heat and power (CHP) system. J Power Sources 2231: 9-17. doi: 10.1016/j.jpowsour.2012.09.037
|
| [59] |
Saadabadi SA, Thattai AT, Fan L, et al. (2019) Solid Oxide Fuel Cells fuelled with biogas: Potential and constraints. Renewable Energy 134: 194-214. doi: 10.1016/j.renene.2018.11.028
|
| [60] |
Behzadi A, Habibollahzade A, Zare V, et al. (2019) Multi-objective optimization of a hybrid biomass-based SOFC/GT/double effect absorption chiller/RO desalination system with CO2 recycle. Energy Convers Manage 1811: 302-318. doi: 10.1016/j.enconman.2018.11.053
|
| [61] |
Lv X, Ding X, Weng Y (2019) Effect of fuel composition fluctuation on the safety performance of an IT-SOFC/GT hybrid system. Energy 174: 45-53. doi: 10.1016/j.energy.2019.02.083
|
| [62] |
Ding X, Lv X, Weng Y (2019) Coupling effect of operating parameters on performance of a biogas-fueled solid oxide fuel cell/gas turbine hybrid system. Appl Energy 25415: 113675. doi: 10.1016/j.apenergy.2019.113675
|
| [63] |
Meratizaman M, Monadizadeh S, Amidpour M (2014) Techno-economic assessment of high efficient energy production (SOFC-GT) for residential application from natural gas. J Nat Gas Sci Eng 21: 118-133. doi: 10.1016/j.jngse.2014.07.033
|
| [64] |
Eveloy V, Rodgers P (2017) Techno-economic-environmental optimization of a solid oxide fuel cell-gas turbine hybrid coupled with small-scale membrane desalination. Int J Hydrogen Energy 42: 15828-15850. doi: 10.1016/j.ijhydene.2017.04.235
|
| [65] |
Eisavi B, Chitsaz A, Hosseinpour J, et al. (2018) Thermo-environmental and economic comparison of three different arrangements of solid oxide fuel cell-gas turbine (SOFC-GT) hybrid systems. Energy Convers Manage 16815: 343-356. doi: 10.1016/j.enconman.2018.04.088
|
| [66] |
Rao M, Fernandes A, Pronk P, et al. (2019) Design, modelling and techno-economic analysis of a solid oxide fuel cell-gas turbine system with CO2 capture fueled by gases from steel industry. Appl Therm Eng 1485: 1258-1270. doi: 10.1016/j.applthermaleng.2018.11.108
|
| [67] |
Hou Q, Zhao H, Yang X (2019) Economic performance study of the integrated MR-SOFC-CCHP system. Energy 166: 236-245. doi: 10.1016/j.energy.2018.10.072
|
| [68] |
Roy D, Samanta S, Gosh S (2020) Techno-economic and environmental analyses of a biomass based system employing solid oxide fuel cell, externally fired gas turbine and organic rankine cycle. J Clean Prod 225: 36-57. doi: 10.1016/j.jclepro.2019.03.261
|
| [69] |
Corigliano O, Fragiacomo P (2020) Extensive analysis of SOFC fed by direct syngas at different anodic compositions by using two numerical approaches. Energy Convers Manage 2091: 112664. doi: 10.1016/j.enconman.2020.112664
|
| [70] |
Zhao Y, Sadhukhan J, Lanzini A, et al. (2011) Optimal integration strategies for a syngas fuelled SOFC and gas turbine hybrid. J Power Sources 196: 9516-9527. doi: 10.1016/j.jpowsour.2011.07.044
|
| [71] |
Wongchanapai S, Iwai H, Saito M, et al. (2013) Performance evaluation of a direct-biogas solid oxide fuel cell-micro gas turbine (SOFC-MGT) hybrid combined heat and power (CHP) system. J Power Sources 223: 9-17. doi: 10.1016/j.jpowsour.2012.09.037
|
| [72] |
Pirkandi J, Mahmoodi M, Ommian M (2017) An optimal configuration for a solid oxide fuel cell-gas turbine (SOFC-GT) hybrid system based on thermo-economic modelling. J Clean Prod 144: 375-386. doi: 10.1016/j.jclepro.2017.01.019
|
| [73] |
Ali Azizi M, Brouwer J (2018) Progress in solid oxide fuel cell-gas turbine hybrid power systems: System design and analysis, transient operation, controls and optimization. Appl Energy 215: 237-289. doi: 10.1016/j.apenergy.2018.01.098
|
| [74] |
Oryshchyn D, Farida Harun N, Tucker D, et al. (2018) Fuel utilization effects on system efficiency in solid oxide fuel cell gas turbine hybrid systems. Appl Energy 228: 1953-1965. doi: 10.1016/j.apenergy.2018.07.004
|
| [75] | Andreassi L, Toro C, Ubertini S (2007) Modeling carbon monoxide direct oxidation in solid oxide fuel cells. In proceedings ASME European Fuel Cell Technology and Application Conference 2007. |
| [76] |
Anderson M, Yuan J, Sundén B (2013) SOFC modeling considering hydrogen and carbon monoxide as electrochemical reactants. J Power Sources 232: 42-54. doi: 10.1016/j.jpowsour.2012.12.122
|
| [77] |
Cipitì F, Barbera O, Briguglio N, et al. (2016) Design of a biomass steam reforming reactor: A modeling and experimental approach. Int J Hydrogen Energy 41: 11577-11583. doi: 10.1016/j.ijhydene.2015.12.053
|
| [78] |
Xie Y, Ding H, Xue X (2013) Direct methane fueled solid oxide fuel cell model with detailed reforming reactions. Chem Eng J 228: 917-924. doi: 10.1016/j.cej.2013.05.084
|
| [79] | Sumi H, Lee YH, Muroyama H, et al. (2010) Comparison between internal steam and CO2 reforming of methane for Ni-YSZ and Ni-ScSZ SOFC anodes. J Electrochem Soc 157: B1118-B1125. |
| [80] | Wilke CR (1950) Diffusional properties of multicomponents gases. Chem Eng Prog 104: 46-95. |
| [81] | Cussler EL (1984) Diffusion—mass transfer in fluid system. New York, NY: Cambridge University Press. |
| [82] |
Foo SY, Cheng CK, Nguyen T, et al. (2012) Carbon deposition and gasification kinetics of used lanthanide-promoted Co-Ni/Al2O3 catalysts from CH4 dry reforming. Catal Commun 5: 183-188. doi: 10.1016/j.catcom.2012.06.003
|
| [83] |
Nikoo MK, Amin NAS (2011) Thermodynamic analysis of carbon dioxide reforming of methane in view of solid carbon formation. Fuel Proc Technol 92: 678-691. doi: 10.1016/j.fuproc.2010.11.027
|
| [84] | Watanabe H, Kanie M, Chanthanumataporn M, et al. (2017) Experimental and Detailed Kinetic Modeling Study of Carbon Deposition on Ni/YSZ Anode in SOFC. J Electrochem Soc 03: 248. |
| [85] |
Lanzini A, Kreutz TG, Martelli E, et al. (2014) Energy and economic performance of novel integrated gasifier fuel cell (IGFC) cycles with carbon capture. Int J Greenhouse Gas Control 26: 169-184. doi: 10.1016/j.ijggc.2014.04.028
|
| [86] |
Meratizaman M, Monadizadeh S, Pourali O, et al. (2015) High efficient-low emission power production from low BTU gas extracted from heavy fuel oil gasification, introduction on IGCC-SOFC process. J Nat Gas Sci Eng 23: 1-15. doi: 10.1016/j.jngse.2015.01.023
|
| [87] |
Nakyai T, Authayanum S, Patcharavorachot Y, et al. (2017) Exergoeconomics of hydrogen production from biomass air-steam gasification with methane co-feeding. Energy Convers Manage 140: 228-239. doi: 10.1016/j.enconman.2017.03.002
|
| [88] |
Yari M, Mehr AS, Mahmoudhi SMS, et al. (2016) A comparative study of two SOFC based cogeneration systems fed by municipal solid waste by means of either the gasifier or digester. Energy 114: 586-602. doi: 10.1016/j.energy.2016.08.035
|
| [89] |
Samanta S, Gosh S (2017) Techno-economic assessment of a repowering scheme for a coal fired power plant through upstream integration of SOFC and downstream integration of MCFC. Int J Greenhouse Gas Control 64: 234-245. doi: 10.1016/j.ijggc.2017.07.020
|
| [90] | Arsalis A (1008) Thermoeconomic modeling and parametric study of hybrid SOFC-gas turbine-steam turbine power plants ranging form 1.5 to 10 MWe. J Power Sources 181: 313-326. |
| [91] |
Reyani HA, Meratizaman M, Ebrahimi A, et al. (2016) Thermodynamic and economic optimization of SOFC-GT and its cogeneration opportunities using syngas generated from heavy oil fuel oil gasification. Energy 107: 141-164. doi: 10.1016/j.energy.2016.04.010
|
| [92] | Poling BE, Prausnitz JM, O'Connell JP (2001) The properties of gases and liquids, McGraw-HILL. |
| [93] |
Singhal SC (2000) Advances in solid oxide fuel cell technology. Solid State Ionics 135: 305-313. doi: 10.1016/S0167-2738(00)00452-5
|
| [94] |
Badur J, Lemanski M, Kowalczyk T, et al. (2018) Zero-dimensional robust model of an SOFC with internal reforming for hybrid energy cycles. Energy 158: 128-138. doi: 10.1016/j.energy.2018.05.203
|
| [95] |
Massardo A, Lubelli F (2000) Internal reforming solid oxide fuel cell-gas turbine combined cycles (irsofc-gt): Part a-cell model and cycle thermodynamic analysis. J Eng Gas Turbines Power (ASME) 122: 27-35. doi: 10.1115/1.483187
|
| [96] |
Cinti G, Desideri U (2015) SOFC fuelled with reformed urea. Appl Energy 154: 242-253. doi: 10.1016/j.apenergy.2015.04.126
|
| [97] |
Doherty W, Reynolds A, Kennedy D (2010) Computer simulation of a biomass gasification-solid oxide fuel cell power system using Aspen Plus. Energy 35: 4545-4555. doi: 10.1016/j.energy.2010.04.051
|
| [98] |
Fortunato B, Camporeale SM, Torresi M (2013) A Gas-Steam combined cycle powered by syngas derived from biomass. Procedia Comput Sci 19: 736-745. doi: 10.1016/j.procs.2013.06.097
|
| [99] |
Ditaranto M, Heggset T, Berstad D (2020) Concept of hydrogen fired gas turbine cycle with exhaust gas recirculation: Assessment of process performance. Energy 192: 116646. doi: 10.1016/j.energy.2019.116646
|
| [100] |
Kienberger T, Zuber C, Novosel K, et al. (2013) Desulfurization and in situ tar reduction within catalytic methanation of biogenous synthesis gas. Fuel 107: 102-112. doi: 10.1016/j.fuel.2013.01.061
|
| [101] |
Baldinelli A, Cinti G, Desideri U, et al. (2016) Biomass integrated gasifier-fuel cells: Experimental investigation on wood syngas tars impact on NiYSZ-anode solid oxide fuel cells. Energy Convers Manage 128: 361-370. doi: 10.1016/j.enconman.2016.09.048
|
| [102] |
Prestipino M, Chiodo V, Maisano S, et al. (2017) Hydrogen rich syngas production by air-steam gasification of citrus peel residues from citrus juice manufacturing: Experimental and simulation activities. Int J Hydrogen Energy 42: 26816-26827. doi: 10.1016/j.ijhydene.2017.05.173
|
| [103] |
Zainal ZA, Ali R, Lean CH, et al. (2001) Prediction of performance of a downgraft gasifier using equilibrium modeling for different biomass materials. Energy Convers Manage 42: 1499-1515. doi: 10.1016/S0196-8904(00)00078-9
|
| [104] |
Arteaga-Pérez LE, Casas-Ledo Y, Pérez-Bermudex R, et al. (2013) Energy and exergy analysis of a sugar cane bagasse gasifier integrated to a solid oxide fuel cell based on a quasi equilibrium approach. Chem Eng J 228: 1121-1132. doi: 10.1016/j.cej.2013.05.077
|


Figures(16) / Tables(6)

O. Corigliano, G. De Lorenzo, P. Fragiacomo. Techno-energy-economic sensitivity analysis of hybrid system Solid Oxide Fuel Cell/Gas Turbine[J]. AIMS Energy, 2021, 9(5): 934-990. doi: 10.3934/energy.2021044


 DownLoad: