Crowdfunding platforms function as virtual communities in which creators, backers, and platform signals jointly shape the project visibility, credibility, and funding outcomes. This study examines the prediction and interpretation of Kickstarter game-campaign outcomes. First, it provides descriptive context using a combined record of 10,935 Kickstarter game campaigns launched between January 1, 2018, and April 12, 2026. Comparable records for both tabletop games and video games are only available from 2022 onward. Accordingly, the primary predictive and interpretive analyses used an outcome-complete contemporary analytical sample of 9627 campaigns launched between January 1, 2022, and April 12, 2026. Using five pre-launch predictors, eight machine-learning classifiers were evaluated using nested cross-validation, and their temporal generalizability was assessed on campaigns launched in 2025. The soft-voting ensemble achieved the highest nested cross-validation receiver operating characteristic (ROC) area under the curve (AUC) (AUC = 0.896; accuracy = 90.08%), while XGBoost produced nearly identical results (AUC = 0.895; accuracy = 90.02%) and was used for model interpretation. A Shapley additive explanations (SHAP) analysis characterized the relative contributions of the funding goal, exact category, preparation time, campaign duration, and blurb length to the predicted campaign success. Within the contemporary analytical sample, the observed success rate was substantially higher for Tabletop Games than for Video Games. Overall, the findings show that a parsimonious set of pre-launch predictors retains substantial out-of-sample and out-of-time predictive discrimination for Kickstarter game-campaign outcomes while supporting a transparent interpretation of model behavior.
Citation: Han Yu, Felix Junior Appiah Kubi, Hong Huang. Crowdfunding success in game development: an explainable machine learning study of Kickstarter projects[J]. Big Data and Information Analytics, 2026, 10: 350-373. doi: 10.3934/bdia.2026018
Crowdfunding platforms function as virtual communities in which creators, backers, and platform signals jointly shape the project visibility, credibility, and funding outcomes. This study examines the prediction and interpretation of Kickstarter game-campaign outcomes. First, it provides descriptive context using a combined record of 10,935 Kickstarter game campaigns launched between January 1, 2018, and April 12, 2026. Comparable records for both tabletop games and video games are only available from 2022 onward. Accordingly, the primary predictive and interpretive analyses used an outcome-complete contemporary analytical sample of 9627 campaigns launched between January 1, 2022, and April 12, 2026. Using five pre-launch predictors, eight machine-learning classifiers were evaluated using nested cross-validation, and their temporal generalizability was assessed on campaigns launched in 2025. The soft-voting ensemble achieved the highest nested cross-validation receiver operating characteristic (ROC) area under the curve (AUC) (AUC = 0.896; accuracy = 90.08%), while XGBoost produced nearly identical results (AUC = 0.895; accuracy = 90.02%) and was used for model interpretation. A Shapley additive explanations (SHAP) analysis characterized the relative contributions of the funding goal, exact category, preparation time, campaign duration, and blurb length to the predicted campaign success. Within the contemporary analytical sample, the observed success rate was substantially higher for Tabletop Games than for Video Games. Overall, the findings show that a parsimonious set of pre-launch predictors retains substantial out-of-sample and out-of-time predictive discrimination for Kickstarter game-campaign outcomes while supporting a transparent interpretation of model behavior.

| [1] |
Spence M, (1973) Job market signaling. Q J Econ 87: 355–374. https://doi.org/10.2307/1882010 doi: 10.2307/1882010
|
| [2] |
Mollick E, (2014) The dynamics of crowdfunding: An exploratory study. J Bus Venturing 29: 1–16. https://doi.org/10.1016/j.jbusvent.2013.06.005 doi: 10.1016/j.jbusvent.2013.06.005
|
| [3] |
Zheng H, Li D, Wu J, Xu Y, (2014) The role of multidimensional social capital in crowdfunding: A comparative study in China and US. Inf Manage 51: 488–496. https://doi.org/10.1016/j.im.2014.03.003 doi: 10.1016/j.im.2014.03.003
|
| [4] |
Cha J, (2017) Crowdfunding for video games: Factors that influence the success of and capital pledged for campaigns. Int J Media Manage 19: 240–259. https://doi.org/10.1080/14241277.2017.1331236 doi: 10.1080/14241277.2017.1331236
|
| [5] |
Gunduz H, (2024) Comparative analysis of BERT and FastText representations on crowdfunding campaign success prediction. PeerJ Comput Sci 10: e2316. https://doi.org/10.7717/peerj-cs.2316 doi: 10.7717/peerj-cs.2316
|
| [6] |
Hohen S, Hüning C, Schweizer L, (2026) Reward-based crowdfunding—A systematic literature review. Manage Rev Q 76, 2997–3044. https://doi.org/10.1007/s11301-025-00544-2 doi: 10.1007/s11301-025-00544-2
|
| [7] |
Jónasdóttir H, (2019) Innovation in game development: IT enablement and affordances on Kickstarter. Comput Games J 8: 65–81. https://doi.org/10.1007/s40869-018-0075-6 doi: 10.1007/s40869-018-0075-6
|
| [8] |
Etter V, Grossglauser M, Thiran P, (2013) Launch hard or go home! Predicting the success of Kickstarter campaigns. In: Proceedings of the First ACM Conference on Online Social Networks, 177–182. https://doi.org/10.1145/2512938.2512957 |
| [9] |
Hoque MM, (2024) Crowdfunding for innovation: A comprehensive empirical review. Future Bus J 10: 102. https://doi.org/10.1186/s43093-024-00387-5 doi: 10.1186/s43093-024-00387-5
|
| [10] |
Varma S, Simon R, (2006) Bias in error estimation when using cross-validation for model selection. BMC Bioinf 7: 91. https://doi.org/10.1186/1471-2105-7-91 doi: 10.1186/1471-2105-7-91
|
| [11] |
Lundberg SM, Lee SI, (2017) A unified approach to interpreting model predictions. In: Advances in Neural Information Processing Systems 30, 4765–4774. |
| [12] |
Web Robots, (2026) Kickstarter Datasets: June 11, 2026 Snapshot and Archive Documentation, Available from: https://webrobots.io/kickstarter-datasets/. |
| [13] |
Kickstarter (n.d.), What is the Maximum Project Duration? Kickstarter Help Center, Available from: https://help.kickstarter.com/hc/en-us/articles/115005128434-What-is-the-maximum-project-duration. |
| [14] |
Hastie T, Tibshirani R, Friedman J, (2009) The Elements of Statistical Learning: Data Mining, Inference, and Prediction, New York, Springer. https://doi.org/10.1007/978-0-387-84858-7 |
| [15] |
Tibshirani R, (1996) Regression shrinkage and selection via the lasso. J R Stat Soc Series B Stat Methodol 58: 267–288. https://doi.org/10.1111/j.2517-6161.1996.tb02080.x doi: 10.1111/j.2517-6161.1996.tb02080.x
|
| [16] |
Cortes C, Vapnik V, (1995) Support-vector networks. Mach Learn 20: 273–297. https://doi.org/10.1007/BF00994018 doi: 10.1007/BF00994018
|
| [17] |
Chen T, Guestrin C, (2016) XGBoost: A scalable tree boosting system. In: Proceedings of the 22nd ACM SIGKDD International Conference on Knowledge Discovery and Data Mining, 785–794. https://doi.org/10.1145/2939672.2939785 |
| [18] |
Brier GW, (1950) Verification of forecasts expressed in terms of probability. Mon Weather Rev 78: 1–3. https://doi.org/10.1175/1520-0493(1950)078<0001:VOFEIT>2.0.CO;2 doi: 10.1175/1520-0493(1950)078<0001:VOFEIT>2.0.CO;2
|
| [19] |
Wilson EB, (1927) Probable inference, the law of succession, and statistical inference. J Am Stat Assoc 22: 209–212. https://doi.org/10.1080/01621459.1927.10502953 doi: 10.1080/01621459.1927.10502953
|
Figures(9) / Tables(12)

Han Yu, Felix Junior Appiah Kubi, Hong Huang. Crowdfunding success in game development: an explainable machine learning study of Kickstarter projects[J]. Big Data and Information Analytics, 2026, 10: 350-373. doi: 10.3934/bdia.2026018

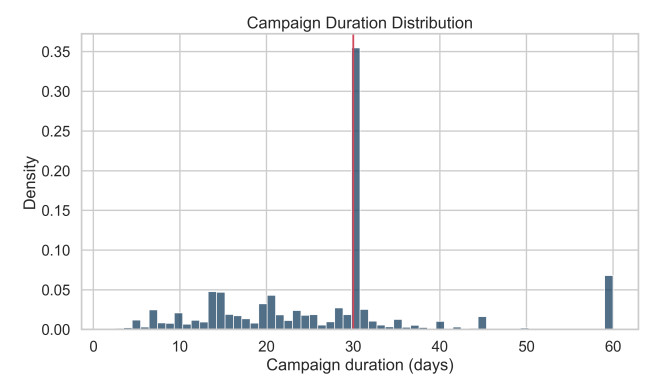
Distribution of retained campaign durations. The observed concentration near 30 days is consistent with Kickstarter's recommendation that campaigns run for 30 days or less [13]. The maximum retained duration was 60 days
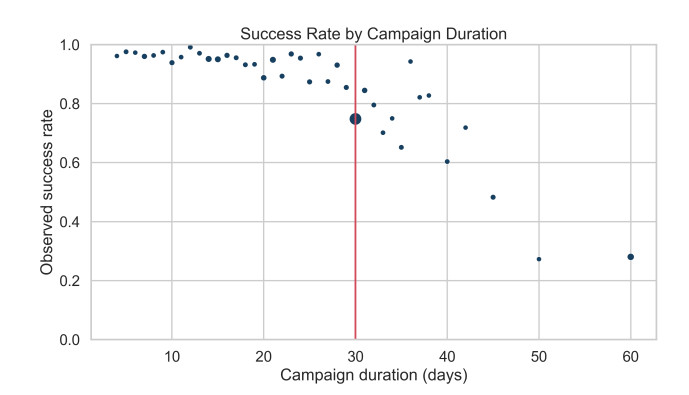
Observed success rate by campaign-duration bin. The plotted relationship is unadjusted and descriptive
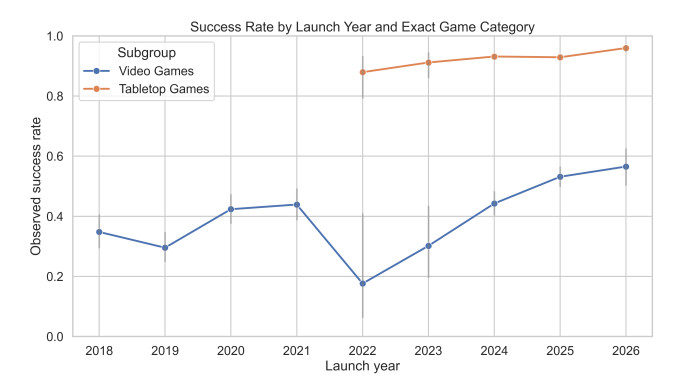
Observed success rates by launch year and exact game category. Error bars represent 95% Wilson confidence intervals [19]. The 2026 observation window ends on April 12 and therefore represents a partial calendar year
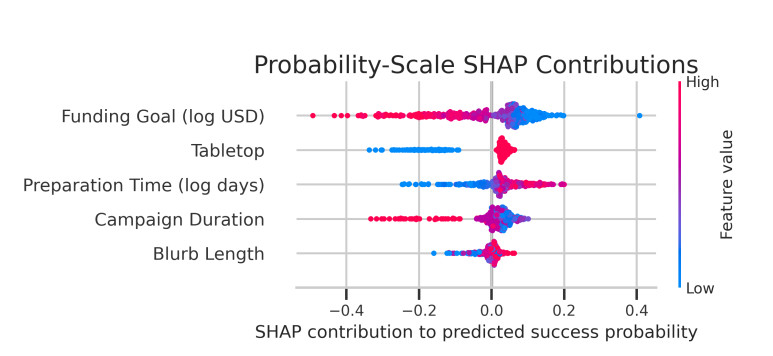
Probability-scale SHAP contributions for the temporal XGBoost model. Horizontal position represents each predictor's contribution to the predicted probability of campaign success, and color represents the observed predictor value
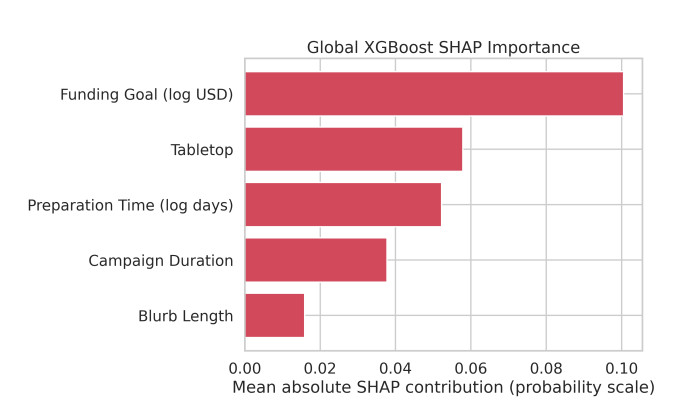
Global predictor importance for the temporal XGBoost model, measured by mean absolute probability-scale SHAP values. Directional patterns are shown in Figure 4
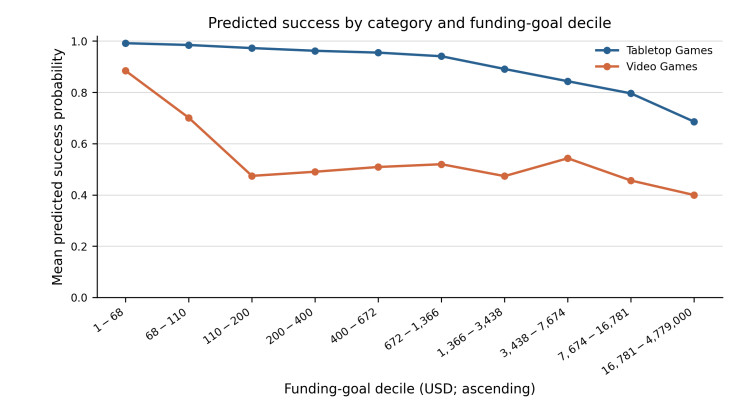
Mean predicted probability of campaign success from the temporal XGBoost model, stratified by the exact game category and numerically ordered funding-goal decile
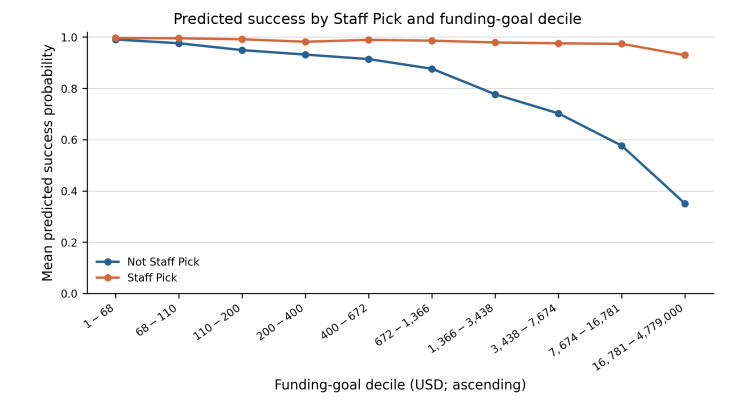
Mean predicted probability of campaign success from the XGBoost with Staff Pick sensitivity model, stratified by Staff Pick status and numerically ordered funding-goal decile. Several Staff Pick cells in the lowest funding-goal deciles were sparsely populated
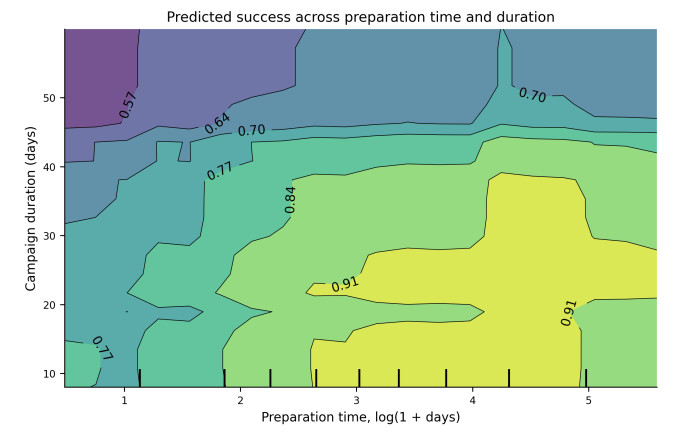
Two-dimensional partial dependence of temporal XGBoost predictions on preparation time and campaign duration. Contours represent predicted probabilities averaged over the remaining predictors in the temporal training sample
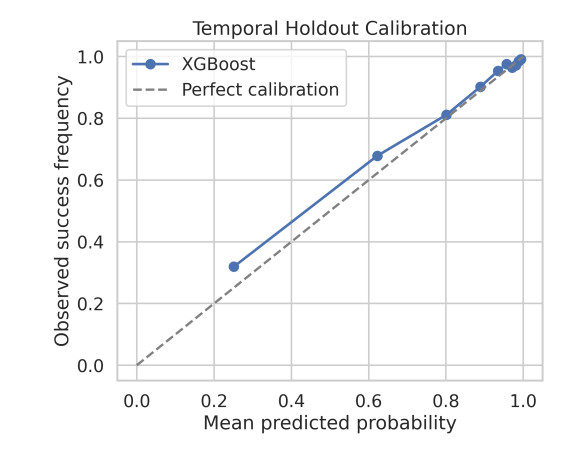
Calibration curve for XGBoost predicted probabilities on the 2025 temporal holdout. The diagonal reference line represents perfect agreement between the predicted and observed success probabilities





 DownLoad: