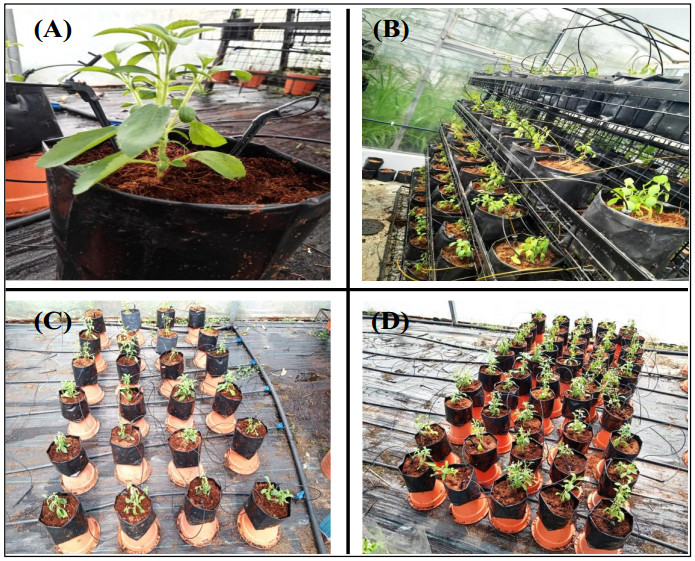
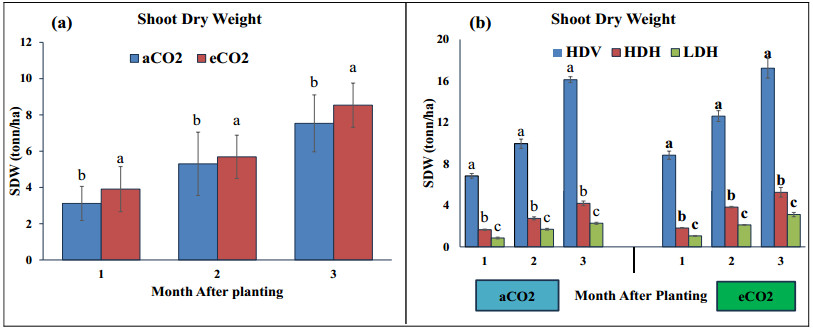
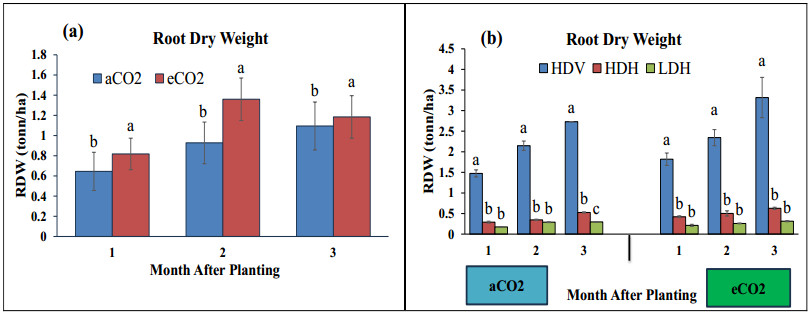
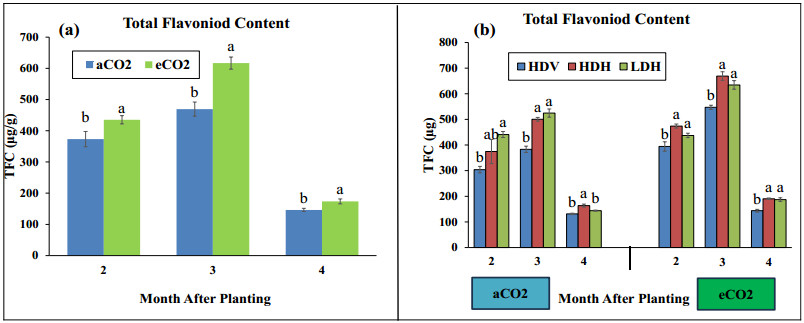
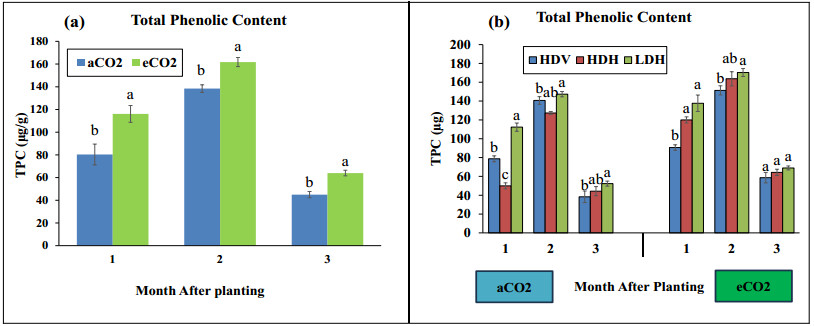
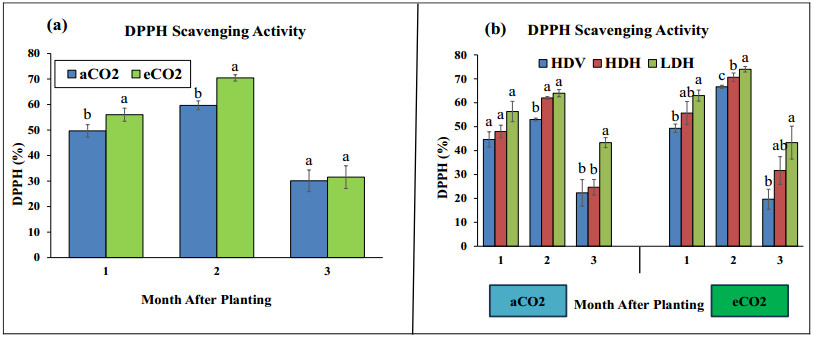
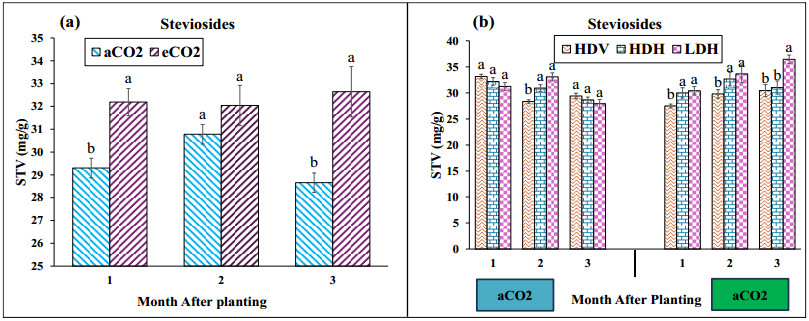
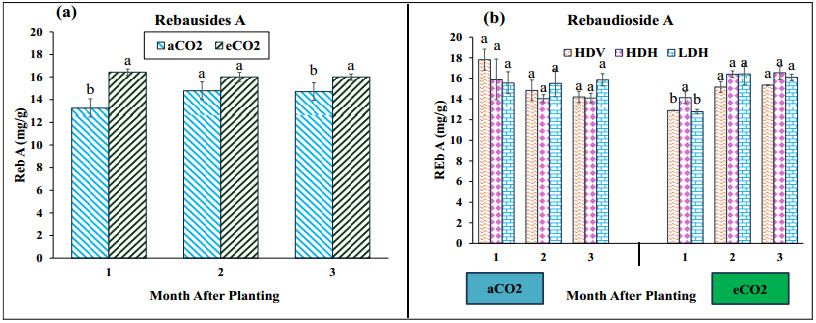
Stevia produces steviol glycosides, which are non-caloric natural sweeteners that are helpful in diabetics. Environmental and agronomic practices play an important role in plant productivity. However, there is a lack of information on stevia productivity under an elevated CO2 (eCO2) and planting density. Therefore, the current research was performed with the objective of evaluating the effect of eCO2 and planting density on the stevia biomass and specialized metabolites. The study used a nested design with randomized complete block design (RCBD) in four blocks with two factors (CO2 and planting density). Factor A, "Carbon dioxide" (CO2) with two levels [eCO2 and aCO2 (ambient CO2], was applied across the block. In comparison, Factor B, with three levels- High-density Vertical (HDV), High-density horizontal (HDH) and Low-density horizontal (LDH)- were nested in Factor A (CO2). All the data were analyzed using an analysis of variance (ANOVA) of the SAS (9.4), and the mean were separated for significant differences using the least significant differences (LSD) test at P≤ 0.05. The study's results showed that eCO2 increased the total dry biomass, despite the density. However, a higher biomass was achieved from the HDV and HDH compared to the LDH. eCO2 treated plant produced significantly higher flavonoid by 17%, 24%, and 15% at the 2nd, 3rd, and 4th month of planting (MAP). A similar trend was seen for the phenolic content. Steviosides and rebaudiosides A significantly increased with eCO2. Under aCO2, no significant differences were seen for steviosides at the 2nd and 4th MAP, while at the 3rd MAP, HDV was observed with a significantly low value. Under eCO2, the HDV had significantly low values for steviosides with no difference in the LDH and the HDH throughout the growth period. The finding indicates that eCO2 positively enhances the biomass and specialized metabolites regardless of the densities. However, the LDH and the HDH performed better than the HDV on individual plant base performance in terms of specialized metabolites.
Citation: A Abzar, Siti Zaharah Sakimin, Hawa ZE Jaafar, Nor Elliza Tajidin, Arsalan Ishaque. Elevated carbon dioxide positively influences biomass and specialized metabolites of Stevia rebaudiana Bertoni under high density horizontal farming[J]. AIMS Agriculture and Food, 2025, 10(2): 423-445. doi: 10.3934/agrfood.2025021
Stevia produces steviol glycosides, which are non-caloric natural sweeteners that are helpful in diabetics. Environmental and agronomic practices play an important role in plant productivity. However, there is a lack of information on stevia productivity under an elevated CO2 (eCO2) and planting density. Therefore, the current research was performed with the objective of evaluating the effect of eCO2 and planting density on the stevia biomass and specialized metabolites. The study used a nested design with randomized complete block design (RCBD) in four blocks with two factors (CO2 and planting density). Factor A, "Carbon dioxide" (CO2) with two levels [eCO2 and aCO2 (ambient CO2], was applied across the block. In comparison, Factor B, with three levels- High-density Vertical (HDV), High-density horizontal (HDH) and Low-density horizontal (LDH)- were nested in Factor A (CO2). All the data were analyzed using an analysis of variance (ANOVA) of the SAS (9.4), and the mean were separated for significant differences using the least significant differences (LSD) test at P≤ 0.05. The study's results showed that eCO2 increased the total dry biomass, despite the density. However, a higher biomass was achieved from the HDV and HDH compared to the LDH. eCO2 treated plant produced significantly higher flavonoid by 17%, 24%, and 15% at the 2nd, 3rd, and 4th month of planting (MAP). A similar trend was seen for the phenolic content. Steviosides and rebaudiosides A significantly increased with eCO2. Under aCO2, no significant differences were seen for steviosides at the 2nd and 4th MAP, while at the 3rd MAP, HDV was observed with a significantly low value. Under eCO2, the HDV had significantly low values for steviosides with no difference in the LDH and the HDH throughout the growth period. The finding indicates that eCO2 positively enhances the biomass and specialized metabolites regardless of the densities. However, the LDH and the HDH performed better than the HDV on individual plant base performance in terms of specialized metabolites.

| [1] |
Geuns JM, Buyse J, Vankeirsbilck A, et al. (2007) Metabolism of steviosides by healthy subjects. Exp Biol Med 232: 164–173. https://doi.org/10.3181/00379727-207-2320164 doi: 10.3181/00379727-207-2320164

|
| [2] | Sumon MH, Mostofa M, Jahan MS, et al. (2008) Comparative efficacy of powdered form of stevia (Stevia rebaudiana Bertoni) leaves and glimepiride in induced diabetic rats. Bangl. J Vet Med 6: 211–215. https://doi.org/10.3329/bjvm.v6i2.2338 |
| [3] |
Lemus-Mondaca R, Vega-Galvez A, Zura-Bravo L, et al. (2012) Stevia rebaudiana Bertoni, source of a high-potency natural sweetener: A comprehensive review on the biochemical, nutritional and functional aspects. Food Chem 132: 1121–1132. https://doi.org/10.1016/j.foodchem.2011.11.140 doi: 10.1016/j.foodchem.2011.11.140
|
| [4] |
Alvarez-Robles MJ, López-Orenes A, Ferrer MA, et al. (2016) Methanol elicits the accumulation of bioactive steviol glycosides and phenolics in Stevia rebaudiana shoot cultures. Ind Crops Prod 87: 273–279. https://doi.org/10.1016/j.indcrop.2016.04.054 doi: 10.1016/j.indcrop.2016.04.054
|
| [5] |
Brandle J (1999) Genetic control of rebaudioside A and C concentration in leaves of the sweet herb, Stevia rebaudiana. Can J Plant Sci 79: 85–91. https://doi.org/10.4141/P98-048 doi: 10.4141/P98-048
|
| [6] | Yadav AK, Singh S, Dhyani D, et al. (2011) A review on the improvement of stevia[Stevia rebaudiana (Bertoni)]. Can J of Plant Sci 91: 1–27. https://doi.org/10.4141/cjps10086 |
| [7] |
Moraes RM, Donega MA, Cantrell CL, et al. (2013) Effect of harvest timing on leaf production and yield of diterpene glycosides in Stevia rebaudiana Bert: A specialty perennial crop for Mississippi. Industrial Crops Prod 51: 385–389. https://doi.org/10.1016/j.indcrop.2013.09.025 doi: 10.1016/j.indcrop.2013.09.025
|
| [8] | EFSA Panel on Food Additives and Nutrient Sources added Food (ANS) (2010) Scientific opinion on the safety of steviol glycosides for the proposed uses as a food additive. EFSA J 8: 1537. https://doi.org/10.2903/j.efsa.2010.1537 |
| [9] |
Melis MS, Rocha ST, Augusto A (2009) Steviol effect, a glycoside of Stevia rebaudiana, on glucose clearances in rats. Br J Biol 69: 371–374. https://doi.org/10.1590/S1519-69842009000200019 doi: 10.1590/S1519-69842009000200019
|
| [10] |
Aranda-Gonzalez I, Betancur-Ancona D, Chel-Guerrero L, et al. (2017) Effect of different drying methods on the composition of steviol glycosides in Stevia rebaudiana Bertoni leaves. Int Agrophys 31: 139–144. http://dx.doi.org/10.1515/intag-2016-0036 doi: 10.1515/intag-2016-0036
|
| [11] |
Koubaa M (2024) Integrated biorefinery for a next-generation methanization process focusing on volatile fatty acid valorization: A critical review. Molecules 29: 2477. https://doi.org/10.3390/molecules29112477 doi: 10.3390/molecules29112477
|
| [12] |
Philippaert K, Pironet A, Mesuere M, et al. (2017) Steviol glycosides enhance pancreatic beta-cell function and taste sensation by potentiating TRPM5 channel activity. Nat Commun 8: 14733. https://doi.org/10.1038/ncomms14733 doi: 10.1038/ncomms14733
|
| [13] |
Kim IS, Yang MR, Lee OH, et al. (2011) Antioxidant activities of hot water are extracted from various spices. Int J Mol Sci 12: 4120–4131. https://doi.org/10.3390/ijms12064120 doi: 10.3390/ijms12064120
|
| [14] |
Tadhani MB, Patel VH, Subhash R (2007) In vitro antioxidant activities of Stevia rebaudiana leaves and callus. J Food Compos Anal 20: 323–329. https://doi.org/10.1016/j.jfca.2006.08.004 doi: 10.1016/j.jfca.2006.08.004
|
| [15] |
Solomon S, Plattner GK, Knutti R, et al. (2009) Irreversible climate change due to carbon dioxide emissions. Proc Natl Acad Sci 106: 1704–1709. https://doi.org/10.1073/pnas.0812721106 doi: 10.1073/pnas.0812721106
|
| [16] | Abzar A, Ahmad WJW, Said MNM, et al. (2018) Enhanced growth, yield and physiological characteristics of rice under elevated carbon dioxide. AIP Conf Proc 1940: https://doi.org/10.1063/1.5027979 |
| [17] | Abzar A, Nizam MSM, Ahmad WJW, et al. (2017) Elevated CO2 concentration enhances germination, seedling growth and vigor of Rice. Ecol Environ Conserv 23: 41–45. |
| [18] |
Ramanathan V, Feng Y (2009) Air pollution, greenhouse gases and climate change: Global and regional perspectives. Atmos Environ 43: 37–50. https://doi.org/10.1016/j.atmosenv.2008.09.063 doi: 10.1016/j.atmosenv.2008.09.063
|
| [19] |
Tian B (2015) Spread of model climate sensitivity linked to double-Intertropical Convergence Zone bias. Ge Res Lett 42: 4133–4141. https://doi.org/10.1002/2015GL064119 doi: 10.1002/2015GL064119
|
| [20] |
Dong N, Liu Z, Luo M, et al. (2019) The effects of anthropogenic land use changes on climate in China driven by global socioeconomic and emission scenarios. Earth's Future 7: 784–804. https://doi.org/10.1029/2018EF000932 doi: 10.1029/2018EF000932
|
| [21] |
Vallati M, Chrpa L, Grzes M, et al. (2015) The 2014 international planning competition: Progress and trends. AI Magazine 36: 90–98. https://doi.org/10.1609/aimag.v36i3.2571 doi: 10.1609/aimag.v36i3.2571
|
| [22] |
Long SP, Ainsworth EA, Rogers A, et al. (2004) Rising atmospheric carbon dioxide: Plants FACE the future. Annu Rev Plant Biol 55: 591–628. https://doi.org/10.1146/annurev.arplant.55.031903.141610 doi: 10.1146/annurev.arplant.55.031903.141610
|
| [23] | Long SP, Ainsworth EA, Leakey AD, et al. (2005). Global food insecurity. The treatment of major food crops with elevated carbon dioxide or ozone under large-scale fully open-air conditions suggests recent models may have overestimated future yields. Philos Trans R Soc, B 360: 2011–2020. https://doi.org/10.1098/rstb.2005.1749 |
| [24] |
Vanderkooi CJ, Reich M, Low M, et al. (2016). Growth and yield stimulation under elevated CO2 and drought: A meta-analysis on crops. Environ Exp Bot 122: 150–157. https://doi.org/10.1016/j.envexpbot.2015.10.004 doi: 10.1016/j.envexpbot.2015.10.004
|
| [25] |
Hogy P, Fangmeier A (2008) Effects of elevated atmospheric CO2 on grain quality of wheat. J Cereal Sci 48: 580–591. https://doi.org/10.1016/j.jcs.2008.01.006 doi: 10.1016/j.jcs.2008.01.006
|
| [26] |
Myers TC (2014) Understanding climate change as an existential threat: Confronting climate denial as a challenge to climate ethics. De Ethica 1: 53–70. https://doi.org/10.3384/de-ethica.2001-8819.141153 doi: 10.3384/de-ethica.2001-8819.141153
|
| [27] | Fernando, MEKK, Amerasekara DABN, Amarasingha RK, et al. (2015) Validation of APSIM for long duration rice varieties in different agro-climatic zones of Sri Lanka. In: Building Productive, Diverse and Sustainable Landscapes-Proceedings of the 17th ASA Conference, 20–24. |
| [28] |
Broberg M (2017) Risk regulation and the future: on the need for helping vulnerable societies to adapt to the consequences of climate change. Eur J Risk Regul 8: 101–105. https://doi.org/10.1017/err.2016.17 doi: 10.1017/err.2016.17
|
| [29] |
Levine JM, McEachern AK, Cowan C (2008) Rainfall affects rare annual plants. J Ecol 96: 795–806. https://doi.org/10.1111/j.1365-2745.2008.01375.x doi: 10.1111/j.1365-2745.2008.01375.x
|
| [30] |
Ramakrishna A, and Ravishankar GA (2011) Influences of abiotic stress signals on secondary metabolites in plants. Plant Signal Behav 6: 1720–1731. https://doi.org/10.4161/psb.6.11.17613. doi: 10.4161/psb.6.11.17613
|
| [31] | Edreva A, Velikova V, Tsonev T, et al. (2008) Stress-protective role of secondary metabolites: Diversity of functions and mechanisms. Gen Appl Plant Physiol 34: 67–78. |
| [32] | Loreto F, Schnitzler JP (2010) Abiotic stresses and induced BVOCs. Trends Plant Sci 15: 154–166. |
| [33] |
Lambers H, Van Den Boogaard R, Veneklaas EJ, et al. (1995) Effects of global environmental change on carbon partitioning in vegetative plants of Triticum aestivum and closely related Aegilops species. Global Change Biol 1: 397–406. https://doi.org/10.1111/j.1365-2486.1995.tb00038.x doi: 10.1111/j.1365-2486.1995.tb00038.x
|
| [34] |
Hartley A (2003) Andean uplift and climate change. J Geol Soc 160: 7–10. https://doi.org/10.1144/0016-764902-083 doi: 10.1144/0016-764902-083
|
| [35] | Amthor JS (1995) Terrestrial higher-plant response to increasing atmospheric[CO2] in relation to the global carbon cycle. Global Change Biol 1: 243–274. https://doi.org/10.1111/j.1365-2486.1995.tb00025.x |
| [36] |
Abzar A, Sakimin SZ, Jaafar HZ, et al. (2024) Enhanced growth performance and steviol glycosides content in stevia rebaudiana under elevated carbon dioxide. Malays Appl Biol 53: 35–48. https://doi.org/10.1029/2010WR009829 doi: 10.1029/2010WR009829
|
| [37] | Matros A, Amme S, Kettig B, et al. (2006) Growth at elevated CO2 concentrations leads to modified profiles of secondary in tobacco cv. SamsunNN and to increased resistance against infection with potato virus Y. Plant, Cell Environ 29: 126–137. https://doi.org/10.1111/j.1365-3040.2005.01406.x |
| [38] |
Sun F, Roderick ML, Lim WH, et al. (2011) Hydroclimatic projections for the Murray-Darling Basin based on an ensemble derived from Intergovernmental Panel on Climate Change AR4 climate models. Water Resour Res 47: W00G02. http://dx.doi.org/10.1029/2010WR009829 doi: 10.1029/2010WR009829
|
| [39] | Casal JJ, Deregibus VA, Sanchez RA (1985) Variations in tiller dynamics and morphology in Lolium multiflorum Lam. vegetative and reproductive plants as affected by differences in red/far-red irradiation. Ann Bot 56: 553–559. https://doi.org/10.1093/oxfordjournals.aob.a087040 |
| [40] |
Badi HN, Yazdani D, Ali SM, et al. (2004) Effects of spacing and harvesting time on herbage yield and quality/quantity of oil in thyme, Thymus vulgaris L. Ind Crops Prod 19: 231–236. https://doi.org/10.1016/j.indcrop.2003.10.005 doi: 10.1016/j.indcrop.2003.10.005
|
| [41] |
Zahra N, Hafeez MB, Ghaffar A, et al. (2023). Plant photosynthesis under heat stress: Effects and management. Environ Exp Bot 206: 105178. https://doi.org/10.1016/j.envexpbot.2022.105178 doi: 10.1016/j.envexpbot.2022.105178
|
| [42] |
Teixeira A, Baenas N, Dominguez-Perles R, et al. (2014). Natural bioactive compounds from winery by-products as health promoters: A review. Int J Mol Sci 15: 15638–15678. https://doi.org/10.3390/ijms150915638 doi: 10.3390/ijms150915638
|
| [43] |
Hernandez-Hernández V, Beníte, M, Boudaoud A (2020) Interplay between turgor pressure and plasmodesmata during plant development. J Exp Bot 71: 768–777. https://doi.org/10.1093/jxb/erz434 doi: 10.1093/jxb/erz434
|
| [44] |
Balkcom KS, Satterwhite JL, Arriaga FJ, et al. (2011) Conventional and glyphosate-resistant maize yields across plant densities in single-and twin-row configurations. Field Crops Res 120: 330–337. https://doi.org/10.1016/j.fcr.2010.10.013 doi: 10.1016/j.fcr.2010.10.013
|
| [45] |
Tokatlidis IS (2014) Addressing the yield by density interaction is a prerequisite to bridge the yield gap of rain-fed wheat. Ann Appl Biol 165: 27–42. https://doi.org/10.1111/aab.12121 doi: 10.1111/aab.12121
|
| [46] | Ramesh K, Singh V, Ahuja PS (2007) Production potential of Stevia rebaudiana (Bert.) Bertoni. under intercropping systems. Arch Agron Soil Sci 53: 443–458. https://doi.org/10.1080/03650340701474949 |
| [47] | Taleie N, Hamidoghli Y, Rabiei B, et al. (2012) Effects of plant density and transplanting date on herbage, steviosides, phenol and flavonoid yield of Stevia rebaudiana Bertoni. Int J Agric Crop Sci 4: 298–302. |
| [48] |
Kumar R, Sharma S, Sood S (2014) Yield components, light interception and marker compound accumulation of stevia (Stevia rebaudiana Bertoni) affected by planting material and plant density under western Himalayan conditions. Arch Agron Soil Sci 60: 1731–1745. https://doi.org/10.1080/03650340.2014.909029 doi: 10.1080/03650340.2014.909029
|
| [49] | Madan S, Ahmad S, Singh GN, et al. (2010) Stevia rebaudiana (Bert.) Bertoni-a review. Indian J Natl Prod Resour 1: 267–286. |
| [50] |
Kumar H, Kaul K, Bajpai-Gupta S, et al. (2012) A comprehensive analysis of fifteen genes of steviol glycosides biosynthesis pathway in Stevia rebaudiana (Bertoni). Gene 492: 276–284. https://doi.org/10.1016/j.gene.2011.10.015 doi: 10.1016/j.gene.2011.10.015
|
| [51] | Megeji NW, Kumar JK, Singh V, et al. (2005) Introducing Stevia rebaudiana, a natural zero-calorie sweetener. Curr Sci 88: 801–804. |
| [52] |
Kumar R, Sharma S, Prasad R (2013) Yield, nutrient uptake, and quality of stevia as affected by organic sources of nutrient. Commun Soil Sci Plant Anal 44: 3137–3149. https://doi.org/10.1080/00103624.2013.832285 doi: 10.1080/00103624.2013.832285
|
| [53] |
Garibaldi L (2012) The FAO global capture production database: a six-decade effort to catch the trend. Marine Policy 36: 760–768. https://doi.org/10.1016/j.marpol.2011.10.024 doi: 10.1016/j.marpol.2011.10.024
|
| [54] | Pal N, Rao AS, Kumar PR (2015) Stability indicating HPLC method development and validation for the simultaneous estimation of propyphenazone, caffeine and paracetamol by gradient elution technique. Int J Pharma Bio Sci 5: 1100–1107. |
| [55] |
Alothman M, Bhat R, Karim, AA (2009) Antioxidant capacity and phenolic content of selected tropical fruits from Malaysia, extracted with different solvents. Food Chem 115: 785–788. https://doi.org/10.1016/j.foodchem.2008.12.005 doi: 10.1016/j.foodchem.2008.12.005
|
| [56] |
Sultana N, Ata A (2008) Oleanolic acid and related derivatives as medicinally important compounds. J Enzyme Inhib Med Chem 23: 739–756. https://doi.org/10.1080/14756360701633187 doi: 10.1080/14756360701633187
|
| [57] | Fatemeh SR, Saifullah R, Abbas FMA, et al. (2012) Total phenolics, flavonoids and antioxidant activity of banana pulp and peel flours: influence of variety and stage of ripeness. Int Food Res J 19: 1041. |
| [58] | Ainsworth EA, Rogers A (2007) The response of photosynthesis and stomatal conductance to rising[CO2]: mechanisms and environmental interactions. Plant, Cell Environ 30: 258–270. https://doi.org/10.1111/j.1365-3040.2007.01641.x |
| [59] | Pandey SD, Kumar A, Patel RK, et al. (2015) Influence of planting densities on plant growth, yield and quality of litchi cv. Shahi. The Bioscan 7: 397–401. |
| [60] |
Sakurai G, Iizumi T, Nishimori M, et al. (2014) How much has the increase in atmospheric CO2 directly affected past soybean production. Sci Rep 4: 4978. https://doi.org/10.1038/srep04978 doi: 10.1038/srep04978
|
| [61] |
Xu Z, Jiang Y, Zhou G (2015) Response and adaptation of photosynthesis, respiration, and antioxidant systems to elevated CO2 with environmental stress in plants. Front Plant Sci 6: 701. https://doi.org/10.3389/fpls.2015.00701 doi: 10.3389/fpls.2015.00701
|
| [62] |
Ainsworth EA, Rogers A, Leakey AD (2008) Targets for crop biotechnology in the future high-CO2 and high-O3 world. Plant Physiol 147: 13–19. https://doi.org/10.1104/pp.108.117101 doi: 10.1104/pp.108.117101
|
| [63] |
Wang X, Taub DR (2010) Interactive effects of elevated carbon dioxide and environmental stresses on root mass fraction in plants: A meta-analytical synthesis using pairwise techniques. Oecologia 163: 1–11. https://doi.org/10.1007/s00442-010-1572-x doi: 10.1007/s00442-010-1572-x
|
| [64] |
Yu J, Yang Z, Jespersen D, et al. (2014) Photosynthesis and protein metabolism are associated with elevated CO2-mitigation of heat stress damages in tall fescue. Environ Exp Bot 99: 75–85. https://doi.org/10.1016/j.envexpbot.2013.09.007 doi: 10.1016/j.envexpbot.2013.09.007
|
| [65] |
Ball RA, Purcell LC, Vories ED (2000) Short-season soybean yield compensation in response to population and water regime. Crop Sci 40: 1070–1078. https://doi.org/10.2135/cropsci2000.4041070x doi: 10.2135/cropsci2000.4041070x
|
| [66] |
Bullock DG, Bullock DS, Nafziger ED, et al. (1998) Does the variable rate seeding of corn pay. Agron J 90: 830–836. https://doi.org/10.2134/agronj1998.00021962009000060019x doi: 10.2134/agronj1998.00021962009000060019x
|
| [67] | Turley RB, Pettigrew WT (2011) Photosynthesis and growth of cotton (Gossypium hirsutum L.) lines deficient in chlorophyll accumulation. J Crop Improv 25: 323–336. https://doi.org/10.1080/15427528.2011.567383 |
| [68] |
Degraaff MA, Vangroenigen KJ, Six J, et al. (2006) Interactions between plant growth and soil nutrient cycling under elevated CO2: A meta-analysis. Global Change Biol 12: 2077–2091. https://doi.org/10.1111/j.1365-2486.2006.01240.x doi: 10.1111/j.1365-2486.2006.01240.x
|
| [69] |
Stiling P, Cornelissen T (2007) How does elevated carbon dioxide (CO2) affect plant–herbivore interactions? A field experiment and meta-analysis of CO2-mediated changes on plant chemistry and herbivore performance. Global Change Biol 13: 1823–1842. https://doi.org/10.1111/j.1365-2486.2007.01392.x doi: 10.1111/j.1365-2486.2007.01392.x
|
| [70] |
Lamichaney A, Maity A (2021) Implications of rising atmospheric carbon dioxide concentration on seed quality. Int J Biometeorol 65: 805–812. https://doi.org/10.1007/s00484-020-02073-x doi: 10.1007/s00484-020-02073-x
|
| [71] |
Ibrahim MH, Jaafar HZ, Karimi E, et al. (2012) Primary, secondary metabolites, photosynthetic capacity and antioxidant activity of the Malaysian Herb Kacip Fatimah (Labisia Pumila Benth) exposed to potassium fertilization under greenhouse conditions. Int J Mol Sci 13: 15321–15342. https://doi.org/10.3390/ijms131115321 doi: 10.3390/ijms131115321
|
| [72] |
Rajashekar R, Yang LL, Hari KVS, et al. (2018) Transmit antenna subset selection in generalized spatial modulation systems. IEEE Trans Veh Technol 68: 1979–1983. https://doi.org/10.1109/TVT.2018.2889024 doi: 10.1109/TVT.2018.2889024
|
| [73] |
Estiarte M, Penuelas J, Kimball BA, et al. (1999) Free-air CO2 enrichment of wheat: leaf flavonoid concentration throughout the growth cycle. Physiol Plant 105: 423–433. https://doi.org/10.1034/j.1399-3054.1999.105306.x doi: 10.1034/j.1399-3054.1999.105306.x
|
| [74] | Pachauri RK, Allen MR, Barros VR, et al. (2014) Climate change 2014: synthesis report. Contribution of Working Groups I, II and III to the fifth assessment report of the Intergovernmental Panel on Climate Change. https://doi.org/10013/epic.45156 |
| [75] |
Penuelas J, Ribas-Carbo M, Giles L (1996) Effects of allelochemicals on plant respiration and oxygen isotope fractionation by the alternative oxidase. J Chem Ecol 22: 801–805. https://doi.org/10.1007/BF02033587 doi: 10.1007/BF02033587
|
| [76] |
Xia E, Rao G, Van Remmen H, et al. (1995) Activities of antioxidant enzymes in various tissues of male Fischer 344 rats are altered by food restriction. J Nutr 125: 195–201. https://doi.org/10.1093/jn/125.2.195 doi: 10.1093/jn/125.2.195
|
| [77] |
Becker C, Kläring HP (2016) CO2 enrichment can produce high red leaf lettuce yield while increasing most flavonoid glycoside and some caffeic acid derivative concentrations. Food Chem 199: 736–745. https://doi.org/10.1016/j.foodchem.2015.12.059 doi: 10.1016/j.foodchem.2015.12.059
|
| [78] |
Sallas L, Luomala EM, Utriainen J, et al. (2003). Contrasting effects of elevated carbon dioxide concentration and temperature on Rubisco activity, chlorophyll fluorescence, needle ultrastructure and secondary metabolites in conifer seedlings. Tree Physiol 23: 97–108. https://doi.org/10.1093/treephys/23.2.97 doi: 10.1093/treephys/23.2.97
|
| [79] |
Dong J, Gruda N, Lam SK, et al. (2018) Effects of elevated CO2 on nutritional quality vegetables: A review. Front Plant Sci 9: 924. https://doi.org/10.3389/fpls.2018.00924 doi: 10.3389/fpls.2018.00924
|
| [80] |
Wu Q, Zhang C, Liang X, et al. (2020) Elevated CO2 improved soil nitrogen mineralization capacity of rice paddy. Sci Total Environ 710: 136438. https://doi.org/10.1016/j.scitotenv.2019.136438 doi: 10.1016/j.scitotenv.2019.136438
|
| [81] |
Yuan K, Yu D, Zhao M, et al. (2018) Abnormal frontostriatal tracts in young male tobacco smokers. Neuroimage 183: 346–355. https://doi.org/10.1016/j.neuroimage.2018.08.046 doi: 10.1016/j.neuroimage.2018.08.046
|
| [82] |
Cheynier V, Comte G, Davies KM, et al. (2013) Plant phenolics: Recent advances on their biosynthesis, genetics, and ecophysiology. Plant Physiol Biochem 72: 1–20. https://doi.org/10.1016/j.plaphy.2013.05.009 doi: 10.1016/j.plaphy.2013.05.009
|
| [83] |
Kałuzewicz A, Krzesinski W, Spizewski T, et al. (2017) Effect of bio-stimulants on several physiological characteristics and chlorophyll content in broccoli under drought stress and re-watering. Notulae Botanicae Horti Agrobotanici Cluj-Napoca 45: 197–202. https://doi.org/10.15835/nbha45110529 doi: 10.15835/nbha45110529
|
| [84] | Riad G, Ghoname A, Ahmed A, et al. (2009) Cabbage nutritional quality is influenced by plant density and nitrogen fertilization. Fruit, Veget Cereal Sci Biotechnol 3: 68–74. |
| [85] | Reilly K, Valverde J, Finn L, et al. (2014) Potential of cultivar and crop management to affect phytochemical content in winter-grown sprouting broccoli (Brassica oleracea L. var. italica). J Sci Food Agric 94: 322–330. https://doi.org/10.1002/jsfa.6263 |
| [86] | Booker FL (2000) Influence of carbon dioxide enrichment, ozone and nitrogen fertilization on cotton (Gossypium hirsutum L.) leaf and root composition. Plant, Cell Environ 23: 573–583. https://doi.org/10.1046/j.1365-3040.2000.00576.x |
| [87] |
Wang SY, Bunce JA (2004) Elevated carbon dioxide affects fruit flavor in field-grown strawberries (Fragaria ananassa Duch). J Sci Food Agric 84: 1464–1468. https://doi.org/10.1002/jsfa.1824 doi: 10.1002/jsfa.1824
|
| [88] | El-Azem A (2013) Decay of some citrus fruit quality caused by fungi. J Appl Sci Res 9: 5920–5929. |
| [89] | Benhmimou A, Ibriz M, Al Faiz C, et al. (2017). Effects of planting density and harvesting time on productivity of natural sweetener plant (Stevia rebaudiana Bertoni.) in Larache Region, Morocco. Int J Plant Res 7: 83–89. |
| [90] |
Gomes EN, Moterle D, Biasi LA, et al. (2018) Plant densities and harvesting times on productive and physiological aspects of Stevia rebaudiana Bertoni grown in southern Brazil. Anais da Academia Brasileira de Ciências 90: 3249–3264. https://doi.org/10.1590/0001-3765201820170510 doi: 10.1590/0001-3765201820170510
|
Figures(8)

A Abzar, Siti Zaharah Sakimin, Hawa ZE Jaafar, Nor Elliza Tajidin, Arsalan Ishaque. Elevated carbon dioxide positively influences biomass and specialized metabolites of Stevia rebaudiana Bertoni under high density horizontal farming[J]. AIMS Agriculture and Food, 2025, 10(2): 423-445. doi: 10.3934/agrfood.2025021


 DownLoad: