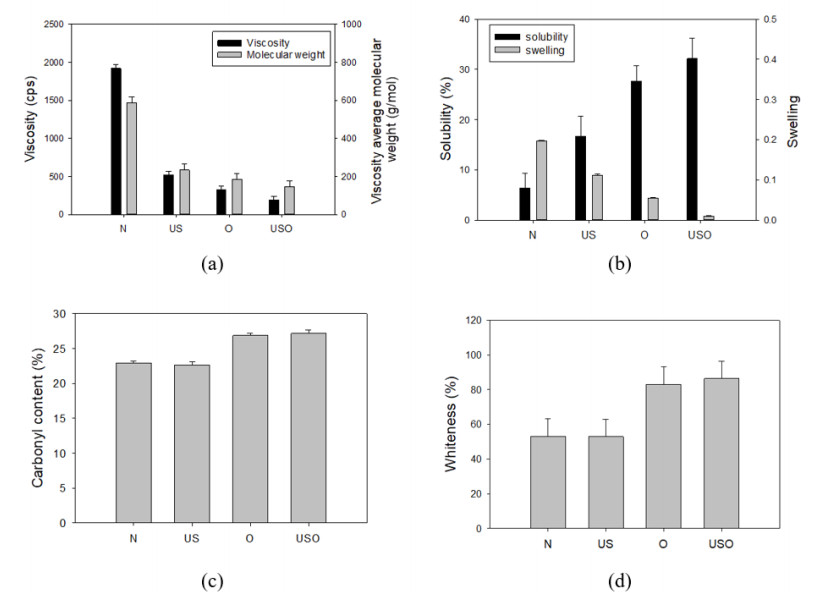
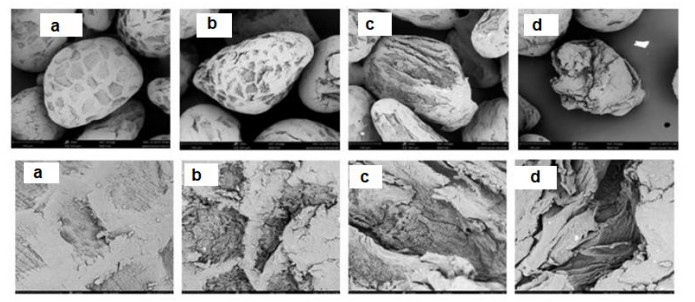
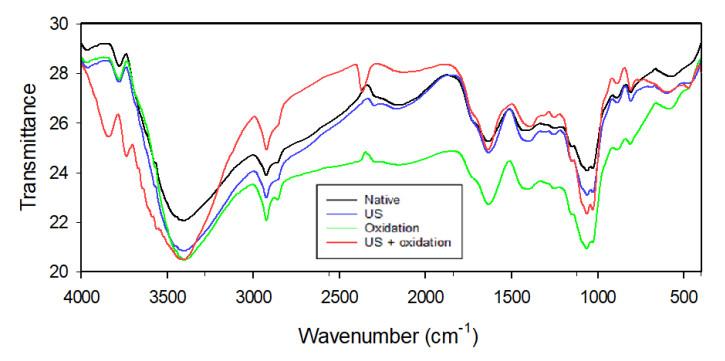
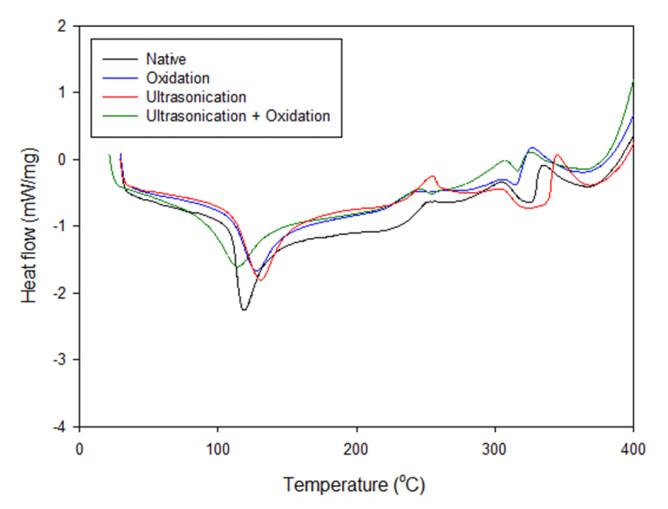
Glucomannan, one of the viscous polysaccharides, has been applied for various purposes in food industries. However, its high viscosity limits glucomannan in some applications e.g., as an injectable material and encapsulant in the spray drying method. Hence, glucomannan modification is needed to fulfill specific characteristics in such applications. This study investigated the modification of glucomannan properties under degradation treatment using hydrogen peroxide and ultrasonication in ethanol solvent. The modifications of glucomannan were conducted in a 35% hydrogen peroxide solution for 4 h and 40 kHz ultrasonication in 50% ethanol solvent. The combination of ultrasonication and oxidation significantly reduced the glucomannan viscosity, molecular weight, and swelling but increased the solubility. The oxidation, ultrasonication, or their combination approach increased carbonyl content, whiteness, and syneresis. The degradation created a coarse surface on the glucomannan particles. Interestingly, although the oxidation or the ultrasonication reduced glucomannan crystallinity, the combination of both methods increased this property. This result confirmed the synergetic treatments of the oxidation using hydrogen peroxide and the ultrasonication could effectively modify the properties of glucomannan including reducing the viscosity to the level that allowed the glucomannan to be spray-dried.
Citation: Dyah H Wardhani, Hana N Ulya, Irvan Maulana, Shafira Salsabila, Andri C Kumoro, José A Vázquez. Analyzing the characteristics of degraded glucomannan of Amorphophallus oncophyllus using hydrogen peroxide and ultrasonication[J]. AIMS Agriculture and Food, 2023, 8(2): 566-584. doi: 10.3934/agrfood.2023031
Glucomannan, one of the viscous polysaccharides, has been applied for various purposes in food industries. However, its high viscosity limits glucomannan in some applications e.g., as an injectable material and encapsulant in the spray drying method. Hence, glucomannan modification is needed to fulfill specific characteristics in such applications. This study investigated the modification of glucomannan properties under degradation treatment using hydrogen peroxide and ultrasonication in ethanol solvent. The modifications of glucomannan were conducted in a 35% hydrogen peroxide solution for 4 h and 40 kHz ultrasonication in 50% ethanol solvent. The combination of ultrasonication and oxidation significantly reduced the glucomannan viscosity, molecular weight, and swelling but increased the solubility. The oxidation, ultrasonication, or their combination approach increased carbonyl content, whiteness, and syneresis. The degradation created a coarse surface on the glucomannan particles. Interestingly, although the oxidation or the ultrasonication reduced glucomannan crystallinity, the combination of both methods increased this property. This result confirmed the synergetic treatments of the oxidation using hydrogen peroxide and the ultrasonication could effectively modify the properties of glucomannan including reducing the viscosity to the level that allowed the glucomannan to be spray-dried.

| [1] |
Tester R, Al-Ghazzewi F (2017) Glucomannans and nutrition. Food Hydrocoll 68: 246–254. https://doi.org/10.1016/j.foodhyd.2016.05.017 doi: 10.1016/j.foodhyd.2016.05.017

|
| [2] |
Wardhani DH, Cahyono H, Ulya HN, et al. (2022) Spray-dryer feed preparation: Enzymatic degradation of glucomannan for iron nanoencapsulation. AIMS Agric Food 7: 683–703. https://doi.org/10.3934/agrfood.2022042 doi: 10.3934/agrfood.2022042
|
| [3] |
Yang J, Xiao JX, Ding LZ (2009) An investigation into the application of konjac glucomannan as a flavor encapsulant. Eur Food Res Technol 229: 467–474. https://doi.org/10.1007/s00217-009-1084-2 doi: 10.1007/s00217-009-1084-2
|
| [4] |
Li Y, Liu H, Xie Y, et al. (2021) Preparation, characterization and physicochemical properties of Konjac glucomannan depolymerized by ozone assisted with microwave treatment. Food Hydrocoll 119: 106878. https://doi.org/10.1016/j.foodhyd.2021.106878 doi: 10.1016/j.foodhyd.2021.106878
|
| [5] |
Yin JY, Ma LY, Xie MY, et al. (2020) Molecular properties and gut health benefits of enzyme-hydrolyzed konjac glucomannans. Carbohydr Polym 237: 116117. https://doi.org/10.1016/j.carbpol.2020.116117 doi: 10.1016/j.carbpol.2020.116117
|
| [6] |
Al-Ghazzewi FH, Tester RF (2014) Inhibition of the adhesion of Escherichia coli to human epithelial cells by carbohydrates. Bioact Carbohydr Diet Fibre 4: 1–5. https://doi.org/10.1016/j.bcdf.2014.05.001 doi: 10.1016/j.bcdf.2014.05.001
|
| [7] |
Jin W, Mei T, Wang Y, et al. (2014) Synergistic degradation of konjac glucomannan by alkaline and thermal method. Carbohydr Polym 99: 270–277. https://doi.org/10.1016/j.carbpol.2013.08.029 doi: 10.1016/j.carbpol.2013.08.029
|
| [8] |
Wu D, Yu S, Liang H, et al. (2020) The influence of deacetylation degree of konjac glucomannan on rheological and gel properties of konjac glucomannan/κ-carrageenan mixed system. Food Hydrocoll 101: 105523. https://doi.org/10.1016/j.foodhyd.2019.105523 doi: 10.1016/j.foodhyd.2019.105523
|
| [9] |
Su Y, Zhang M, Chang C, et al. (2022) The effect of citric-acid treatment on the physicochemical and gel properties of konjac glucomannan from Amorphophallus bulbifer. Int J Biol Macromol 216: 95–104. https://doi.org/10.1016/j.ijbiomac.2022.06.199 doi: 10.1016/j.ijbiomac.2022.06.199
|
| [10] |
Cheng LH, Abd Karim A, Seow CC (2007) Effects of acid modification on physical properties of konjac glucomannan (KGM) films. Food Chem 103: 994–1002. https://doi.org/10.1016/j.foodchem.2006.09.052 doi: 10.1016/j.foodchem.2006.09.052
|
| [11] |
Hongbo T, Lan W, Yanping L, et al. (2019) Effect of acidolysis and oxidation on structure and properties of konjac glucomannan. Int J Biol Macromol 130: 378–387. https://doi.org/10.1016/j.ijbiomac.2019.02.048 doi: 10.1016/j.ijbiomac.2019.02.048
|
| [12] |
Chen Y, Zhao H, Liu X, et al. (2016) TEMPO-oxidized konjac glucomannan as appliance for the preparation of hard capsules. Carbohydr Polym 143: 262–269. https://doi.org/10.1016/j.carbpol.2016.01.072 doi: 10.1016/j.carbpol.2016.01.072
|
| [13] |
Jin W, Xu W, Li Z, et al. (2014) Degraded konjac glucomannan by γ-ray irradiation assisted with ethanol: Preparation and characterization. Food Hydrocoll 36: 85–92. https://doi.org/10.1016/j.foodhyd.2013.09.005 doi: 10.1016/j.foodhyd.2013.09.005
|
| [14] |
Lu P, Guo J, Fan J, et al. (2023) Combined effect of konjac glucomannan addition and ultrasound treatment on the physical and physicochemical properties of frozen dough. Food Chem 411: 135516. https://doi.org/10.1016/j.foodchem.2023.135516 doi: 10.1016/j.foodchem.2023.135516
|
| [15] |
Bhaturiwala R, Bagban MA, Singh TA, et al. (2021) Partial purification and application of β-mannanase for the preparation of low molecular weight galacto and glucomannan. Biocatal Agric Biotechnol 36: 102155. https://doi.org/10.1016/j.bcab.2021.102155 doi: 10.1016/j.bcab.2021.102155
|
| [16] |
Korkiatithaweechai S, Umsarika P, Praphairaksit N, et al. (2011) Controlled release of diclofenac from matrix polymer of chitosan and oxidized konjac glucomannan. Mar Drugs 9: 1649–1663. https://doi.org/10.3390/md9091649 doi: 10.3390/md9091649
|
| [17] | Wang M, He W, Jin X, et al. (2015) Oxidized konjac glucomannan as a paper strength agent. Bioresources 10: 8089–8097. |
| [18] |
Su Z, Sun F, Shi Y, et al. (2009) Effects of formulation parameters on encapsulation efficiency and release behavior of risperidone poly(D, L-lactide-co-glycolide) microsphere. Chem Pharm Bull (Tokyo) 57: 1251–1256. https://doi.org/10.1248/cpb.57.1251 doi: 10.1248/cpb.57.1251
|
| [19] |
Pan T, Peng S, Xu Z, et al. (2013) Synergetic degradation of konjac glucomannan by γ-ray irradiation and hydrogen peroxide. Carbohydr Polym 93: 761–767. https://doi.org/10.1016/j.carbpol.2012.11.075 doi: 10.1016/j.carbpol.2012.11.075
|
| [20] | Tecson MG, Abad L V., Ebajo VD, et al. (2021) Ultrasound-assisted depolymerization of kappa-carrageenan and characterization of degradation product. Ultrason Sonochem 73: 105540. https://doi.org/10.1016/j.ultsonch.2021.105540 |
| [21] |
Singh B, Sharma N (2008) Mechanistic implications of plastic degradation. Polym Degrad Stab 93: 561–584. https://doi.org/10.1016/j.polymdegradstab.2007.11.008 doi: 10.1016/j.polymdegradstab.2007.11.008
|
| [22] |
Ogutu FO, Mu TH (2017) Ultrasonic degradation of sweet potato pectin and its antioxidant activity. Ultrason Sonochem 38: 726–734. https://doi.org/10.1016/j.ultsonch.2016.08.014 doi: 10.1016/j.ultsonch.2016.08.014
|
| [23] |
Kang DC, Zou YH, Cheng YP, et al. (2016) Effects of power ultrasound on oxidation and structure of beef proteins during curing processing. Ultrason Sonochem 33: 47–53. https://doi.org/10.1016/j.ultsonch.2016.04.024 doi: 10.1016/j.ultsonch.2016.04.024
|
| [24] |
Aimin T, Hongwei Z, Gang C, et al. (2005) Influence of ultrasound treatment on accessibility and regioselective oxidation reactivity of cellulose. Ultrason Sonochem 12: 467–472. https://doi.org/10.1016/j.ultsonch.2004.07.003 doi: 10.1016/j.ultsonch.2004.07.003
|
| [25] |
Kidak R, Ince NH (2007) Catalysis of advanced oxidation reactions by ultrasound: A case study with phenol. J Hazard Mater 146: 630–635. https://doi.org/10.1016/j.jhazmat.2007.04.106 doi: 10.1016/j.jhazmat.2007.04.106
|
| [26] | Vernès L, Vian M, Chemat F (2019) Chapter 12—Ultrasound and microwave as green tools for solid-liquid extraction. In: Poole CF (Ed.), Liquid-Phase Extraction, Handbooks in Separation Science, 355–374. https://doi.org/10.1016/B978-0-12-816911-7.00012-8 |
| [27] |
Yu X, Zhou C, Yang H, et al. (2015) Effect of ultrasonic treatment on the degradation and inhibition cancer cell lines of polysaccharides from Porphyra yezoensis. Carbohydr Polym 117: 650–656. https://doi.org/10.1016/j.carbpol.2014.09.086 doi: 10.1016/j.carbpol.2014.09.086
|
| [28] | Khan S, Raja MA, Sayed M, et al. (2019) Chapter 6—Advanced oxidation and reduction processes. In: Ahuja S (Ed.), Advances in Water Purification Techniques: Meeting the Needs of Developed and Developing Countries, 135–164. https://doi.org/10.1016/B978-0-12-814790-0.00006-5 |
| [29] |
Pingret D, Fabiano-Tixier AS, Chemat F (2013) Degradation during application of ultrasound in food processing: A review. Food Control 31: 593–606. https://doi.org/10.1016/j.foodcont.2012.11.039 doi: 10.1016/j.foodcont.2012.11.039
|
| [30] |
Kuakpetoon D, Wang YJ (2006) Structural characteristics and physicochemical properties of oxidized corn starches varying in amylose content. Carbohydr Res 341: 1896–1915. https://doi.org/10.1016/j.carres.2006.04.013 doi: 10.1016/j.carres.2006.04.013
|
| [31] |
Lin W, Ni Y, Wang L, et al. (2019) Physicochemical properties of degraded konjac glucomannan prepared by laser assisted with hydrogen peroxide. Int J Biol Macromol 129: 78–83. https://doi.org/10.1016/j.ijbiomac.2019.02.035 doi: 10.1016/j.ijbiomac.2019.02.035
|
| [32] |
Hu Y, Tian J, Zou J, et al. (2019) Partial removal of acetyl groups in konjac glucomannan significantly improved the rheological properties and texture of konjac glucomannan and κ-carrageenan blends. Int J Biol Macromol 123: 1165–1171. https://doi.org/10.1016/j.ijbiomac.2018.10.190 doi: 10.1016/j.ijbiomac.2018.10.190
|
| [33] |
Morita AT, Carastan DJ, Demarquette NR (2002) Influence of drop volume on surface tension evaluated using the pendant drop method. Colloid Polym Sci 280: 857–864. https://doi.org/10.1007/s00396-002-0694-z doi: 10.1007/s00396-002-0694-z
|
| [34] |
Kang B, Dai Y dong, Zhang H qian, et al. (2007) Synergetic degradation of chitosan with gamma radiation and hydrogen peroxide. Polym Degrad Stab 92: 359–362. https://doi.org/10.1016/j.polymdegradstab.2006.12.006 doi: 10.1016/j.polymdegradstab.2006.12.006
|
| [35] |
Wardhani DH, Etnanta FN, Ulya HN, et al. (2022) Iron encapsulation by deacetylated glucomannan as an excipient using the gelation method: characteristics and controlled release. Food Technol Biotechnol 60: 41–51. https://doi.org/10.17113/ftb.60.01.22.7130 doi: 10.17113/ftb.60.01.22.7130
|
| [36] |
Zhu B, Xin C, Li J, et al. (2019) Ultrasonic degradation of konjac glucomannan and the effect of freezing combined with alkali treatment on their rheological profiles. Molecules 24: 1860. https://doi.org/10.3390/molecules24101860 doi: 10.3390/molecules24101860
|
| [37] | Mason TJ, Lorimer JP (2002) Applied Sonochemistry: The Uses of Power Ultrasound in Chemistry and Processing. Wiley‐VCH Verlag GmbH & Co. KGaA. https://doi.org/10.1002/352760054X |
| [38] |
Yin JY, Ma LY, Siu KC, et al. (2019) Effects of ultrasonication on the conformational, microstructural, and antioxidant properties of konjac glucomannan. Applied Sci (Switzerland) 9: 461. https://doi.org/10.3390/app9030461 doi: 10.3390/app9030461
|
| [39] | Cheng LH, Nur Halawiah H, Lai BN, et al. (2010) Ultrasound mediated acid hydrolysis of konjac glucomannan. Int Food Res J 17: 1043–1050. |
| [40] |
Koda S, Taguchi K, Futamura K (2011) Effects of frequency and a radical scavenger on ultrasonic degradation of water-soluble polymers. Ultrason Sonochem 18: 276–281. https://doi.org/10.1016/j.ultsonch.2010.06.007 doi: 10.1016/j.ultsonch.2010.06.007
|
| [41] |
Ebrahimi R, Tarhande G, Rafiei S (2012) The study of ultrasonic degradation of superabsorbent hydrogels. Org Chem Int 2012: 343768. https://doi.org/10.1155/2012/343768 doi: 10.1155/2012/343768
|
| [42] |
Wang M, Wu Y, Liu Y, et al. (2020) Effect of ultrasonic and microwave dual-treatment on the physicochemical properties of chestnut starch. Polymers (Basel) 12: 1718. https://doi.org/10.3390/polym12081718 doi: 10.3390/polym12081718
|
| [43] |
Sujka M, Jamroz J (2013) Ultrasound-treated starch: SEM and TEM imaging, and functional behaviour. Food Hydrocoll 31: 413–419. https://doi.org/10.1016/j.foodhyd.2012.11.027 doi: 10.1016/j.foodhyd.2012.11.027
|
| [44] |
Luo X, Yao X, Zhang C, et al. (2012) Preparation of mid-to-high molecular weight konjac glucomannan (MHKGM) using controllable enzyme-catalyzed degradation and investigation of MHKGM properties. J of Pol Res 19: 9849. https://doi.org/10.1007/s10965-012-9849-x doi: 10.1007/s10965-012-9849-x
|
| [45] |
Wardhani DH, Nugroho F, Aryanti N, et al. (2018) Simultaneous effect of temperature and time of deacetylation on physicochemical properties of glucomannan. ASEAN J Chem Eng 18: 1–8. https://doi.org/10.22146/ajche.49541 doi: 10.22146/ajche.49541
|
| [46] |
Li J, Ye T, Wu X, et al. (2014) Preparation and characterization of heterogeneous deacetylated konjac glucomannan. Food Hydrocoll 40: 9–15. https://doi.org/10.1016/j.foodhyd.2014.02.001 doi: 10.1016/j.foodhyd.2014.02.001
|
| [47] |
Doussin JF, Monod A (2013) Structure-activity relationship for the estimation of OH-oxidation rate constants of carbonyl compounds in the aqueous phase. Atmos Chem Phys 13: 11625–11641. https://doi.org/10.5194/acp-13-11625-2013. doi: 10.5194/acp-13-11625-2013
|
| [48] |
Chong WT, Uthumporn U, Karim AA, et al. (2013) The influence of ultrasound on the degree of oxidation of hypochlorite-oxidized corn starch. LWT-Food Sci Technol 50: 439–443. https://doi.org/10.1016/j.lwt.2012.08.024 doi: 10.1016/j.lwt.2012.08.024
|
| [49] |
Kamble S, Kumbhar A, Rashinkar G, et al. (2012) Ultrasound promoted efficient and green synthesis of β-amino carbonyl compounds in aqueous hydrotropic medium. Ultrason Sonochem 19: 812–815. https://doi.org/10.1016/j.ultsonch.2011.12.001 doi: 10.1016/j.ultsonch.2011.12.001
|
| [50] |
Xu Z, Sun Y, Yang Y, et al. (2007) Effect of γ-irradiation on some physiochemical properties of konjac glucomannan. Carbohydr Polym 70: 444–450. https://doi.org/10.1016/j.carbpol.2007.05.011 doi: 10.1016/j.carbpol.2007.05.011
|
| [51] |
Burton WG, Holman JS, Pilling GM, et al. (1995) Salters advanced chemistry: A revolution in pre-college chemistry. J Chem Educ 72: 227. https://doi.org/10.1021/ed072p227 doi: 10.1021/ed072p227
|
| [52] |
Wuorimaa A, Jokela R, Aksela R (2006) Recent developments in the stabilization of hydrogen peroxide bleaching of pulps: An overview. Nord Pulp Paper Res J 21: 435–443. https://doi.org/10.3183/npprj-2006-21-04-p435-443 doi: 10.3183/npprj-2006-21-04-p435-443
|
| [53] |
Park HJ, Kwon TY, Nam SH, et al. (2004) Changes in bovine enamel after treatment with a 30% hydrogen peroxide bleaching agent. Dent Mater J 23: 517–521. https://doi.org/10.4012/dmj.23.517 doi: 10.4012/dmj.23.517
|
| [54] |
Abou-Okeil A, El-Shafie A, El Zawahry MM (2010) Ecofriendly laccase-hydrogen peroxide/ultrasound-assisted bleaching of linen fabrics and its influence on dyeing efficiency. Ultrason Sonochem 17: 383–390. https://doi.org/10.1016/j.ultsonch.2009.08.007 doi: 10.1016/j.ultsonch.2009.08.007
|
| [55] |
Li J, Li B, Geng P, et al. (2017) Ultrasonic degradation kinetics and rheological profiles of a food polysaccharide (konjac glucomannan) in water. Food Hydrocoll 70: 14–19. https://doi.org/10.1016/j.foodhyd.2017.03.022 doi: 10.1016/j.foodhyd.2017.03.022
|
| [56] |
Yan JK, Pei JJ, Ma H Le, et al. (2015) Effects of ultrasound on molecular properties, structure, chain conformation and degradation kinetics of carboxylic curdlan. Carbohydr Polym 121: 64–70. https://doi.org/10.1016/j.carbpol.2014.11.066 doi: 10.1016/j.carbpol.2014.11.066
|
| [57] |
Tatirat O, Charoenrein S (2011) Physicochemical properties of konjac glucomannan extracted from konjac flour by a simple centrifugation process. LWT-Food Sci Technol 44: 2059–2063. https://doi.org/10.1016/j.lwt.2011.07.019 doi: 10.1016/j.lwt.2011.07.019
|
| [58] | Manikandan S, Alagu Lakshmanan G, Chandran C, et al. (2016) Phytochemical screening and evaluation of tuber extract of Plectranthus rotundifolius Spreng. By GC-MS and FT-IR spectrum analysis. Eur J Herb Med 4: 36–40. |
| [59] |
Yu H, Huang Y, Ying H, et al. (2007) Preparation and characterization of a quaternary ammonium derivative of konjac glucomannan. Carbohydr Polym 69: 29–40. https://doi.org/10.1016/j.carbpol.2006.08.024 doi: 10.1016/j.carbpol.2006.08.024
|
| [60] |
Liu J, Xu Q, Zhang J, et al. (2015) Preparation, composition analysis and antioxidant activities of konjac oligo-glucomannan. Carbohydr Polym 130: 398–404. https://doi.org/10.1016/j.carbpol.2015.05.025 doi: 10.1016/j.carbpol.2015.05.025
|
| [61] |
Yeung YK, Kang YR, So BR, et al. (2021) Structural, antioxidant, prebiotic and anti-inflammatory properties of pectic oligosaccharides hydrolyzed from okra pectin by Fenton reaction. Food Hydrocoll 118: 106779. https://doi.org/10.1016/j.foodhyd.2021.106779 doi: 10.1016/j.foodhyd.2021.106779
|
| [62] |
Munekata PES, Domínguez R, Franco D, et al. (2017) Effect of natural antioxidants in Spanish salchichón elaborated with encapsulated n-3 long chain fatty acids in konjac glucomannan matrix. Meat Sci 124: 54–60. https://doi.org/10.1016/j.meatsci.2016.11.002 doi: 10.1016/j.meatsci.2016.11.002
|
| [63] | Arkles B (2006) Hydrophobicity, hydrophilicity and silanes. Paint & Coat Ind Mag 22: 114–135. |
| [64] |
Yang G, Xia Y, Lin Z, et al. (2021) Physicochemical impact of cellulose nanocrystal on oxidation of starch and starch based composite films. Int J Biol Macromol 184: 42–49. https://doi.org/10.1016/j.ijbiomac.2021.06.009 doi: 10.1016/j.ijbiomac.2021.06.009
|
| [65] | Malviya R, Sharma PK, Dubey SK (2017) Antioxidant potential and emulsifying properties of kheri (Acacia chundra, Mimosaceae) gum polysaccharide. Marmara Pharm J 21: 701–706. http://dx.doi.org/10.12991/marupj.323594 |
| [66] |
Ako K (2017) Influence of osmotic and weight pressure on water release from polysaccharide ionic gels. Carbohydr Polym 169: 376–384. https://doi.org/10.1016/j.carbpol.2017.04.062 doi: 10.1016/j.carbpol.2017.04.062
|
| [67] |
Lan X, Liu X, Yang Y, et al. (2017) The effect of lamellar structure ordering on the retrogradation properties of canna starch subjected to thermal and enzymatic degradation. Food Hydrocoll 69: 185–192. https://doi.org/10.1016/j.foodhyd.2017.02.004 doi: 10.1016/j.foodhyd.2017.02.004
|
| [68] |
Naknaen P, Tobkaew W, Chaichaleom S (2017) Properties of jackfruit seed starch oxidized with different levels of sodium hypochlorite. Int J Food Prop 20: 979–996. https://doi.org/10.1080/10942912.2016.1191868 doi: 10.1080/10942912.2016.1191868
|
| [69] | Bushra M, Yun XX, Pan SY, et al. (2013) Effect of oxidation and esterification on functional properties of mung bean (Vigna radiata (L.) Wilczek) starch. Eur Food Res Technol 236: 119–128. https://doi.org/10.1007/s00217-012-1857-x |
| [70] |
Schütz C, Sort J, Bacsik Z, et al. (2012) Hard and transparent films formed by nanocellulose-TiO2 nanoparticle hybrids. PLoS One 7: e45828. https://doi.org/10.1371/journal.pone.0045828 doi: 10.1371/journal.pone.0045828
|
| [71] |
Chen Z, Wang S, Shang L, et al. (2020) An efficient and simple approach for the controlled preparation of partially degraded konjac glucomannan. Food Hydrocoll 108: 106017. https://doi.org/10.1016/j.foodhyd.2020.106017 doi: 10.1016/j.foodhyd.2020.106017
|
| [72] | Raza H, Ameer K, Ma H, et al. (2021) Structural and physicochemical characterization of modified starch from arrowhead tuber (Sagittaria sagittifolia L.) using tri-frequency power ultrasound. Ultrason Sonochem 80: 105826. https://doi.org/10.1016/j.ultsonch.2021.105826 |
| [73] |
Lu Y, Zhao X, Fang S (2019) Characterization, antimicrobial properties and coatings application of gellan gum oxidized with hydrogen peroxide. Foods 8: 31. https://doi.org/10.3390/foods8010031 doi: 10.3390/foods8010031
|
| [74] |
Ma X, Cheng Y, Ge Y, et al. (2018) Ultrasound-enhanced nanosized zero-valent copper activation of hydrogen peroxide for the degradation of norfloxacin. Ultrason Sonochem 40: 763–772. https://doi.org/10.1016/j.ultsonch.2017.08.025 doi: 10.1016/j.ultsonch.2017.08.025
|
| [75] |
Song Q, Wu L, Li S, et al. (2022) Aggregation of konjac glucomannan by ethanol under low-alkali treatment. Food Chem X 15: 100407. https://doi.org/10.1016/j.fochx.2022.100407 doi: 10.1016/j.fochx.2022.100407
|
Figures(6)

Dyah H Wardhani, Hana N Ulya, Irvan Maulana, Shafira Salsabila, Andri C Kumoro, José A Vázquez. Analyzing the characteristics of degraded glucomannan of Amorphophallus oncophyllus using hydrogen peroxide and ultrasonication[J]. AIMS Agriculture and Food, 2023, 8(2): 566-584. doi: 10.3934/agrfood.2023031


 DownLoad: