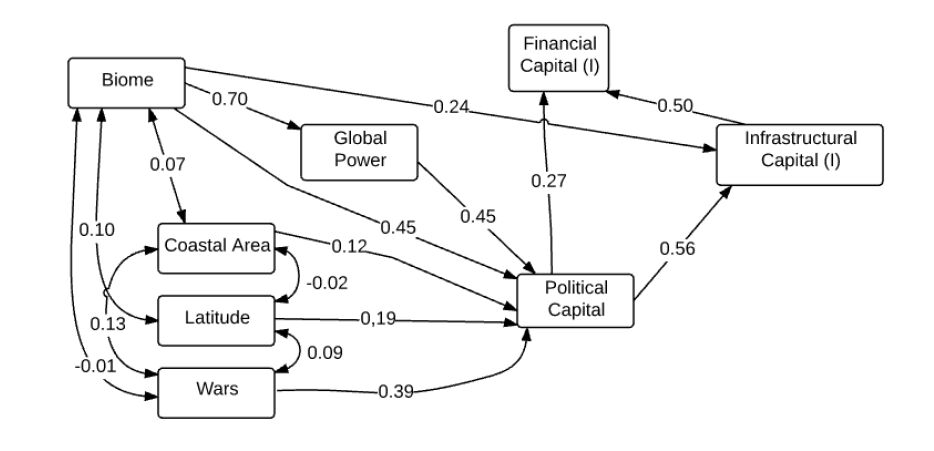
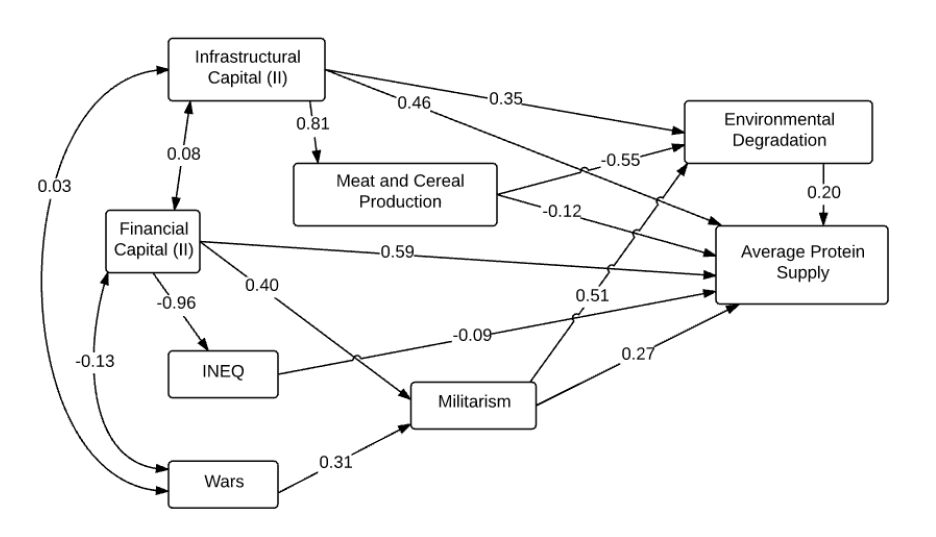
Citation: Edward Kick, Maria Balcazar Tellez, Gretchen Thompson, John Classen. World geography and power, national capitals, and inequality as cross-national causes of food security and environmental outcomes[J]. AIMS Agriculture and Food, 2016, 1(4): 419-438. doi: 10.3934/agrfood.2016.4.419
[1] | Fenglei Qi, Mark Mba Wright . A novel optimization approach to estimating kinetic parameters of the enzymatic hydrolysis of corn stover. AIMS Energy, 2016, 4(1): 52-67. doi: 10.3934/energy.2016.1.52 |
[2] | Eric Danso-Boateng, Osei-Wusu Achaw . Bioenergy and biofuel production from biomass using thermochemical conversions technologies—a review. AIMS Energy, 2022, 10(4): 585-647. doi: 10.3934/energy.2022030 |
[3] | B. Onwona-Agyeman, A. Yaya, G. R. A. Kumara, M. Nakao . Light-soaking tests of zinc oxide photoanodes sensitized with an indoline dye on different transparent conductive substrates. AIMS Energy, 2018, 6(6): 949-958. doi: 10.3934/energy.2018.6.949 |
[4] | Pallav Purohit, Subash Dhar . Lignocellulosic biofuels in India: current perspectives, potential issues and future prospects. AIMS Energy, 2018, 6(3): 453-486. doi: 10.3934/energy.2018.3.453 |
[5] | Leonel J. R. Nunes . Potential exportation of wood pellets and torrefied biomass pellets logistics cost analysis: A comparative case study from Portugal. AIMS Energy, 2024, 12(1): 45-61. doi: 10.3934/energy.2024003 |
[6] | Hans Mattila, Dina Kačar, Tuulia Mali, Taina Lundell . Lignocellulose bioconversion to ethanol by a fungal single-step consolidated method tested with waste substrates and co-culture experiments. AIMS Energy, 2018, 6(5): 866-879. doi: 10.3934/energy.2018.5.866 |
[7] | Debela Tadele, Poritosh Roy, Fantahun Defersha, Manjusri Misra, Amar K. Mohanty . Life Cycle Assessment of renewable filler material (biochar) produced from perennial grass (Miscanthus). AIMS Energy, 2019, 7(4): 430-440. doi: 10.3934/energy.2019.4.430 |
[8] | Poritosh Roy, Animesh Dutta, Bill Deen . Miscanthus: a promising feedstock for lignocellulosic ethanol industry in Ontario, Canada. AIMS Energy, 2015, 3(4): 562-575. doi: 10.3934/energy.2015.4.562 |
[9] | Vladimir A. Kaminsky, Nina Yu. Obvintseva, Svetlana A. Epshtein . The estimation of the kinetic parameters of low-temperature coal oxidation. AIMS Energy, 2017, 5(2): 163-172. doi: 10.3934/energy.2017.2.163 |
[10] | Dengfeng Wang, Xuelan Zhang, Tingting Cheng, Jing Wu, Qijun Xue . Synthesis of propylene carbonate from urea and propylene glycol over zinc oxide: A homogeneous reaction. AIMS Energy, 2014, 2(4): 399-409. doi: 10.3934/energy.2014.4.399 |
Canada, posses one of the largest forest and agricultural biomass resource with 998 million hectares of land, harvests about 143 million tons of carbon per year, which is equivalent to the carbon emissions from the use of fossil fuel locally to the atmosphere [1]. Canada, therefore, has an ample opportunity to become a biofuel production leader in North America. Use of biomass not only benefits the environment, energy security, waste management but also increases the new market, employment, economic opportunities for the local farmers. The technological development in the production of biofuel from biomass has progressed from first generation to the third generation. Adoption of direct feeding of biomass feedstock in a coal fired boiler to produce heat and electricity has a number of limitations such as high moisture contents, huge investment on the transportation, and storage problem due to biological degradation, poor grindability, low energy/bulk density, and lower heating value. To minimize these limitations, a pretreatment method by thermochemical conversion, called torrefaction is used. Torrefaction is a mild pyrolysis at temperature from 200 °C-300 °C with a minimum oxygen environment at a reasonable residence time and atmospheric pressure with heating rate less than 50 °C /min [2,3,4,5]. Main processes of torrefaction are drying, heating/mild pyrolysis and cooling processes. Lignocellulosic biomass consists of hemicellulose, lignin, and cellulose, out of which mostly devolatilisation and carbonization of hemicellulose takes place, whereas lignin and cellulose experiences very little impact [5,6]. After the torrefaction, the product yielded are reported to be of low in moisture contents, hydrophobic, non-biodegradable, higher heating value, higher energy density and improved grindability [7,8].
There are a number of works on torrefaction to investigate the characterizations, pelletization, grindability, gasification etc., which depends upon the torrefaction temperature, residence time, particle size, and biomass constituents [3,5,8,9]. For the establishment of the torrefaction facility at any area, local feedstocks need to be examined. Hence, this study explores the different properties of Miscanthus from energy crop family and wheat straw from an agricultural family from Ontario. There has been very limited existence of literature that made application of DSC-TGA-FTIR for the torrefaction of these types of biomass from Ontario. The mass loss kinetics, derivatives of weight loss, temperature lag, heat flow, heat/mass transfer limitations and the product gas compositions can be precisely monitored by a DSC-TGA-FTIR configured system than a laboratory scale torrefier. We have used both macro and micro TGA for this research.
Samples of energy crop-miscanthus and agricultural residue-wheat straw are collected from the farms in Ontario located near University of Guelph, Willington County. The collected samples were dried using thermo fisher muffle furnace, chopped and grounded in a Retsch PM 100 grinder and were sieved in a sieve AS 200 to prepare sample size of up to 500 microns.
Characterization: ASTM standards ASTM E871, ASTM E872, and ASTM D1102 are used for the identification of moisture contents, volatile matter, and ash contents respectively. The proximate analyses of torrefied biomass were done as per ASTM 1762-84 standard methods. For raw and torrefied biomass, the fixed carbon contents were determined by the difference with 100%, i.e. Carbon contents% = 100 − (ash + VM + MC). The carbon, hydrogen, nitrogen, sulfur contents were determined by using Organic Elemental Analyzer/CHNS-O Analyzer make—Thermo Scientific, model Flash 2000. The oxygen contents were calculated from the difference from total and verified using the same analyzer. The heating values were determined using IKA C-200 bomb calorimeter. Fiber analysis were performed according to the method explained by Sule (2012) [2,18].
A novel macro-TGA reactor (Figure 1), similar to Quartz Wool matrix (QWM) reactor [7], was designed, developed and fabricated in the machine lab at University of Guelph for the purpose of continuous torrefaction to produce a torrefied product. The stainless steel reactor was heated by four electric heaters of 1.25 KW capacities in close contact with the reactor wall and separately controlled by two PID controllers. The inner diameter of the reactor is 75 mm and height is 600 mm. A gas analyzer (Testo-350) was used to know the gas composition. Experiments were conducted for different samples (10-20 mm size) at various temperatures of 200 °C, 250 °C, 275 °C and 300 °C for a residence time of 40 minutes. The residence time measured from the point at which desired torrefaction temperature was reached. This reactor allows to observe simulation of any gas-solid relative velocity; to monitor gas compositions and gas temperature in a reactor while a precision electronic balance continuously measures the mass change (weight) of a reaction. Such reactor could thus accurately simulate the conditions that would expect in a real fixed, moving or entrained flow reactor. Before starting an experiment, the reactor was heated until an equilibrium temperature or steady state was attained. A stream of inter gas (N2) of flow rate of 1-16 liters per minutes was flushed through a flow meter (FMA 5400/5500, Mass Flow Controller, Omega, USA) to maintain an inert environment inside the reactor. Temperatures are measured at two different locations, one from an upper mid portion of the reactor and another from a lower mid portion of the reactor by two separate thermocouples through the temperature controller (CNi16D, Temperature and Process Controller, Omega, USA). Then the sample of biomass of known mass and moisture content was placed into the reactor. The residence time was recorded from that instant. During torrefaction, temperatures of the gas passing through the biomass are continuously recorded. The electronic balance (Model: MS204S, Mettler Toledo, Switzerland) continuously measures the mass of the biomass. The gas composition is determined by collecting gas in a gas-bag, then the quantity of gas is determined with the help of the gas chromatographic analyzer (GC).
Percentage of Mass Yield (MY), Percentage of Energy Yield (EY) and Energy Density Radio (EDR) are determined by using the following formula:
@{\text{MY}} = \frac{{{{\text{M}}_{{\text{tb}}}}}}{{{{\text{M}}_{{\text{rb}}}}}}@ | (1) |
@{\text{EY}} = \frac{{{{\text{M}}_{{\text{tb}}}}{\text{*HH}}{{\text{V}}_{{\text{tb}}}}}}{{{{\text{M}}_{{\text{rb}}}}{\text{*HH}}{{\text{V}}_{{\text{rb}}}}}}@ | (2) |
@{\text{EDR}} = \frac{{{\text{HH}}{{\text{V}}_{{\text{tb}}}}}}{{{\text{HH}}{{\text{V}}_{{\text{rb}}}}}}@ | (3) |
Torrefaction was carried out in a micro-TGA SDT Q 600 TA Instruments in order to compare the differences between the macro-TGA and micro-TGA. A sample of up to 500 microns in a powder form of raw lignocellulosic biomass were dried and kept in desiccators, then used for thermal treatment in micro-TGA. Micro-TGA was heated up at the rate of 5 °C/min to the desired torrefaction temperature (200 °C, 250 °C, 275 °C and 300°C). The sample weight of about 10-12mg was placed in a crucible heated for duration of 40 minutes. Nitrogen was supplied inside the reactor at the rate of 30 mL/minutes to create a minimum oxygen environment. The weight loss and heat flow characteristics were monitored and analyzed by using DSC-TGA plots and the gas compositions are identified by FTIR as per the layout shown in Figure 2.
The degradation of lignocellulosic biomass and cellulose above 300 °C was generally expressed by the Broido-Shafizadeh model [11] based on which Di-Blasi and Lanzetta (1997) [12] developed a kinetic model expressed in two kinetic reactions for the isothermal degradation of xylan in torrefaction. A similar model was used for torrefaction weight loss kinetics for willow, and wheat straw, studied by Prins, et al. (2006) [13], Nocquet, et al. (2011) [14] and Shang, et al. (2013) [15] respectively. In their research, lignocellulosic biomass is torrefied, where A is broken down in V1 volatiles with reaction rate of kv1 with the solid yield of B with reaction rate of k1. In process of thermal treatment, the intermediate solid product breakdown into volatile V2 with reaction rate of kv2 and a solid product C with reaction rate of k2 as shown in the process diagram Figure 3.
Two step torrefaction kinetic parameters are expressed in the differential equations 4-9 [12].
@\frac{{{\text{dA}}}}{{\partial {\text{t}}}} = - \left( {{{\text{k}}_1} + {{\text{k}}_{{\text{v}}1}}} \right){\text{A}}@ | (4) |
@\frac{{{\text{dB}}}}{{\partial {\text{t}}}} = {{\text{k}}_1}{\text{A}} - \left( {{{\text{k}}_2} + {{\text{k}}_{{\text{v}}2}}} \right){\text{B}}@ | (5) |
@\frac{{{\text{dC}}}}{{\partial {\text{t}}}} = {{\text{k}}_2}{\text{B}}@ | (6) |
@\frac{{{\text{d}}{{\text{V}}_1}}}{{\partial {\text{t}}}} = {{\text{k}}_{{\text{v}}1}}{\text{A}}@ | (7) |
@\frac{{{\text{d}}{{\text{V}}_2}}}{{\partial {\text{t}}}} = {{\text{k}}_{{\text{v}}2}}{\text{B}}@ | (8) |
@{{\text{k}}_{\text{i}}} = {{\text{k}}_{0{\text{i}}}}{{\text{e}}^{\frac{{{{\text{E}}_{{\text{Ai}}}}}}{{{\text{RT}}}}}}@ | (9) |
Hence, the torrefied net solid yield will be the addition of A, B and C as expressed by Prins, et al. (2006) [13] in equations 10 and 11.
@{\text{M}}\left( {\text{t}} \right) = {\text{A}} + {\text{B}} + {\text{C}}@ | (10) |
@\frac{{{\text{M}}\left( {\text{t}} \right)}}{{{{\text{M}}_{\text{o}}}}} = (1 + \left[{\frac{{{{\text{k}}_1}{{\text{K}}_1} - {{\text{k}}_1}{{\text{K}}_2}}}{{{{\text{K}}_1}\left( {{{\text{K}}_2} - {{\text{K}}_1}} \right)}}{{\text{e}}^{ - {{\text{K}}_1}{\text{t}}}} + } \right[\frac{{ - {{\text{k}}_1}{{\text{K}}_1} + {{\text{k}}_1}{{\text{K}}_2}}}{{{{\text{K}}_2}\left( {{{\text{K}}_2} - {{\text{K}}_1}} \right)}}{{\text{e}}^{ - {{\text{K}}_2}{\text{t}}}} + \frac{{{{\text{k}}_1}{{\text{K}}_2}}}{{{{\text{K}}_1}{{\text{K}}_2}}}@ | (11) |
The result on mass yield, energy yield and resultant energy density for torrefaction at different temperature are presented in the Table 1. While percentage of mass and energy yield decreases with the treatment temperatures, energy density increases.
Temperature (°C) for 45 minutes | Biomass | Heating Rate °C /min | Environment | Mass Yield (%) | Energy Yield (%) | Energy Density (ratio) |
Miscanthus | Raw | 10 | Nitrogen | |||
200 | Torrefied | 10 | Nitrogen | 84.13 ± 2.0 | 93.12 ± 1.8 | 1.13 |
250 | Torrefied | 10 | Nitrogen | 73.35 ± 0.8 | 88.45 ± 1.4 | 1.24 |
275 | Torrefied | 10 | Nitrogen | 67.92 ± 1.3 | 74.36 ± 1.5 | 1.31 |
300 | Torrefied | 10 | Nitrogen | 58.44 ± 0.7 | 68.93 ± 1.3 | 1.55 |
Wheat Straw | Raw | 10 | Nitrogen | |||
200 | Torrefied | 10 | Nitrogen | 82.56 ± 1.8 | 98.56 ± 1.6 | 1.11 |
250 | Torrefied | 10 | Nitrogen | 70.25 ± 1.2 | 87.48 ± 1.5 | 1.20 |
275 | Torrefied | 10 | Nitrogen | 64.56 ± 1.0 | 72.25 ± 1.4 | 1.33 |
300 | Torrefied | 10 | Nitrogen | 54.83 ± 0.9 | 67.59 ± 1.7 | 1.39 |
For proximity analysis the volatile matter (VM), mass contents (MC), ash contents, and higher heating value (HHV) in triplicate test run within the range of ±2%, ±1%, and ±0.8% respectively were only accepted and recorded. Averages of these values are presented in the Table 2 along with their ultimate analysis values. The heating value of the energy crop (miscanthus) is higher than the heating value of agricultural residue (wheat straw). In both biomass samples, heating value increases with increase in the torrefaction treatment temperatures. Similarly, ash contents of both samples also increase with the temperatures. Carbon contents increases with the increase in the torrefaction temperature, whereas the oxygen concentration decreases with the increase in the treatment temperatures. This shows, the torrefaction improves the fuel quality of biomass by improving C/O ratio.
Treatment Temperature (°C) 45 min | Biomass Type | Proximate Analysis (%) | Ultimate analyzer (%) | HHV MJ/kg | |||||||
VM | MC | Ash | FC | C | H | N | S | O | |||
Miscanthus | Raw | 83.96 | 5.47 | 1.79 | 7.56 | 46.66 | 6.00 | 0.21 | 0.00 | 45.34 | 18.47 |
200 °C | Torrefied | 82.21 | 2.01 | 2.01 | 11.64 | 48.16 | 5.81 | 0.15 | 0.00 | 43.87 | 19.82 |
250 °C | Torrefied | 80.84 | 1.20 | 3.24 | 12.72 | 49.31 | 5.50 | 0.12 | 0.00 | 41.83 | 20.66 |
275 °C | Torrefied | 78.82 | 0.95 | 3.99 | 14.24 | 52.12 | 5.35 | 0.10 | 0.00 | 38.44 | 22.67 |
300 °C | Torrefied | 74.17 | 0.73 | 4.58 | 18.52 | 55.33 | 5.22 | 0.10 | 0.00 | 34.77 | 24.86 |
Wheat Straw | Raw | 77.55 | 5.83 | 5.16 | 11.46 | 45.54 | 5.59 | 0.00 | 0.00 | 43.71 | 17.87 |
200 °C | Torrefied | 77.25 | 1.03 | 6.68 | 15.04 | 46.56 | 5.36 | 0.00 | 0.00 | 41.40 | 18.54 |
250 °C | Torrefied | 75.29 | 0.82 | 7.84 | 16.05 | 48.72 | 5.22 | 0.00 | 0.00 | 38.22 | 19.81 |
275 °C | Torrefied | 64.88 | 0.65 | 8.71 | 25.76 | 50.99 | 5.01 | 0.00 | 0.00 | 35.29 | 21.78 |
300 °C | Torrefied | 52.54 | 0.33 | 9.77 | 37.36 | 55.86 | 4.88 | 0.00 | 0.00 | 29.49 | 22.22 |
The results of fiber analysis of the raw and torrefied biomass are presented in the Table 3. The hot water extractive in the raw miscanthus is higher than the wheat straw. The major extractives of such herbaceous biomass are known to be monomeric sugars like fructose and glucose, oligomeric sugars, phenolic glycosides, alditols and aliphatic acids [10]. The miscanthus contains 36.3% hemicellulose, 11.5% lignin, and 49.1% cellulose, whereas wheat straw has 26.8% hemicellulose, 10.7% lignin, and 38.8% cellulose, indicating miscanthus have higher contents of each components than wheat straw. This could be due to the presence of higher amount of a polysaccharide of glucose with b-(1-4) glucosidic bonds (Funke and Ziegler, 2010) [16]. The thermal treatment decreases more hemicellulose in the biomass than the cellulose and lignin, which is due to devolatilisation of hemicellulose at lower temperature.
Feedstock | Lignocellulosic Biomass Composition (%) | Hot Water Extraction | Surface Area (g/m2) | ||
Hemicellulose | Cellulose | Lignin | |||
Miscanthus | |||||
Raw | 36.3 | 38.8 | 11.5 | 12.6 | 11.4 |
Torrefied at 275 °C 45 min | 14.2 | 35.5 | 41.7 | 6.8 | 14.2 |
Wheat Straw | |||||
Raw | 26.8 | 49.1 | 10.7 | 8.8 | 0.3 |
Torrefied at 275 °C 45 min | 17.7 | 36.6 | 38.2 | 5.1 | 3.2 |
Differential scanning calorimetry is a method to study thermal transitions of a biomass/polymer, when they are under thermal treatment. The heat absorbed by the biomass or difference in heat output of two heaters against temperature is plotted in DSC. Once the glass transition temperature reached, the biomass needs more heat because the heat capacity of the biomass is increased. This helps to identify the glass transition temperature by DSC. After the glass transition temperature, biomass polymers are free to move and finally attained a systematic arrangement which is called as crystallization temperature. At this temperature, biomass give off heat due to exothermic transition, i.e. heater 1 needs less heat to catch up the reference heater 2 heating rate, which consequently gives bid dip in the plot of heat flow and temperature. The temperature at the lowest dip is the crystallization temperature and the area under dip gives the latent energy of crystallization for the biomass. Once more heat is added above the crystallization temperature, biomass reaches towards melting temperature at which biomass absorbs more heat from heater 1 due to an endothermic transition on melting to keep the same rate as reference pan heating. This gives large peak on the DSC plot.
The percentage weight loss increases with an increase in the treatment residence time as shown in Figure 4a-d. The first loss is due to the loss in the moisture contents of biomass below 150 °C and 15minutes of residence time. Another sharp weight loss of biomass starts after 150 °C and above 15minutes of residence time. This may be due to the rapid devolatilisation of hemicellulose of biomass. Derivative of weight loss shows the rate of change of weight loss is much faster during devolatilisation of biomass. Micro-TGA shows more precise weight loss (%) and derivative weight (%/min) than the macro-TGA. However, the sampling handling capacity of the micro-TGA (5-10 mg) is too small in comparison to the Macro-TGA (1-5 g). Macro-TGA shows a closer pattern with the practical boiler.
The weight percentage verses residence time of torrefaction process at three various temperatures (200 °C, 250 °C, and 275 °C) captured from the TGA data for miscanthus and wheat straw are presented in Figure 4c-d. Trends of both plots show that weight % increases with the increase either in temperature or residence time. The slope of TGA curves increases with the increase in temperature from 200 °C to 250/275 °C. This slope signifies the effect of residence time on weight percentage change. Overall, the effect of temperature and residence time on the thermal degradation of wheat straw is higher than on the miscanthus in a similar thermal treatment environment. This may be due to higher contents of volatile matters and hemicellulose in miscanthus than in the wheat straw as shown in Table 2 and 3. This shows wheat straw is more reactive than the miscanthus as a solid fuel.
Table 4 shows the kinetic parameter of miscanthus during torrefaction. The kinetic energy for the miscanthus is higher than the wheat straw, which implies that the miscanthus torrefaction process needs more energy than the torrefaction process for wheat straw. Similarly, higher activation energy (E) implies the smooth reaction, whereas lower activation energy implies the quick reaction. Raw biomass is more reactive than the torrefied biomass [15].
a) Descriptive statistics for variables | |||||
Variable | Minimum value | Maximum value | Mean value | Standard dev. | |
T (K) | 448.15 | 548.15 | 498.15 | 31.02 | |
Y = Ln (derivative wt%/min/ 100) | -6.69 | -3.79 | -5.48 | 0.93 | |
X = Weight% /100 | 0.93 | 0.96 | 0.95 | 0.01 | |
b) Calculated Parameter values | |||||
Parameter | Miscanthus | Wheat Straw | |||
A (min-1) | 8.8 × 10³ | 1.2 × 10⁴ | |||
N | 0.88 | 0.91 | |||
E (kJ/mol) | 59.95 | 51.72 | |||
c) Analysis of variance | |||||
Source | DF | Sum of squares | Mean square | F-vlue | Prob (F) |
Regression | 2 | 16.25750 | 8.12875 | 161.51 | 0.00001 |
Error | 18 | 0.90594 | 0.05033 | ||
Total | 20 | 17.16344 |
Arrhenius plots for the study of the kinetics of the torrefied miscanthus and wheat straw are presented in Figure 5. It seems that the kinetic rate of thermochemical reaction for torrefied miscanthus is lower than that of torrefied wheat straw. Torrefaction kinetics take two steps: drying of biomass and devolatilisation of hemicellulose.
TGA is one of a very reliable method for studying the thermo-chemical analysis of wide varieties of biomass samples. When FTIR is cascaded as a complementary method with TGA, it can give valuable information on the constituents of gaseous products as they are released by the thermal treatment of biomass samples. Hence, in this study, TGA is cascaded with FTIR to identify the torrefaction behavior of different biomass samples and measure the main gaseous constituents of the products released during the thermal treatment. The exhaust gas composition during the torrefaction process is monitored by FTIR by directly coupling with TGA. The majority of the exhaust gas contains carbon dioxide, carbon monoxide and water vapor. Traces of methane are also observed from the FTIR. The maximum exhaust released can be observed during the maximum weight loss period, which was also observed by Eseltine, et al. (2013) [17]. The output of the torrefaction process captured by the FTIR has been presented in the Figure 6a. The major gaseous components observed during torrefaction were water, carbon dioxide, carbon monoxide, 1, 2-Dibromethylene, and many other components. Figure 6b shows the gaseous components identified by TGA-FTIR analysis are CO at 2100 cm−1, CO2 at 2350 & 700 cm−1, and H2O at 3500-3700 and 750-1000 cm−1. TGA-FTIR study shows that the emission of gaseous products increases with the increase in the treatment temperature.
Thermochemical pre-treatment of miscanthus and wheat straw were carried out for assessing their fuel quality in a macro-TGA and a configured DSC-TGA-FTIR system. Both torrefied samples show better solid fuel performance than the raw biomass in terms of moisture contents, energy contents, density, hydrophobicity and ignitibility etc. The torrefied biomass performs similar to coal. However, biomass has many limitations. The torrefaction temperature has more impact on the torrefaction process than the residence time. The higher torrefaction temperature results in the higher hydrophobicity. The gaseous product yields are mainly carbon dioxide and water. The drying process starts at a lower temperature at around 100 °C, whereas the devolatilisation of hemicellulose takes place from 200 °C. From the study on the characterization of torrefied lignocellulosic biomass, it can be concluded that torrefied energy crops and agricultural residues are a good candidate to be used in thermal power plants. The longer durability of the torrefied material also increases the probability for pelletization and exporting local and global markets. The raw biomass shows more reactive property than the torrefied one during the kinetic study, which shows torrefied biomass are more stable in a boiler. The kinetic rate of the thermochemical reaction for torrefied miscanthus is lower than that of torrefied wheat straw. Heating value is increased by 25% after torrefaction.
The authors would like to acknowledge the research grant from Natural Sciences and Engineering Research Council of Canada (NSERC, Grant no. 400495) for this study.
All authors declare no conflicts of interest in this paper.
[1] | Townsend R, Ceccacci I, Cooke S, et al. (2013) Implementing agriculture for development: World Bank Group agriculture action plan (2013-2015), Washinton DC: World Bank. |
[2] | Hallegatte S, Bangalore M, Bonzanigo L, et al. (2016) Shock Waves: Managing the Impacts of Climate Change on Poverty, Washington, D.C.: World Bank. |
[3] | FAO, IFAD, WFP (2014) The State of Food Insecurity in the World 2014. Strengthening the enabling environment for food security and nutrition, Rome: FAO. |
[4] | Pilcher JM (2006) Food in world history, New York, NY: Routledge. |
[5] | McMichael P (2004) Development and social change: a global perspective, Thousand Oaks, CA: Pine Forge Press. |
[6] | Altieri MA (1995) Agroecology: the science of sustainable agriculture, Boulder, Colo.; London: Westview Press; IT Publications. |
[7] |
de Janvry A (2010) Agriculture for development: new paradigm and options for success. Agric Econ 41: 17-36. doi: 10.1111/j.1574-0862.2010.00485.x
![]() |
[8] |
Ehrlich PR, Ehrlich AH, Daily GC (1993) Food Security, Population and Environment. Popul Dev Rev 19: 1-32. doi: 10.2307/2938383
![]() |
[9] | Uphoff N (2002) Agroecological innovations: increasing food production with participatory development, London; Sterling, VA: Earthscan Publications. |
[10] | The CGIAR at 40 and Beyond: Impacts that Matter for the Poor and the Planet, 2012. Available from: http://www.cgiar.org/pdf/cgiar@40_final_LOWRES.pdf |
[11] | Sen A (1981) Poverty and famines: an essay on entitlement and deprivation, Oxford: Clarendon Press. |
[12] | Sen A (1997) Hunger in the Contemporary World Development Economics Discussion Paper No. 8: 24. |
[13] | Friedland W (2004) Agrifood Globalization and Commodity Systems. Int J Sociol Agric Food 12: 5-16. |
[14] |
Bowen S, Gerritsen P (2007) Reverse leasing and power dynamics among blue agave farmers in western Mexico. Agric Hum Values 24: 473-488. doi: 10.1007/s10460-007-9088-7
![]() |
[15] |
Altieri MA (2009) Agroecology, Small Farms, and Food Sovereignty. Mon Rev 61: 102-113. doi: 10.14452/MR-061-03-2009-07_8
![]() |
[16] |
Jorgenson AK, Kuykendall KA (2008) Globalization, Foreign Investment Dependence and Agriculture Production: Pesticide and Fertilizer Use in Less-developed Countries, 1990-2000. Soc Forces 87: 529-560. doi: 10.1353/sof.0.0064
![]() |
[17] | Mazoyer M, Roudart L (2006) A history of world agriculture: from the neolithic age to the current crisis, New York: Monthly Review Press. |
[18] |
Buttel FH, Kenney M, Kloppenburg J (1985) From Green Revolution to Biorevolution: Some Observations on the Changing Technological Bases of Economic Transformation in the Third World. Econ Dev Cult Chang 34: 31-55. doi: 10.1086/451508
![]() |
[19] | Anonymous (2008) 2009 List of Developing Countries, Washington, D.C.: World Bank. |
[20] |
Burns T, Kick E, Davis B (2015) Theorizing and Rethinking Linkages Between the Natural Environment and the Modern World-System: Deforestation in the Late 20th Century. J World-Syst Res 9: 357-390. doi: 10.5195/JWSR.2003.237
![]() |
[21] |
Friedmann H (1982) The Political Economy of Food: The Rise and Fall of the Postwar International Food Order. Am J Sociol 88: S248-S286. doi: 10.1086/649258
![]() |
[22] | Malthus TR (1798) An essay on the Principle of Population, London: Oxford University Press. |
[23] | Sachs J, Warner A (1995) Natural resource abundance and economic growth Working Paper 5398. |
[24] | Diamond JM (1997) Guns, germs, and steel: the fates of human societies, New York: W.W. Norton & Co. |
[25] |
Bloom DE, Sachs JD, Collier P, et al. (1998) Geography, Demography, and Economic Growth in Africa. Brook Pap Econ Act 1998: 207-295. doi: 10.2307/2534695
![]() |
[26] | Sachs J (2001) Tropical underdevelopment, Working Paper 8119, Cambridge, MA.: National Bureau of Economic Research. |
[27] | Easterly W, Levine R (2002) How Ecological Endowments Condition Economic Development. National Bureau of Economic Research working paper series. Available from: http://www.nber.org/papers/w9106.pdf |
[28] | Flora CB, Flora JL (2013) Rural communities: legacy and change, 4th ed Eds., Boulder, Colo.: Westview Press. |
[29] | Montesquieu CS (1989) The spirit of the laws, Cambridge: Cambridge University Press. |
[30] | Myrdal G (1968) Asian drama; an inquiry into the poverty of nations, New York: Pantheon. |
[31] | Romer P (1989) Endogenous Technological Change. National Bureau of Economic Research working paper series; NBER Working Paper No. 3210. |
[32] |
Lucas RE (1988) On the mechanics of economic development. J Monetary Econ 22: 3-42. doi: 10.1016/0304-3932(88)90168-7
![]() |
[33] | Putnam RD (2000) Bowling alone: the collapse and revival of American community, New York: Touchstone. |
[34] |
Coleman JS (1986) Social Theory, Social Research, and a Theory of Action. Am J Sociol 91: 1309-1335. doi: 10.1086/228423
![]() |
[35] | Tonnies F (1955) Community and Association (Gemeinschaft und gesellschaft), London: Routledge and Kegan Paul. |
[36] | Weber M (2009) From Max Weber: Essays in Sociology, New York: Routledge. |
[37] | North D (1990) Institutions, Institutional Change, and Economic Performance, Cambridge, UK: Cambridge University Press. |
[38] | Rodrik D (2007) One economics, many recipes: globalization, institutions, and economic growth, Princeton: Princeton University Press. |
[39] | Inkeles A, Smith DH (1974) Becoming modern: individual change in six developing countries, Cambridge, Mass.: Harvard University Press. |
[40] | Rostow WW (1960) The stages of economic growth, a non-Communist manifesto, Cambridge: Cambridge University Press. |
[41] | Comte A (1908) A general view of positivism, London, Routledge. |
[42] | Smith A (1776) An inquiry into the nature and causes of the wealth of nations, New York: Modern Library. |
[43] | Durkheim É (1893) The division of labor in society, New York: Free Press. |
[44] | Ricardo D (1819) On the principles of political economy and taxation, Georgetown, D.C.: Joseph Milligan. |
[45] | Spencer H (1887) The factors of organic evolution, London: Williams and Norgate. |
[46] | Parsons T (1964) Social structure and personality, New York: Free Press of Glencoe. |
[47] |
Barro RJ (1991) Economic Growth in a Cross Section of Countries. Q J Econ 106: 407-443. doi: 10.2307/2937943
![]() |
[48] | Bullock B, Firebaugh G (1990) Guns and butter? The effect of militarization on economic and social development in the Third World. J Political Mil Sociol 18: 231-266. |
[49] |
Jenkins JC, Scanlan SJ (2001) Food Security in Less Developed Countries, 1970 to 1990. Am Sociol Rev 66: 718-744. doi: 10.2307/3088955
![]() |
[50] | Neumayer E (2013) Weak versus strong sustainability: exploring the limits of two opposing paradigms, 4th Eds., Cheltenham Glos, Uk: Edward Elgar Publishing, Ltd. |
[51] | Huntington SP (1968) Political order in changing societies, New Haven, Yale University Press. |
[52] | Sørensen G (1991) Democracy, dictatorship and development: economic development in selected regimes of the third world, Houndmills, Basingstoke, Hampshire: MacMillan. |
[53] | Anonymous (2007) World development report 2008 electronic resource: agriculture for development, Washington, D.C.; London: World Bank; Eurospan distributor. |
[54] |
Pechlaner G, Otero G (2010) The Neoliberal Food Regime: Neoregulation and the New Division of Labor in North America. Rural Sociol 75: 179-208. doi: 10.1111/j.1549-0831.2009.00006.x
![]() |
[55] |
Reid G (2000) Free trade, business strategy and globalisation. Glob Bus Econ Rev 2: 26-38. doi: 10.1504/GBER.2000.006148
![]() |
[56] | Prebisch R (1948) Acerca de los anteproyectos sobre Banco Central y bancos. Revista de hacienda 13: 146-178. |
[57] | Singer HW (1949) Economic progress in underdeveloped countries. Soc Res 16: 1-11. |
[58] |
Frank AG (1966) The development of underdevelopment. Mon Rev 18: 17-31. doi: 10.14452/MR-018-04-1966-08_3
![]() |
[59] | Wallerstein IM (1974) The modern world-system; capitalist agriculture and the origins of the European world-economy in the sixteenth century, New York, Academic Press. |
[60] | Amin S (1976) Unequal development: An essay on the social formation of peripheral capitalism, New York: Monthly Review Press. |
[61] | Baran PA (1957) The political economy of growth, New York: Monthly Review Press. |
[62] | Evans PB (1979) Dependent development: the alliance of multinational, state, and local capital in Brazil, Princeton, N.J.: Princeton University Press. |
[63] | Chase-Dunn C (1991) Global formation: structures of the world-economy, Cambridge, Mass.: Basil Blackwell. |
[64] |
Foster JB (1999) Marx's Theory of Metabolic Rift: Classical Foundations for Environmental Sociology. Am J Sociol 105: 366-405. doi: 10.1086/210315
![]() |
[65] |
Galtung J (1971) A Structural Theory of Imperialism. J Peace Res 8: 81-117. doi: 10.1177/002234337100800201
![]() |
[66] |
Snyder D, Kick EL (1979) Structural Position in the World System and Economic Growth, 1955-1970: A Multiple-Network Analysis of Transnational Interactions. Am J Sociol 84: 1096-1126. doi: 10.1086/226902
![]() |
[67] | Shiva V (2000) Stolen harvest: the hijacking of the global food supply, Cambridge, MA: South End Press. |
[68] |
Dinour LM, Bergen D, Yeh M (2007) The Food Insecurity–Obesity Paradox: A Review of the Literature and the Role Food Stamps May Play. J Am Diet Assoc 107: 1952-1961. doi: 10.1016/j.jada.2007.08.006
![]() |
[69] | Devereux BS (2007) From ‘Old Famines’ to ‘New Famines, In: edited by Devereux. Stephen. Ed, The new famines: why famines persist in an era of globalization, London; New York: Routledge, 367. |
[70] | Jorgenson AK, Kick EL (2006) Globalization and the environment, Leiden; Boston: Brill. |
[71] | Wright S (1921) Correlation and causation. J Agric Res 20: 557-585. |
[72] |
Wright S (1960) Path Coefficients and Path Regressions: Alternative or Complementary Concepts?. Biometrics 16: 189-202. doi: 10.2307/2527551
![]() |
[73] | Blalock HM (1979) Social statistics, Revised 2nd ed Eds., New York: McGraw-Hill. |
[74] | Duncan OD (1972) Socioeconomic background and achievement, New York: Seminar Press. |
[75] | All About the Protein Food Group, 2016. Available from: http://www.choosemyplate.gov/protein-foods |
[76] | Wackernagel M, Rees WE (1996) Our ecological footprint: reducing human impact on the earth, Gabriola Island, BC; Philadelphia, PA: New Society Publishers. |
[77] | Davis AS, Hill JD, Chase CA, et al. (2012) Increasing Cropping System Diversity Balances Productivity, Profitability and Environmental Health. PLoS ONE 7: 1-8. |
[78] | Parsons T (1951) The Social System, Glencoe, Il: Free Press. |
[79] | Worldwide Governance Indicators, 2014. Available from: http://info.worldbank.org/governance/wgi/index.aspx#home |
[80] | Fixed Broadband Subscribers, 2000. Available from: http://data.worldbank.org/indicator/IT.NET.BBND.P2 |
[81] | Passenger Cars, 2000. Available from: http://data.worldbank.org/indicator/IS.VEH.PCAR.P3 |
[82] | Benoit E (1973) Defense and Economic Growth in Developing Countries, Washington, D.C.: Health Lexington Books. |
[83] | Military Expenditure, % of GDP, 2000. Available from: http://data.worldbank.org/indicator/MS.MIL.XPND.GD.ZS |
[84] | Armed Forces Personnel, 2000. Available from: http://data.worldbank.org/indicator/MS.MIL.TOTL.P1 |
[85] | GINI Index, World Bank Estimate, 2000. Available from: http://data.worldbank.org/indicator/SI.POV.GINI |
[86] | Marine Jurisdictions: Coastal Length, 2012. Available from: http://web.archive.org/web/20120419075053/http:/earthtrends.wri.org/text/coastal-marine/variable-61.html |
[87] | Sivard RL (1996) World Military and Social Expenditures, Ann Arbor, MI: Inter-university Consortium for Political and Social Research. |
[88] | Kick EL, Mckinney L, McDonald S, et al. (2011) A Multiple-Network Analysis of the World-System of Nations, In: Scott, J., Carrington, P. Eds, The Sage Handbook of Social Network Analysis, London: Sage, 311-328. |
[89] | Crop Production, 2005. Available from: http://data.worldbank.org/indicator/AG.PRD.CROP.XD |
[90] | Livestock Production, 2005. Available from: http://data.worldbank.org/indicator/AG.PRD.LVSK.XD/countries |
[91] | GDP per capita, 2014. Available from: http://data.worldbank.org/indicator/NY.GDP.PCAP.CD |
[92] | Emission Database for Global Atmospheric Research: Nitrous Oxide, 2016. Available from: http://edgar.jrc.ec.europa.eu/part_N2O.php |
[93] | Education: Global Methane Inventory, 2010. Available from: http://icp.giss.nasa.gov/education/methane/intro/cycle.html |
[94] |
Walsh C, O'Regan B, Moles R (2009) Incorporating methane into ecological footprint analysis: A case study of Ireland. Ecol Econ 68: 1952-1962. doi: 10.1016/j.ecolecon.2008.07.008
![]() |
[95] |
Borucke M, Moore D, Cranston G, et al. (2013) Accounting for demand and supply of the biosphere's regenerative capacity: The National Footprint Accounts’ underlying methodology and framework. Ecol Ind 24: 518-533. doi: 10.1016/j.ecolind.2012.08.005
![]() |
1. | 2021, 9781119624547, 213, 10.1002/9781119624547.ch6 | |
2. | Meiyun Chai, Li Xie, Xi Yu, Xingguang Zhang, Yang Yang, Md. Maksudur Rahman, Paula H. Blanco, Ronghou Liu, Anthony V. Bridgwater, Junmeng Cai, Poplar wood torrefaction: Kinetics, thermochemistry and implications, 2021, 143, 13640321, 110962, 10.1016/j.rser.2021.110962 | |
3. | Ranjan R. Pradhan, Pragyan P. Garnaik, Bharat Regmi, Bandita Dash, Animesh Dutta, Pyrolysis kinetics of Sal (Shorea robusta) seeds, 2017, 7, 2190-6815, 237, 10.1007/s13399-017-0240-3 | |
4. | Bilqeesa Bhat, Bijender Kumar Bajaj, Hypocholesterolemic potential and bioactivity spectrum of an exopolysaccharide from a probiotic isolate Lactobacillus paracasei M7, 2019, 19, 22126198, 100191, 10.1016/j.bcdf.2019.100191 | |
5. | Q. Balme, M.T. Rozaini, F. Marias, F. Lemont, P. Charvin, J. Sedan, Modeling the Rate of Batch-Mode Thermal Degradation of Polyethylene Suspended in an Oven, 2020, 1877-2641, 10.1007/s12649-020-01304-x | |
6. | Adrian Knapczyk, Sławomir Francik, Marcin Jewiarz, Agnieszka Zawiślak, Renata Francik, Thermal Treatment of Biomass: A Bibliometric Analysis—The Torrefaction Case, 2020, 14, 1996-1073, 162, 10.3390/en14010162 | |
7. | Q. Balme, F. Lemont, F. Rousset, J. Sedan, P. Charvin, J. Bondroit, F. Marias, Design, calibration and testing of a new macro-thermogravimetric analyzer, 2018, 132, 1388-6150, 1439, 10.1007/s10973-018-7118-x | |
8. | Ranjan R. Pradhan, Rati R. Pradhan, Siddhanta Das, Brajesh Dubey, Animesh Dutta, 2017, Chapter 16, 978-981-10-3351-3, 231, 10.1007/978-981-10-3352-0_16 | |
9. | Korneliusz Wolski, Stefan Cichosz, Anna Masek, Surface hydrophobisation of lignocellulosic waste for the preparation of biothermoelastoplastic composites, 2019, 118, 00143057, 481, 10.1016/j.eurpolymj.2019.06.026 | |
10. | Hanqi Duan, Zhiqing Zhang, Md Maksudur Rahman, Xiaojuan Guo, Xingguang Zhang, Junmeng Cai, Insight into torrefaction of woody biomass: Kinetic modeling using pattern search method, 2020, 201, 03605442, 117648, 10.1016/j.energy.2020.117648 | |
11. | Yipeng Feng, Keying Qiu, Zhiping Zhang, Chong Li, Md. Maksudur Rahman, Junmeng Cai, Distributed activation energy model for lignocellulosic biomass torrefaction kinetics with combined heating program, 2022, 239, 03605442, 122228, 10.1016/j.energy.2021.122228 | |
12. | Udya Madhavi Aravindi Devaraja, Sachini Supunsala Senadheera, Duleeka Sandamali Gunarathne, Torrefaction severity and performance of Rubberwood and Gliricidia, 2022, 195, 09601481, 1341, 10.1016/j.renene.2022.06.109 | |
13. | Łukasz Sobol, Jacek Łyczko, Arkadiusz Dyjakon, Ryszard Sroczyński, Relationship between Odor Adsorption Ability and Physical–Hydraulic Properties of Torrefied Biomass: Initial Study, 2023, 16, 1996-1073, 1780, 10.3390/en16041780 | |
14. | Fatai Abiola Lateef, Helen Olayinka Ogunsuyi, Jatropha curcas L. biomass transformation via torrefaction: Surface chemical groups and morphological characterization, 2021, 4, 26660865, 100142, 10.1016/j.crgsc.2021.100142 | |
15. | Jun Sheng Teh, Yew Heng Teoh, Heoy Geok How, Farooq Sher, Thermal Analysis Technologies for Biomass Feedstocks: A State-of-the-Art Review, 2021, 9, 2227-9717, 1610, 10.3390/pr9091610 | |
16. | Adegoke Olaoluwa Adeniyi, Jude A. Okolie, 2025, 9780443138409, 103, 10.1016/B978-0-443-13840-9.00005-6 |
Temperature (°C) for 45 minutes | Biomass | Heating Rate °C /min | Environment | Mass Yield (%) | Energy Yield (%) | Energy Density (ratio) |
Miscanthus | Raw | 10 | Nitrogen | |||
200 | Torrefied | 10 | Nitrogen | 84.13 ± 2.0 | 93.12 ± 1.8 | 1.13 |
250 | Torrefied | 10 | Nitrogen | 73.35 ± 0.8 | 88.45 ± 1.4 | 1.24 |
275 | Torrefied | 10 | Nitrogen | 67.92 ± 1.3 | 74.36 ± 1.5 | 1.31 |
300 | Torrefied | 10 | Nitrogen | 58.44 ± 0.7 | 68.93 ± 1.3 | 1.55 |
Wheat Straw | Raw | 10 | Nitrogen | |||
200 | Torrefied | 10 | Nitrogen | 82.56 ± 1.8 | 98.56 ± 1.6 | 1.11 |
250 | Torrefied | 10 | Nitrogen | 70.25 ± 1.2 | 87.48 ± 1.5 | 1.20 |
275 | Torrefied | 10 | Nitrogen | 64.56 ± 1.0 | 72.25 ± 1.4 | 1.33 |
300 | Torrefied | 10 | Nitrogen | 54.83 ± 0.9 | 67.59 ± 1.7 | 1.39 |
Treatment Temperature (°C) 45 min | Biomass Type | Proximate Analysis (%) | Ultimate analyzer (%) | HHV MJ/kg | |||||||
VM | MC | Ash | FC | C | H | N | S | O | |||
Miscanthus | Raw | 83.96 | 5.47 | 1.79 | 7.56 | 46.66 | 6.00 | 0.21 | 0.00 | 45.34 | 18.47 |
200 °C | Torrefied | 82.21 | 2.01 | 2.01 | 11.64 | 48.16 | 5.81 | 0.15 | 0.00 | 43.87 | 19.82 |
250 °C | Torrefied | 80.84 | 1.20 | 3.24 | 12.72 | 49.31 | 5.50 | 0.12 | 0.00 | 41.83 | 20.66 |
275 °C | Torrefied | 78.82 | 0.95 | 3.99 | 14.24 | 52.12 | 5.35 | 0.10 | 0.00 | 38.44 | 22.67 |
300 °C | Torrefied | 74.17 | 0.73 | 4.58 | 18.52 | 55.33 | 5.22 | 0.10 | 0.00 | 34.77 | 24.86 |
Wheat Straw | Raw | 77.55 | 5.83 | 5.16 | 11.46 | 45.54 | 5.59 | 0.00 | 0.00 | 43.71 | 17.87 |
200 °C | Torrefied | 77.25 | 1.03 | 6.68 | 15.04 | 46.56 | 5.36 | 0.00 | 0.00 | 41.40 | 18.54 |
250 °C | Torrefied | 75.29 | 0.82 | 7.84 | 16.05 | 48.72 | 5.22 | 0.00 | 0.00 | 38.22 | 19.81 |
275 °C | Torrefied | 64.88 | 0.65 | 8.71 | 25.76 | 50.99 | 5.01 | 0.00 | 0.00 | 35.29 | 21.78 |
300 °C | Torrefied | 52.54 | 0.33 | 9.77 | 37.36 | 55.86 | 4.88 | 0.00 | 0.00 | 29.49 | 22.22 |
Feedstock | Lignocellulosic Biomass Composition (%) | Hot Water Extraction | Surface Area (g/m2) | ||
Hemicellulose | Cellulose | Lignin | |||
Miscanthus | |||||
Raw | 36.3 | 38.8 | 11.5 | 12.6 | 11.4 |
Torrefied at 275 °C 45 min | 14.2 | 35.5 | 41.7 | 6.8 | 14.2 |
Wheat Straw | |||||
Raw | 26.8 | 49.1 | 10.7 | 8.8 | 0.3 |
Torrefied at 275 °C 45 min | 17.7 | 36.6 | 38.2 | 5.1 | 3.2 |
a) Descriptive statistics for variables | |||||
Variable | Minimum value | Maximum value | Mean value | Standard dev. | |
T (K) | 448.15 | 548.15 | 498.15 | 31.02 | |
Y = Ln (derivative wt%/min/ 100) | -6.69 | -3.79 | -5.48 | 0.93 | |
X = Weight% /100 | 0.93 | 0.96 | 0.95 | 0.01 | |
b) Calculated Parameter values | |||||
Parameter | Miscanthus | Wheat Straw | |||
A (min-1) | 8.8 × 10³ | 1.2 × 10⁴ | |||
N | 0.88 | 0.91 | |||
E (kJ/mol) | 59.95 | 51.72 | |||
c) Analysis of variance | |||||
Source | DF | Sum of squares | Mean square | F-vlue | Prob (F) |
Regression | 2 | 16.25750 | 8.12875 | 161.51 | 0.00001 |
Error | 18 | 0.90594 | 0.05033 | ||
Total | 20 | 17.16344 |