While the convergence of sustainable finance and rapid technological innovation is changing the way portfolios are constructed, there is a lack of clear understanding of how risk moves between green bonds and high-growth technology assets, especially during periods of extreme volatility. In this study, we examined return spillovers among green bonds, major US technology equities, and AI/cybersecurity ETFs. We applied a novel Time-Varying Parameter Frequency Quantile VAR (TVP-FQVAR) framework, which decomposed connectedness across investment horizons and market states, capturing dynamics that traditional linear and static models cannot detect. We further employed SVM and XGBoost machine learning algorithms to forecast systemic connectedness using macro-financial indicators, including a novel gold-to-Bitcoin ratio. Three key findings appeared. First, overall system connectedness was high but concentrated in the short term, while long-run structural spillovers remained weak. Second, green bonds were consistently net receivers of shocks, acting as portfolio stabilizers, while technology and AI/cybersecurity ETFs were net transmitters. Third, our time-varying extension revealed that market distress (the lower return quantile) is characterized by substantial parameter instability: NVIDIA and Tesla emerged as the system's dominant net shock transmitters only once time variation was properly modeled, a dynamic concealed by static models. The strongest machine learning predictors of tail-risk connectedness were lagged VIX, inflation expectations, and the gold-to-Bitcoin ratio. These results carry direct implications for policymakers and investors looking to adopt dynamic, regime-aware hedging strategies in the rapidly evolving sustainable-tech financial landscape.
Citation: Mejri Sami, Arturo Leccadito. Time-Varying Tail connectedness between green bonds, US tech equities, and AI/Cybersecurity ETFs: A TVP-FQVAR and machine learning approach[J]. Green Finance, 2026, 8(4): 750-780. doi: 10.3934/GF.2026027
While the convergence of sustainable finance and rapid technological innovation is changing the way portfolios are constructed, there is a lack of clear understanding of how risk moves between green bonds and high-growth technology assets, especially during periods of extreme volatility. In this study, we examined return spillovers among green bonds, major US technology equities, and AI/cybersecurity ETFs. We applied a novel Time-Varying Parameter Frequency Quantile VAR (TVP-FQVAR) framework, which decomposed connectedness across investment horizons and market states, capturing dynamics that traditional linear and static models cannot detect. We further employed SVM and XGBoost machine learning algorithms to forecast systemic connectedness using macro-financial indicators, including a novel gold-to-Bitcoin ratio. Three key findings appeared. First, overall system connectedness was high but concentrated in the short term, while long-run structural spillovers remained weak. Second, green bonds were consistently net receivers of shocks, acting as portfolio stabilizers, while technology and AI/cybersecurity ETFs were net transmitters. Third, our time-varying extension revealed that market distress (the lower return quantile) is characterized by substantial parameter instability: NVIDIA and Tesla emerged as the system's dominant net shock transmitters only once time variation was properly modeled, a dynamic concealed by static models. The strongest machine learning predictors of tail-risk connectedness were lagged VIX, inflation expectations, and the gold-to-Bitcoin ratio. These results carry direct implications for policymakers and investors looking to adopt dynamic, regime-aware hedging strategies in the rapidly evolving sustainable-tech financial landscape.

| [1] |
Abdelmalek W, Khemakhem M (2025) Exploring the connectedness between green bonds and financial markets and its drivers during recent crises: New evidence from a TVP-VAR extended joint connectedness approach and wavelet coherence analysis. Int J Financ Econ 31: 2160-2179. https://doi.org/10.1002/ijfe.70035 doi: 10.1002/ijfe.70035
|
| [2] |
Ando T, Greenwood-Nimmo M, Shin Y (2022) Quantile connectedness: Modeling tail behavior in the topology of financial networks. Manage Sci 68: 2401–2431. https://doi.org/10.1287/mnsc.2021.3984 doi: 10.1287/mnsc.2021.3984
|
| [3] |
Antonakakis N, Chatziantoniou I, Gabauer D (2020) Refined measures of dynamic connectedness based on time-varying parameter vector autoregressions. J Risk Financ Manag 13: 84. https://doi.org/10.3390/jrfm13040084 doi: 10.3390/jrfm13040084
|
| [4] |
Ardia D, Bluteau K, Boudt K, et al. (2023) Climate change concerns and the performance of green vs. Brown stocks. Manage Sci 69: 7607–7632. https://doi.org/10.1287/mnsc.2022.4636 doi: 10.1287/mnsc.2022.4636
|
| [5] |
Aruoba SB, Diebold FX, Scotti C (2009) Real-time measurement of business conditions. J Bus Econ Stat 27: 417–427. https://doi.org/10.1198/jbes.2009.07205 doi: 10.1198/jbes.2009.07205
|
| [6] |
Baker SR, Bloom N, Davis SJ (2016) Measuring economic policy uncertainty. Q J Econ 131: 1593–1636. https://doi.org/10.1093/qje/qjw024 doi: 10.1093/qje/qjw024
|
| [7] |
Baruník J, Křehlík T (2018) Measuring the frequency dynamics of financial connectedness and systemic risk. J Financ Econom 16: 271–296. https://doi.org/10.1093/jjfinec/nby001 doi: 10.1093/jjfinec/nby001
|
| [8] |
Caldara D, Iacoviello M (2022) Measuring geopolitical risk. Am Econ Rev 112: 1194–1225. https://doi.org/10.1257/aer.20191823 doi: 10.1257/aer.20191823
|
| [9] |
Chatziantoniou I, Abakah EJA, Gabauer D, et al. (2022) Quantile time–frequency price connectedness between green bond, green equity, sustainable investments and clean energy markets. J Clean Prod 361: 132088. https://doi.org/10.1016/j.jclepro.2022.132088 doi: 10.1016/j.jclepro.2022.132088
|
| [10] |
Chen KS (2024) Interlinkages between Bitcoin, green financial assets, oil, and emerging stock markets. Data Sci Finance Econ 4: 160–187. https://doi.org/10.3934/dsfe.2024006 doi: 10.3934/dsfe.2024006
|
| [11] |
Diebold FX, Yilmaz K (2008) Measuring financial asset return and volatility spillovers, with application to global equity markets. Econ J 119: 158–171. https://doi.org/10.1111/j.1468-0297.2008.02208.x doi: 10.1111/j.1468-0297.2008.02208.x
|
| [12] |
Diebold FX, Yilmaz K (2012) Better to give than to receive: Predictive directional measurement of volatility spillovers. Int J Forecast 28: 57–66. https://doi.org/10.1016/j.ijforecast.2011.02.006 doi: 10.1016/j.ijforecast.2011.02.006
|
| [13] |
Ehlers T, Packer F (2017) Green bond finance and certification. BIS Quarterly Review. |
| [14] |
Estrella A, Mishkin F (1998) Predicting U. S. Recessions: Financial variables as leading indicators. Rev Econ Stat 80: 45–61. https://doi.org/10.1162/003465398557320 doi: 10.1162/003465398557320
|
| [15] |
Fama EF (1970) Efficient capital markets: A review of theory and empirical work. J Finance 25: 383–417. https://doi.org/10.2307/2325486 doi: 10.2307/2325486
|
| [16] |
Ferrer R, Shahzad SJH, Soriano P (2021) Are green bonds a different asset class? Evidence from time-frequency connectedness analysis. J Clean Prod 292: 125988. https://doi.org/10.1016/j.jclepro.2021.125988 doi: 10.1016/j.jclepro.2021.125988
|
| [17] |
Gilchrist S, Zakrajšek E (2012) Credit spreads and business cycle fluctuations. Am Econ Rev 102: 1692–1720. https://doi.org/10.1257/aer.102.4.1692 doi: 10.1257/aer.102.4.1692
|
| [18] |
Hoang D, Wiegratz K (2023) Machine learning methods in finance: Recent applications and prospects. Eur Financ Manag 29: 1657–1701. https://doi.org/10.1111/eufm.12408 doi: 10.1111/eufm.12408
|
| [19] |
Huynh TLD, Hille E, Nasir MA (2020) Diversification in the age of the 4th industrial revolution: The role of artificial intelligence, green bonds and cryptocurrencies. Technol Forecast Soc Change 159: 120188. https://doi.org/10.1016/j.techfore.2020.120188 doi: 10.1016/j.techfore.2020.120188
|
| [20] |
Kang H, Kwon M, Lee SG (2026) How the magnificent seven reshape market spillovers: TVP-VAR evidence. Financ Res Lett 101: 109942. https://doi.org/10.1016/j.frl.2026.109942 doi: 10.1016/j.frl.2026.109942
|
| [21] |
Ko PS, Chen KS (2025) Discovering AI tokens in the fractal markets hypothesis and their time-frequency co-movements with the leading high-carbon cryptocurrency. Data Sci Finance Econ 5: 293–319. https://doi.org/10.3934/dsfe.2025013 doi: 10.3934/dsfe.2025013
|
| [22] |
Koenker R, Bassett G (1978) Regression quantiles. Econometrica 46: 33. https://doi.org/10.2307/1913643 doi: 10.2307/1913643
|
| [23] |
Konstantakis KN, Koulmas P, Michaelides PG, et al. (2025) Green bonds & clean energy in sustainable finance: Evidence from DCC-GARCH connectedness. Int Rev Financ Anal 103: 104168. https://doi.org/10.1016/j.irfa.2025.104168 doi: 10.1016/j.irfa.2025.104168
|
| [24] |
Koop G, Korobilis D (2014) A new index of financial conditions. Eur Econ Rev 71: 101–116. https://doi.org/10.1016/j.euroecorev.2014.07.002 doi: 10.1016/j.euroecorev.2014.07.002
|
| [25] |
Lo AW (2004) The adaptive markets hypothesis: Market efficiency from an evolutionary perspective. J Portf Manag 30: 15–29. https://doi.org/10.3905/jpm.2004.442611 doi: 10.3905/jpm.2004.442611
|
| [26] |
Mensi W, Shafiullah M, Vo XV, et al. (2022) Spillovers and connectedness between green bond and stock markets in bearish and bullish market scenarios. Financ Res Lett 49: 103120. https://doi.org/10.1016/j.frl.2022.103120 doi: 10.1016/j.frl.2022.103120
|
| [27] |
Naeem MA, Conlon T, Cotter J (2022) Green bonds and other assets: Evidence from extreme risk transmission. J Environ Manage 305: 114358. https://doi.org/10.1016/j.jenvman.2021.114358 doi: 10.1016/j.jenvman.2021.114358
|
| [28] |
Pham L, Nguyen CP (2021) Asymmetric tail dependence between green bonds and other asset classes. Glob Financ J 50: 100669. https://doi.org/10.1016/j.gfj.2021.100669 doi: 10.1016/j.gfj.2021.100669
|
| [29] |
Reboredo JC (2018) Green bond and financial markets: Co-movement, diversification and price spillover effects. Energy Econ 74: 38–50. https://doi.org/10.1016/j.eneco.2018.05.030 doi: 10.1016/j.eneco.2018.05.030
|
| [30] |
Rundo F, Trenta F, Stallo AL di, et al. (2019) Machine learning for quantitative finance applications: A survey. Appl Sci 9: 5574. https://doi.org/10.3390/app9245574 doi: 10.3390/app9245574
|
| [31] |
Sim N, Zhou H (2015) Oil prices, US stock return, and the dependence between their quantiles. J Bank Financ 55: 1–8. https://doi.org/10.1016/j.jbankfin.2015.01.013 doi: 10.1016/j.jbankfin.2015.01.013
|
| [32] |
Tu Z, Yang R, Yang C (2024) Dynamics between FinTech and financial market: Supply-driven or demand-guided? Quant Finance Econ 8: 658–677. https://doi.org/10.3934/qfe.2024025. doi: 10.3934/qfe.2024025
|
| [33] |
Tunc A (2024) ETFs amidst the COVID-induced technological transformation: Sectoral insights from time-varying dynamics of tail risk transmissions. N Am J Econ Financ 74: 102243. https://doi.org/10.1016/j.najef.2024.102243 doi: 10.1016/j.najef.2024.102243
|
| [34] |
Urom C (2023) Time–frequency dependence and connectedness between financial technology and green assets. Int Econ 175: 139–157. https://doi.org/10.1016/j.inteco.2023.06.004 doi: 10.1016/j.inteco.2023.06.004
|
| [35] |
Wei P, Yuan K, Ren X, et al. (2023) Time-varying spillover networks of green bond and related financial markets. Int Rev Econ Financ 88: 298–317. https://doi.org/10.1016/j.iref.2023.06.022 doi: 10.1016/j.iref.2023.06.022
|
| [36] |
Xu D, Hu Y, Corbet S, et al. (2024) Green bonds and traditional and emerging investments: Understanding connectedness during crises. N Am J Econ Financ 72: 102142. https://doi.org/10.1016/j.najef.2024.102142 doi: 10.1016/j.najef.2024.102142
|
 GF-08-04-027-s001.pdf |
 |
Figures(4) / Tables(11)

Mejri Sami, Arturo Leccadito. Time-Varying Tail connectedness between green bonds, US tech equities, and AI/Cybersecurity ETFs: A TVP-FQVAR and machine learning approach[J]. Green Finance, 2026, 8(4): 750-780. doi: 10.3934/GF.2026027

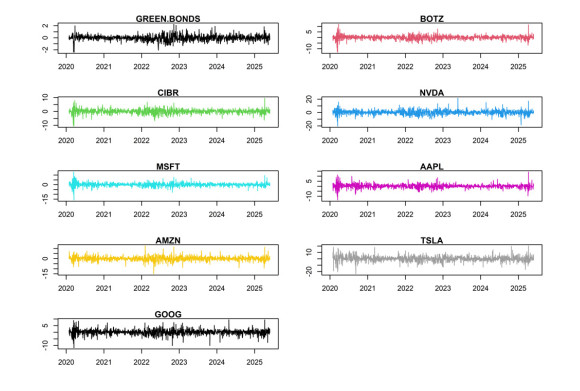
Time Series Plots, returns × 100
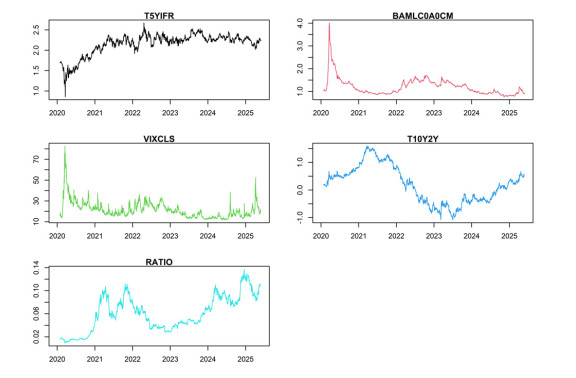
Time Series Plots, explanatory variables
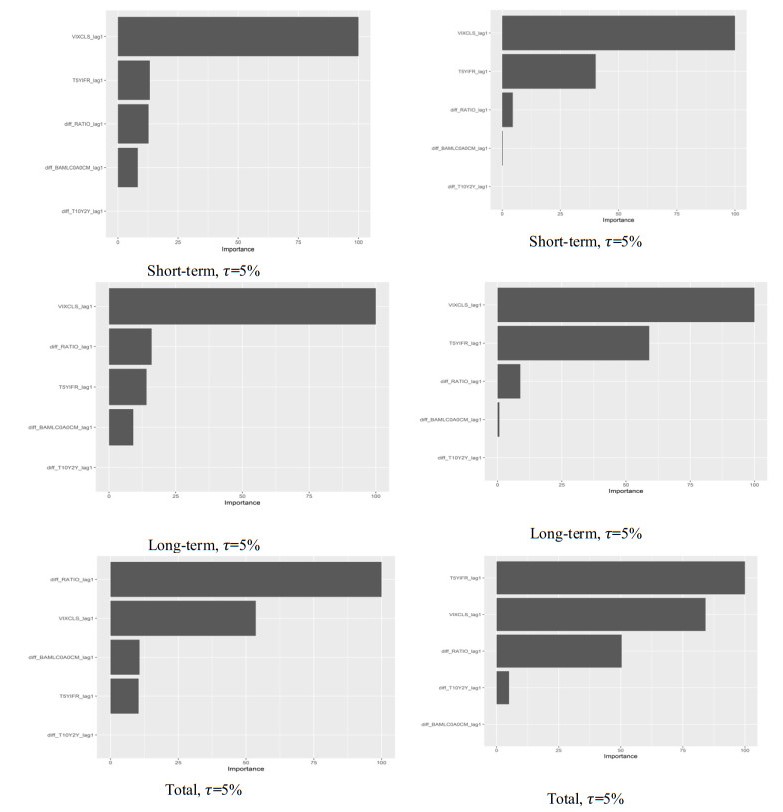
Feature Importance Plots for SVM (left) and XGBoost (right), lower quantile (τ = 5%)
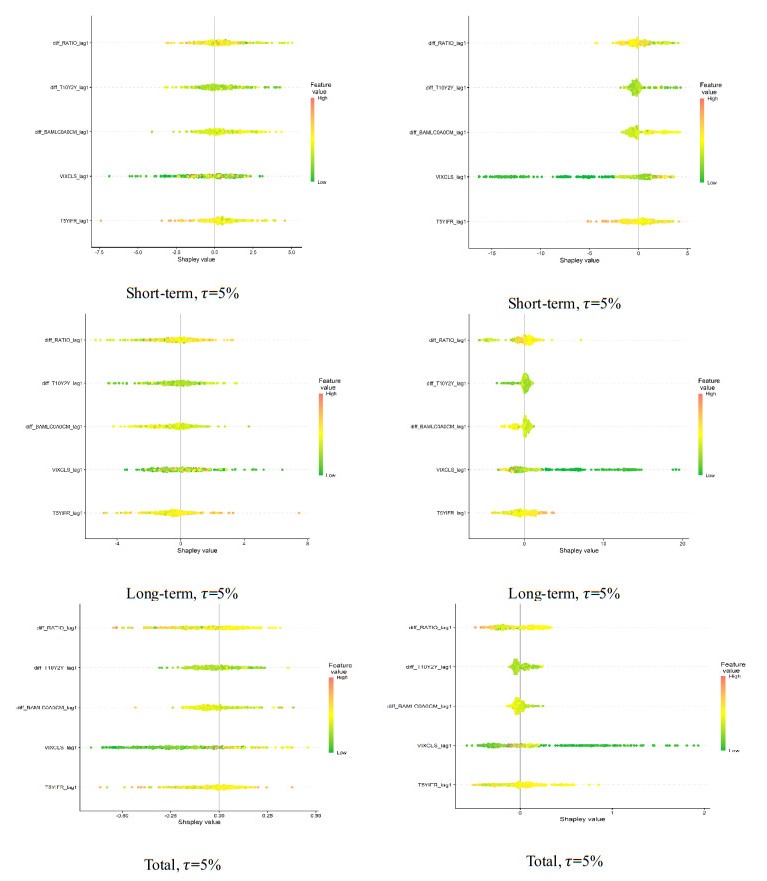
Shapley plots for SVM (left) and XGBoost (right), lower quantile (τ = 5%)




 DownLoad: