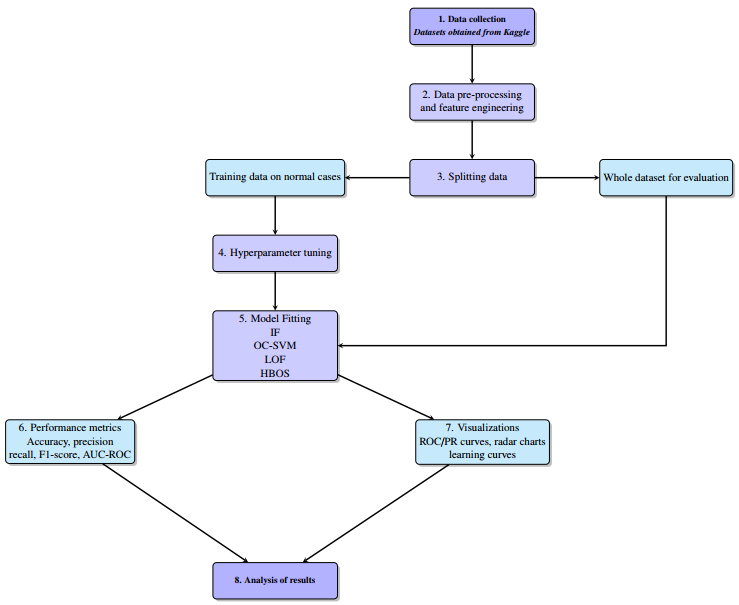
Unsupervised anomaly detection is pivotal for identifying rare events in imbalanced datasets, such as credit card fraud and customer churn, where labeled anomalies are scarce. This study benchmarks four prominent algorithms such as isolation forest (IF), one-class support vector machine (OC-SVM), local outlier factor (LOF), and histogram-based outlier score (HBOS) using Kaggle datasets, a fraud dataset with 9.41% contamination (11,335 transactions) and a churn dataset with 20.37% (10,000 records). Models were trained exclusively on normal-class data, with features preprocessed via standardization, one-hot encoding, and principal component analysis (PCA) for dimensionality reduction. Evaluation employed imbalance-robust metrics (precision, recall, F1-score, area under a receiver operating characteristic curve (AUC-ROC)) and visualizations (confusion matrices, precision-recall (PR) curves, radar charts, learning curves).
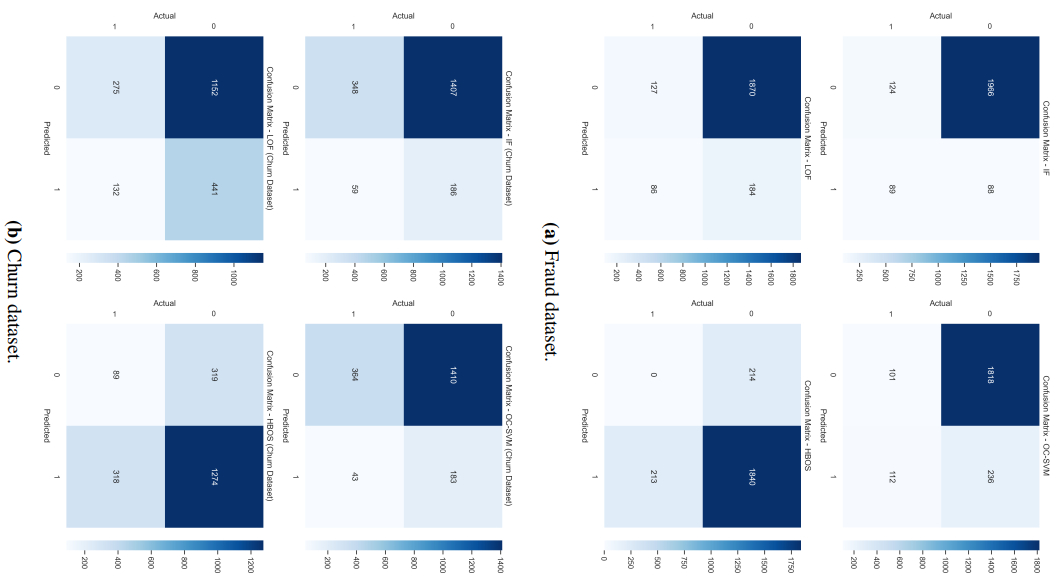
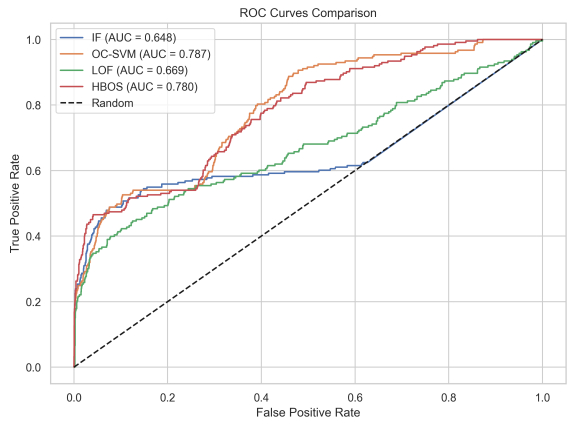
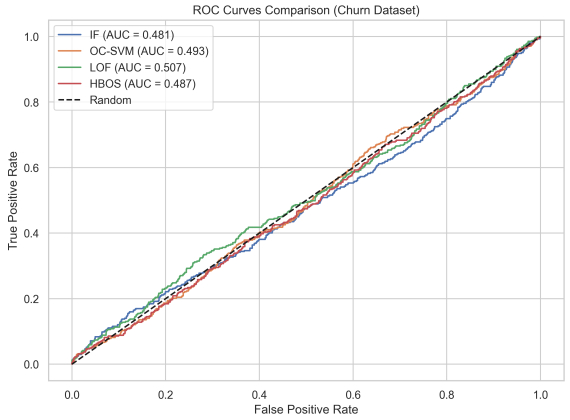
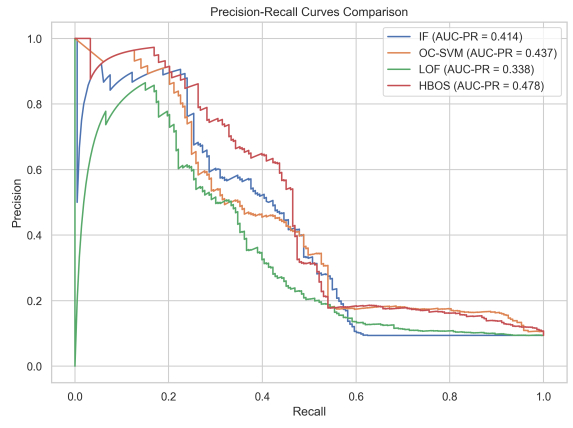
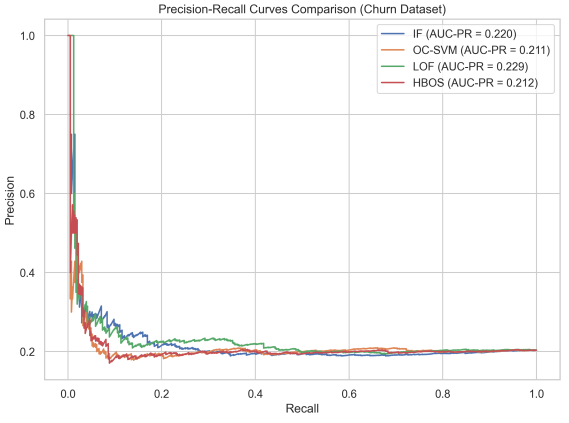
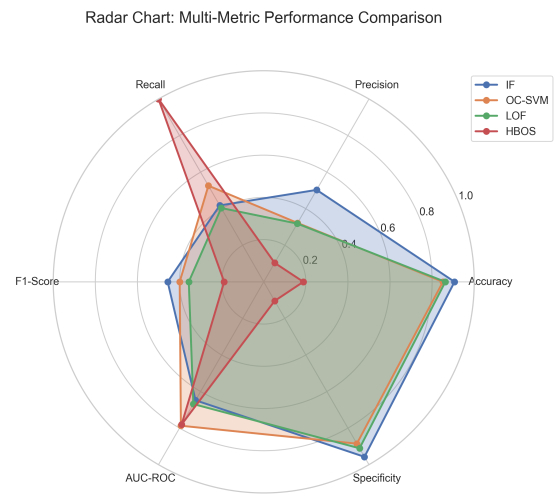
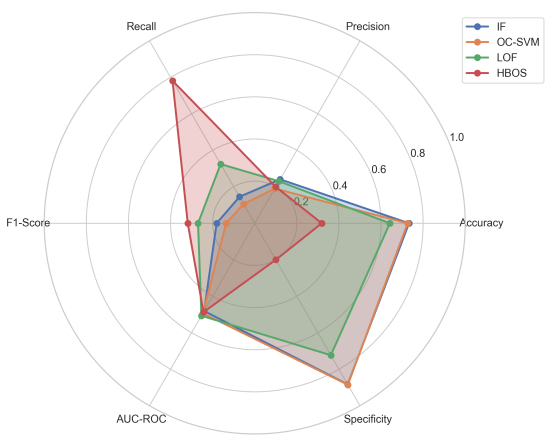
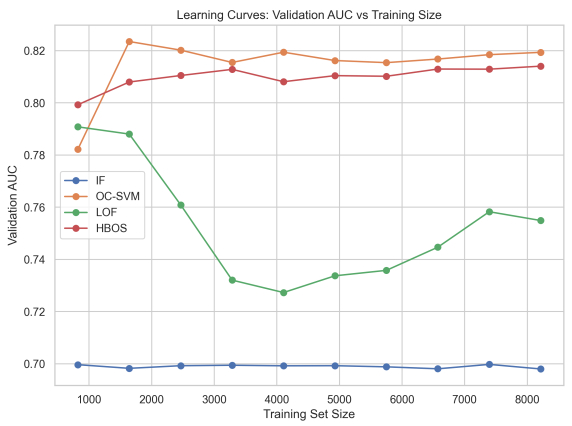
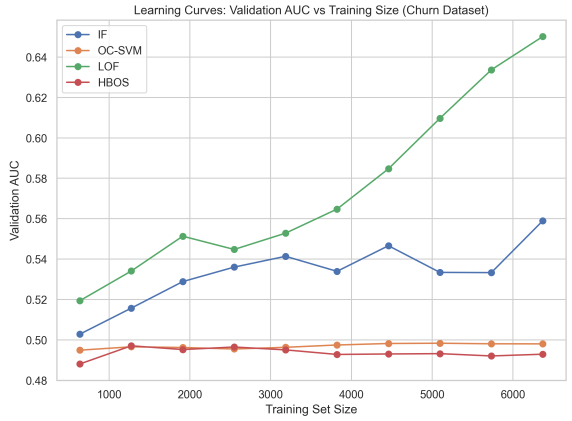
Results reveal superior performance on fraud, with OC-SVM achieving the highest AUC-ROC (0.7871) and HBOS near-perfect recall (0.9989), albeit at low precision (0.1038). IF offered balanced accuracy (0.9065) and F1 (0.4564). On churn, efficacy waned (AUC-ROC 0.5001–0.5709), with IF leading in accuracy (0.7435) and LOF in F1 (0.2694), underscoring noise and higher contamination challenges. Learning curves indicated rapid convergence in fraud (plateau at 0.82 AUC) versus data-hungry LOF gains in churn (to 0.62).
This work contributes a unified benchmarking framework, empirical evidence of method data interactions, and deployment guidelines, such as HBOS for high-recall fraud screening and LOF for churn refinement, and advancing scalable anomaly detection in finance and telecom.
Citation: Faith Mabushe, Lindani Dube. Application of unsupervised anomaly detection models for rare event identification in imbalanced datasets[J]. Data Science in Finance and Economics, 2026, 6(4): 533-566. doi: 10.3934/DSFE.2026019
Unsupervised anomaly detection is pivotal for identifying rare events in imbalanced datasets, such as credit card fraud and customer churn, where labeled anomalies are scarce. This study benchmarks four prominent algorithms such as isolation forest (IF), one-class support vector machine (OC-SVM), local outlier factor (LOF), and histogram-based outlier score (HBOS) using Kaggle datasets, a fraud dataset with 9.41% contamination (11,335 transactions) and a churn dataset with 20.37% (10,000 records). Models were trained exclusively on normal-class data, with features preprocessed via standardization, one-hot encoding, and principal component analysis (PCA) for dimensionality reduction. Evaluation employed imbalance-robust metrics (precision, recall, F1-score, area under a receiver operating characteristic curve (AUC-ROC)) and visualizations (confusion matrices, precision-recall (PR) curves, radar charts, learning curves).
Results reveal superior performance on fraud, with OC-SVM achieving the highest AUC-ROC (0.7871) and HBOS near-perfect recall (0.9989), albeit at low precision (0.1038). IF offered balanced accuracy (0.9065) and F1 (0.4564). On churn, efficacy waned (AUC-ROC 0.5001–0.5709), with IF leading in accuracy (0.7435) and LOF in F1 (0.2694), underscoring noise and higher contamination challenges. Learning curves indicated rapid convergence in fraud (plateau at 0.82 AUC) versus data-hungry LOF gains in churn (to 0.62).
This work contributes a unified benchmarking framework, empirical evidence of method data interactions, and deployment guidelines, such as HBOS for high-recall fraud screening and LOF for churn refinement, and advancing scalable anomaly detection in finance and telecom.

| [1] |
Abdi H, Williams LJ (2010) Principal component analysis. Wires Comput Stat 2: 433–459. https://doi.org/10.1002/wics.101 doi: 10.1002/wics.101

|
| [2] |
Adnan M, Alarood AAS, Uddin MI, et al. (2022) Utilizing grid search cross-validation with adaptive boosting for augmenting performance of machine learning models. PeerJ Comput Sci 8: e803. https://doi.org/10.7717/PEERJ-CS.803 doi: 10.7717/PEERJ-CS.803
|
| [3] | Aggarwal CC (2017) Outlier Analysis. Springer, Cham, Switzerland, 2nd edition. |
| [4] | Aggarwal CC, Hinneburg A, Keim DA (2001) On the surprising behavior of distance metrics in high dimensional space. In: International Conference on Database Theory, 420–434. Springer. https://doi.org/10.1007/3-540-44503-X_27 |
| [5] | Bishop CM (2006) Pattern Recognition and Machine Learning. Springer, New York. Available from: https://link.springer.com/in/book/9780387310732. |
| [6] | Breunig MM, Kriegel HP, Ng RT, et al. (2000) Lof: Identifying density-based local outliers. In: Proceedings of the 2000 ACM SIGMOD International Conference on Management of Data, 93–104. ACM. https://doi.org/10.1145/335191.33538 |
| [7] | Brown J, Smith A, Johnson M (2022) Evaluating classification metrics for imbalanced datasets. J Data Sci 20. |
| [8] | CG SG, Sumathi B (2020) Grid search tuning of hyperparameters in random forest classifier for customer feedback sentiment prediction. Int J Adv Comput Sci Appl 11. https://doi.org/10.14569/IJACSA.2020.0110920 |
| [9] | Chen Y, Qian J, Saligrama V (2013) A new one-class svm for anomaly detection. In: 2013 IEEE International Conference on Acoustics, Speech and Signal Processing, 3567–3571. https://doi.org10.1109/ICASSP.2013.6638322 |
| [10] | Favuzzi GL (2019) Deep-fake review detection. |
| [11] | Federal Trade Commission (2024) As nationwide fraud losses top fanxiexian_myfh10 billion in 2023, ftc steps up efforts to protect the public. Available from: https://www.ftc.gov/news-events/news/press-releases/2024/02/nationwide-fraud-losses-top-10-billion-2023-ftc-steps-efforts-protect-public. Press release. |
| [12] | Goldstein M, Dengel A (2012a) Histogram-based outlier score (hbos): A fast unsupervised anomaly detection algorithm. KI-2012: Poster and Demo Track 1: 59–63. |
| [13] | Goldstein M, Dengel A (2012b) Histogram-based outlier score (hbos): A fast unsupervised anomaly detection algorithm. In: KI-2012: Advances in Artificial Intelligence, volume 7526 of Lecture Notes in Computer Science, 59–63. Springer. |
| [14] | Han J, Kamber M, Pei J (2011) Data Mining: Concepts and Techniques. Morgan Kaufmann, Burlington, MA, 3rd edition. |
| [15] | Hastie T, Tibshirani R, Friedman J (2017) The Elements of Statistical Learning: Data Mining, Inference, and Prediction. Springer, 12th printing edition. |
| [16] |
Hejazi M, Singh YP (2013) One-class support vector machines approach to anomaly detection. Appl Artif Intell 27: 351–366. https://doi.org/10.1080/08839514.2013.785791 doi: 10.1080/08839514.2013.785791
|
| [17] |
Lesouple J, Baudoin C, Spigai M, et al. (2021) Generalized isolation forest for anomaly detection. Pattern Recogn Lett 149: 109–119. https://doi.org/10.1016/j.patrec.2021.05.022 doi: 10.1016/j.patrec.2021.05.022
|
| [18] | Li KL, Huang HK, Tian SF, et al. (2003) Improving one-class svm for anomaly detection. In: Proceedings of the 2003 International Conference on Machine Learning and Cybernetics (IEEE Cat. No. 03EX693), 5: 3077–3081. https://doi.org/10.1109/ICMLC.2003.1260106 |
| [19] | Liu FT, Ting KM, Zhou ZH (2008) Isolation forest. In: 2008 Eighth IEEE International Conference on Data Mining, 413–422. https://doi.org/10.1109/ICDM.2008.17 |
| [20] | Lundberg SM, Lee SI (2017) A unified approach to interpreting model predictions. Adv Neural Inf Process Syst 30. |
| [21] | Miao X, Liu Y, Zhao H, et al. (2018) Distributed online one-class support vector machine for anomaly detection over networks. Ieee T Cybernetics 49: 1475–1488. |
| [22] | Müller KR, Mika S, Rätsch G, et al. (2001) An introduction to kernel-based learning algorithms. In: Ieee T Neural Networks, 12: 181–201. https://doi.org/10.1109/72.914517 |
| [23] |
Pareek A, Arora P, Madan S, et al. (2024) Telecom customer churn prediction model: Analysis of machine learning techniques for churn prediction and factor identification in the telecom sector. J Inf Optim Sci 45: 613–630. https://doi.org/10.47974/JIOS-1599 doi: 10.47974/JIOS-1599
|
| [24] |
Paulauskas N, Bagdonas AF (2015) Local outlier factor use for the network flow anomaly detection. Secur Commun Networks 8: 4203–4212. https://doi.org/10.1002/sec.1335 doi: 10.1002/sec.1335
|
| [25] |
Paulauskas N, Baskys A (2019) Application of histogram-based outlier scores to detect computer network anomalies. Electronics 8: 1251. https://doi.org/10.3390/electronics8111251 doi: 10.3390/electronics8111251
|
| [26] | Pedregosa F, Varoquaux G, Gramfort A, et al. (2011) Scikit-learn: Machine learning in python. J Mach Learn Res 12: 2825–2830. |
| [27] |
Ringnér M (2008) What is principal component analysis? Nat Biotechnol 26: 303–304. https://doi.org/10.1038/nbt0308-303 doi: 10.1038/nbt0308-303
|
| [28] | Saito T, Rehmsmeier M (2015) The precision-recall plot is more informative than the roc plot when evaluating binary classifiers on imbalanced datasets. PLoS ONE 10: e0118432. |
| [29] | Schölkopf B, Smola AJ (2002) Learning with Kernels: Support Vector Machines, Regularization, Optimization, and Beyond. MIT Press. |
| [30] | Su J, Jiang C, Jin X, et al. (2024) Large language models for forecasting and anomaly detection: A systematic literature review. arXiv preprint arXiv: 2402.10350. |
| [31] | Xu D, Wang Y, Meng Y, et al. (2017) An improved data anomaly detection method based on isolation forest. In: 2017 10th International Symposium on Computational Intelligence and Design (ISCID) 2: 287–291. https://doi.org/10.1109/ISCID.2017.202 |
| [32] |
Xu H, Pang G, Wang Y, et al. (2023) Deep isolation forest for anomaly detection. Ieee T Knowl Data Eng 35: 12591–12604. https://doi.org/10.1109/TKDE.2023.3270293 doi: 10.1109/TKDE.2023.3270293
|
| [33] |
Xu L, Yeh YR, Lee YJ, et al. (2013) A hierarchical framework using approximated local outlier factor for efficient anomaly detection. Procedia Comput Sci 19: 1174–1181. https://doi.org/10.1016/j.procs.2013.06.168 doi: 10.1016/j.procs.2013.06.168
|
Figures(10) / Tables(5)
Faith Mabushe, Lindani Dube. Application of unsupervised anomaly detection models for rare event identification in imbalanced datasets[J]. Data Science in Finance and Economics, 2026, 6(4): 533-566. doi: 10.3934/DSFE.2026019





 DownLoad: