Review

Electrospun biodegradable polymers loaded with bactericide agents

  • Development of materials with an antimicrobial activity is fundamental for different sectors, including medicine and health care, water and air treatment, and food packaging. Electrospinning is a versatile and economic technique that allows the incorporation of different natural, industrial, and clinical agents into a wide variety of polymers and blends in the form of micro/nanofibers. Furthermore, the technique is versatile since different constructs (e.g. those derived from single electrospinning, co-electrospinning, coaxial electrospinning, and miniemulsion electrospinning) can be obtained to influence the ability to load agents with different characteristics and stability and to modify the release behaviour. Furthermore, antimicrobial agents can be loaded during the electrospinning process or by a subsequent coating process. In order to the mitigate burst release effect, it is possible to encapsulate the selected drug into inorganic nanotubes and nanoparticles, as well as in organic cyclodextrine polysaccharides. In the same way, processes that involve covalent linkage of bactericide agents during surface treatment of electrospun samples may also be considered.
    The present review is focused on more recent works concerning the electrospinning of antimicrobial polymers. These include chitosan and common biodegradable polymers with activity caused by the specific load of agents such as metal and metal oxide particles, quaternary ammonium compounds, hydantoin compounds, antibiotics, common organic bactericides, and bacteriophages.

    Citation: Luís J. del Valle, Lourdes Franco, Ramaz Katsarava, Jordi Puiggalí. Electrospun biodegradable polymers loaded with bactericide agents[J]. AIMS Molecular Science, 2016, 3(1): 52-87. doi: 10.3934/molsci.2016.1.52

    Related Papers:

    [1] Robert Stephen Cantrell, Brian Coomes, Yifan Sha . A tridiagonal patch model of bacteria inhabiting a Nanofabricated landscape. Mathematical Biosciences and Engineering, 2017, 14(4): 953-973. doi: 10.3934/mbe.2017050
    [2] Massimo Fioranelli, Hijaz Ahmad, Alireza Sepehri, Maria Grazia Roccia, Faissal Aziz . A mathematical model for imaging and killing cancer cells by using concepts of the Warburg effect in designing a Graphene system. Mathematical Biosciences and Engineering, 2022, 19(3): 2985-2995. doi: 10.3934/mbe.2022137
    [3] Marie Doumic, Sophie Hecht, Diane Peurichard . A purely mechanical model with asymmetric features for early morphogenesis of rod-shaped bacteria micro-colony. Mathematical Biosciences and Engineering, 2020, 17(6): 6873-6908. doi: 10.3934/mbe.2020356
    [4] Harry J. Dudley, Zhiyong Jason Ren, David M. Bortz . Competitive exclusion in a DAE model for microbial electrolysis cells. Mathematical Biosciences and Engineering, 2020, 17(5): 6217-6239. doi: 10.3934/mbe.2020329
    [5] Alma Mašić, Hermann J. Eberl . On optimization of substrate removal in a bioreactor with wall attached and suspended bacteria. Mathematical Biosciences and Engineering, 2014, 11(5): 1139-1166. doi: 10.3934/mbe.2014.11.1139
    [6] Agustín Gabriel Yabo, Jean-Baptiste Caillau, Jean-Luc Gouzé . Optimal bacterial resource allocation: metabolite production in continuous bioreactors. Mathematical Biosciences and Engineering, 2020, 17(6): 7074-7100. doi: 10.3934/mbe.2020364
    [7] Fabiana Russo, Alberto Tenore, Maria Rosaria Mattei, Luigi Frunzo . Multiscale modelling of the start-up process of anammox-based granular reactors. Mathematical Biosciences and Engineering, 2022, 19(10): 10374-10406. doi: 10.3934/mbe.2022486
    [8] Hermann Mena, Lena-Maria Pfurtscheller, Jhoana P. Romero-Leiton . Random perturbations in a mathematical model of bacterial resistance: Analysis and optimal control. Mathematical Biosciences and Engineering, 2020, 17(5): 4477-4499. doi: 10.3934/mbe.2020247
    [9] Gonzalo Robledo . Feedback stabilization for a chemostat with delayed output. Mathematical Biosciences and Engineering, 2009, 6(3): 629-647. doi: 10.3934/mbe.2009.6.629
    [10] Mudassar Imran, Hal L. Smith . A model of optimal dosing of antibiotic treatment in biofilm. Mathematical Biosciences and Engineering, 2014, 11(3): 547-571. doi: 10.3934/mbe.2014.11.547
  • Development of materials with an antimicrobial activity is fundamental for different sectors, including medicine and health care, water and air treatment, and food packaging. Electrospinning is a versatile and economic technique that allows the incorporation of different natural, industrial, and clinical agents into a wide variety of polymers and blends in the form of micro/nanofibers. Furthermore, the technique is versatile since different constructs (e.g. those derived from single electrospinning, co-electrospinning, coaxial electrospinning, and miniemulsion electrospinning) can be obtained to influence the ability to load agents with different characteristics and stability and to modify the release behaviour. Furthermore, antimicrobial agents can be loaded during the electrospinning process or by a subsequent coating process. In order to the mitigate burst release effect, it is possible to encapsulate the selected drug into inorganic nanotubes and nanoparticles, as well as in organic cyclodextrine polysaccharides. In the same way, processes that involve covalent linkage of bactericide agents during surface treatment of electrospun samples may also be considered.
    The present review is focused on more recent works concerning the electrospinning of antimicrobial polymers. These include chitosan and common biodegradable polymers with activity caused by the specific load of agents such as metal and metal oxide particles, quaternary ammonium compounds, hydantoin compounds, antibiotics, common organic bactericides, and bacteriophages.


    Nutrients and substrates play a pivotal role in the sustenance and proliferation of living organisms, and therefore, evolutionary forces have constrained organisms to detect their availability. Cells reproduce quickly in a nutrient and substrate-rich environment and reduce proliferation when those resources become scarce. Availability of both energy rich substrates and starting materials for biomass production control this balance of growth and starvation [41].

    Energy is produced in heterotrophic organisms by degrading organic compounds into products with low free energy. As per the second law of thermodynamics, no process can be fully efficient. So, a part of the free energy is used up to drive the reaction itself and the rest is stored into ATPs, the cell's energy currency. When more than one process is available for such conversions, there usually occurs a trade-off between rate (kinetic efficiency) versus yield (thermodynamic efficiency). This is true for fermentation and oxidative phosphorylation (OP) [34].

    Fermentation yields 2-4 moles of ATP per mole of glucose whereas OP produces about 30 ATPs (the actual number may vary with the organism). In contrast, the rate of fermentation can reach about two orders of magnitude higher than the rate of OP [34,44].

    Many organisms can utilize both pathways in the presence of oxygen and substrate [26], but OP is not feasible in the absence of oxygen. A direct consequence of this is seen in a phenomenon, first observed in cancer cells [45], called the Warburg effect, where cells utilize the fermentation pathways much more than the OP in presence of ample substrate and even oxygen [34]. A similar phenomenon can be seen across a broad range of cell types and organisms. Many yeast variants (in which the same phenomenon is called the Crabtree effect [7]) and bacteria (where it is called overflow metabolism [1]) exhibit this behavior. Other than the cells undergoing growth, lymphocytes and Kupffer cells (upon activation), fast twitch muscle fibers and microglial cells, also display this effect in the human body [34,41]. Most of the work on the Warburg effect has been concentrated on cancer cells, and for bacterial metabolism, the phenomenon has been well studied in Escherichia coli [49].

    This behavior can appear to be paradoxical in that a less efficient pathway is utilized even when a more efficient one is available. Given that substrate limitation is a major environmental constraint, the properties of these two pathways must have been under intense selection. Such a behavior, therefore, should confer some additional biological advantage, and a number of explanations and modeling frameworks have been suggested accordingly [34].

    Several game theory models have been proposed describing a population using a common resource (glucose in most cases), and the two metabolic pathways (i.e., OP and fermentation) as alternate strategies based on a kinetic-thermodynamic trade-off. A tragedy of the commons scenario sometimes emerges [16,26]. Prisoner's dilemma and Nash equilibria (based on relative enzymatic/protein costs of the two pathways) were also used to describe the dynamics of this system [13,34].

    For a similar trade-off between investment in protein synthesis and metabolic yield, a medium-scale kinetic model has also been proposed [22]. Such a model explains the increase in ribosomal content observed with increasing growth rate and related characteristics in bacteria [34].

    Another family of models that has been used extensively to explain this behavior belongs to a framework called Flux Balance analysis (FBA) [10,28,32]. In such an analysis, linear maximization is utilized to determine optimal values of reaction rates at a steady state condition where a linear combination of rates attain a maximized value. There has been some controversy on whether the criterion for optimality should be based on rate or yield in these models [34]. A branch-off from this family of models, called FBA with macromolecular crowding (FBAwmc), incorporates the areal and volumetric needs of the enzymes constrained by the cell membrane space and cytoplasm, respectively [49]. Some studies looked at maximization of biomass production using this framework [37].

    Some of the models discussed above focus on one specific behavior seen in the Warburg effect but avoid other behaviors that are part of the same process, thus preventing study of interactions among the observed behaviors. Among notable ones, Pfeiffer et al. [26] use the rate-efficiency trade-off to explore the problem and delve into origins of multicellularity. Kareva [16] uses efficiency of the two pathways (respiration and fermentation) and the effect of lactic acid produced from fermenting cells, on neighbouring cells but it looks at cancer cells in specific.

    In many other cases, the work utilizes more than one trade-offs, especially using the FBA regime [3,34,37,42,49]. Vazquez et al. [42] focuses on cancer cells, and uses constraints on maximal glucose uptake, enzyme efficiency and total cellular volume, in order to maximize ATP production. Their model considers not only the stoichiometry of glycolysis and oxidative phosphyrylation but also the enzyme-volumetric costs of activating these pathways. A comparable idea of constraints on enzyme-volumetric costs was used in a work focusing on Escherichia coli to explain overflow metabolism [3]. Yet another work which used a similar concept was that of Shlomi et al. [37], which focuses on cancer cells in specific. For this class of models, a consistent criticism has been that, despite its overwhelming success, these models fail to explain overflow metabolism from first principles, that is, without imposing multiple measured fluxes as constraints on the models [22]. In comparison, a slightly different approach was taken in the work by Molenaar et al. [22], where they focus on trade-offs between investments in enzyme synthesis and metabolic yields for different catabolic pathways, in order to maximize growth rate. Zhuang et al. [49] uses the constraint on membrane occupancy to explore the effects on fermentation and respiration, via a transformed FBA.

    Given this large body of work on modeling the Warburg effect, yet another model may seem to be a futile exercise, but if one looks closely, most of the models either focus on cancer cells or dive only into the biochemical aspect of the problem. This leaves the ecological implications of the Warburg effect to be modeled, specifically in bacteria. None of the models discussed above take into account the effects associated with size and shape of the bacterial cell on the overall metabolism of the organism, especially considering the wide variability in both those physical characteristics. Moreover, predicting overflow metabolism from first principles has always been a challenge without invoking a large number of boundary conditions [22].

    In this work, we attend to the three major trade-offs involved in the Warburg effect, specifically in the case of a bacterial cell. We seek to incorporate only the necessary details, both from a physical and a biochemical viewpoint, to retain model simplicity and usability in an ecological context (Table 1).

    Table 1.  Trade-offs involved in Warburg effect.
    Trade-offs involved in a bacterial cell in the Warburg EffectSeen in
    1. Yield versus rate:
    Fermentation yields about 2-4 moles of ATP per mole of glucose whereas OP produces about 30 ATPs. However, rates of fermentation can reach about two orders of magnitude higher than that of OP [34,44]
    .
    Game theory models [16,26]
    2. Surface area versus volume:
    The enzymes responsible for OP are located on the cell surface whereas those for fermentation are in the cytoplasm
    .
    FBAwmc [49]
    3. Biomass production trade-off:
    Fermentation facilitates biomass generation [41]
    .
    FBA and related models [37]

     | Show Table
    DownLoad: CSV

    Our aim here is to predict size and shape dependence of growth rate in bacteria across a range of substrate concentrations, in addition to estimating the proportions of OP and fermentation (hereafter denoted AG, for aerobic glycolysis in presence of oxygen) for respiration and metabolism. We also seek to explain overflow metabolism in our model as a direct consequence of energy production and consumption trade-off, through first principles. Unlike the previous models on the Warburg effect, we explore more of the ecological ramifications though the model, in addition to the basic biochemical effects. In turn, we limit ourselves to a single bacterial cell as the model system and glucose as the substrate.

    The model assumes a bacterial cell, with glucose transporter proteins (responsible for importing glucose into the cell) and cytochrome oxidase enzymes (where OP occurs) embedded in the cell membrane as trans-membrane proteins [49]. In contrast, the (upper) glycolytic enzymes, which convert glucose to pyruvate, and the fermentation enzyme pathways function in the cytoplasm [34]. Thus OP should scale as a function of the surface area of the cell whereas fermentation processes should scale as a function of cell volume. A schematic representation of the model is illustrated in Figure 1.

    Figure 1.  A simplified representation of the model. The external glucose is imported into the bacterial call via glucose transporters located on the cell membrane at a rate $r_0$. This glucose is utilized by upper glycolysis pathways to convert it to pyruvate at a rate $r_1$. This converted substrate is then divided into two paths: either to OP (at a rate $r_2$ at the cytochrome oxidase located in the membrane) or to fermentation/aerobic glycolysis (AG) (at a rate $r_3$ at the fermentation enzyme sites located in the cytoplasm). Note that only the substrate used in the latter shunt goes into biomass production whereas substrate used in OP is lost as $CO_2$.

    The rate of glucose input into the cell ($r_0$) can be represented as,

    $ r0(t)=dGcell(t)dt=β(t)A(acell)kβG0(r,t)
    $
    (1)

    where t is time, r is position, $G_{cell}$ is the cellular concentration glucose, $G_0$ is the concentration of glucose in the environment around the cell, $\beta$ is the areal density of glucose transporter sites on the cell membrane, A is area of the cell membrane (as a function of the semi-major axis of the cell, $a_{cell}$), and $k_\beta$ is normalized efficiency of the transporters (we define normalized efficiency as the ratio of molecules transported relative to the total number present on the outer/source side per unit time). We assume a uniform $G_0$ in the environment around the cell here and therefore, inside it ($G_{cell}$).

    This glucose imported into the cell goes into the upper glycolysis pathway, whose enzymes are located in the bacterial cytoplasm. In bacteria, there are two well known pathways for this: Embden-Meyerhof-Parnas (EMP) pathway and Entner-Doudoroff (ED) pathway, which differ in both their output of ATP (2 mol in EMP versus 1 mol in ED for every mol of glucose consumed) and their enzyme costs (the EMP enzyme costs can be 3.5 to 5 fold higher than ED pathway enzymes) [11]. The end product is pyruvate in both the cases, and the rate of conversion ($r_1$) can be written as:

    $ r1(t)=(δEMPκEMP(t)kEMP+δEDκED(t)kED)V(acell)r0(t)
    $
    (2)

    where $\kappa_{EMP}$ and $\kappa_{ED}$ are the volume density of EMP and ED enzyme sites respectively, $k_{EMP}$ and $k_{ED}$ are normalized efficiencies of the pathways, and $V$ is the volume of the cell. $\delta_{EMP}$ and $\delta_{ED}$ indicate presence of EMP and/or ED pathway in the organism under scrutiny, taking a value 1 if present and 0 if absent; else if both are present, it denotes the fraction out of 1 which is occupied by either pathway such that $\delta_{EMP}+\delta_{ED} = 1$. About 43% of the prokaryotic cells use just EMP pathway, 13% use just the ED pathway, 14% use both pathways, and in about 30% of the cases, the pathway is not known [11].

    The relative usage of the EMP and ED pathways can be calculated on the basis of protein cost, kinetics and the efficiency of the enzymes involved in both the pathways at any given glucose concentration as well as the thermodynamic constraints [11]. To put it in simpler terms, the ED pathway is about 3-5 times faster than EMP pathway, but EMP produces 2 ATP molecules whereas ED produces 1 per molecule of glucose [11]. So, in the case of OP, a difference of one ATP is not of much significance because the total production of ATP is high, but in cases of fermentation, one ATP is a substantial difference. Thus, we would expect to see mostly EMP in anaerobes versus ED in aerobes. Anaerobic bacteria have predominantly only EMP (97%), whereas some facultative anaerobes and aerobes have ED only (10% and 21% respectively), others have both ED and EMP (19% and 21% respectively), and more than half have only EMP [11]. Here we seek to model aerobic heterotrophic bacteria, so we can expect that the ED pathway is prevalent when the metabolism is predominantly aerobic (OP) while EMP is prevalent when it is anaerobic (fermentation).

    Next, this $r_1(t)$ flux of products from upper glycolysis goes to either the oxidative phosphorylation (OP) pathway ($r_2(t)$) or to the fermentation pathway ($r_3(t)$). This splitting of the flux forms the basis of the three trade-offs on which we focus: yield vs rate, surface area vs volume, and biomass production (Table 1). The rates for $r_2$ and $r_3$, can be written as:

    $ r2(t)=(γCyokCyo+γCydIIkCydII)A(acell)r1(t)
    $
    (3)

    and

    $ r3(t)=σkσV(acell)r1(t)
    $
    (4)

    where $\gamma_{Cyo}$ and $\gamma_{CydII}$ are the areal density of the two cytochrome complexes Cyo and Cyd-Ⅱ respectively, $k_{Cyo}$ and $k_{CydII}$ are normalized efficiency of the complexes, $\sigma$ is the volume density of the fermentation enzymes (sites), and $k_{\sigma}$ is the normalized efficiency of the fermentation enzymes (sites). Here, normalized efficiency is defined as the ratio of products formed by the enzyme site relative to the total substrate that was present, per unit time. As a part of the simplification in the model, we have only considered the cytochrome complexes Cyo and Cyd-Ⅱ as a part of the model leaving behind the Cyd-Ⅰ complex.

    For maintenance of the cellular membrane structure in prokaryotes, the protein-to-lipid ratio is kept within certain bounds [22]. At high rates of catabolism, the surface area available to proteins can become saturated and proteins might need to 'compete' for expression [49]. Both substrate transporters (in this case, glucose transporters) and OP enzymes are located on the membrane, and thus, compete for the available space for expression. Thus, we can write:

    $ r2(t)r2,max
    $
    (5)

    where, we assume a constant maximal value.

    In previous literature, the relative membrane cost of an enzyme has been inversely related to its turnover rate [2] and hence at high catabolic rate one would expect the faster and inefficient Cyd-Ⅱ to be preferred over efficient but slower Cyd [2]. The relative cost of moderately efficient Cyd-Ⅰ is similar to Cyo under completely aerobic conditions, but under low concentration of oxygen, the cost becomes much less due to the high affinity of Cyd-Ⅰ to $O_2$ [40,49].

    Summarizing the model, the net energy production rate can be written as

    $ e+(t)=dEgaindt=er2(t)+er3(t)=ϵOP(t)r2(t)+ϵF(t)r3(t)
    $
    (6)

    where $e_{r_2}$ is the energy produced through $r_2$ (via OP) and $e_{r_3}$ is the energy produced through $r_3$ (via fermentation (F) or in presence of oxygen, termed as aerobic glycolysis). $\left \langle \epsilon_{OP} \right \rangle$ and $\left \langle \epsilon_{OP} \right \rangle(t)$ are the weighted average efficiencies of ATP production from OP (via Cyo and Cyd-Ⅱ), and F respectively. For simplicity, each of these process averages also include a term regarding the overall efficacy of the upper glycolysis (as a function of the proportion of EMP and ED pathways). In other words, the two averages mentioned above involve the efficiency from the point of upper glycolysis to the end of their respective processes.

    A main function of unregulated glycolysis in proliferating cells is to maintain the supply of intermediates required to support biosynthesis [20,41]. Interestingly, in such rapidly proliferating cells, most of the glucose is converted into lactate (or other fermentation products) and excreted. However, an increased lactate excretion is correlated with increased growth [1,20,41]. Such a seemingly inefficient high glycolytic flux to fermentation products and low flux to biosynthesis actually helps in regulation of biomass production during growth [20,41]. The branching of a low flux process (biosynthesis) from a high flux one (fermentation) would render the former extremely sensitive to the latter [20,25]. Comprehending the exact role of such processes in biomass production would need a thorough study of carbon metabolism (for details please see [20]). However, given the dependence, one can certainly assume a simple linear relationship between biomass synthesis and fermentation. Here onwards, we explain biomass production in terms of $r_3$ flux and thus, the rate of biomass addition $\Lambda$, can be given by:

    $ Λ(t)=gr3(t)
    $
    (7)

    where $g$ is the conversion constant relating the products of fermentation pathway to biomass. The process of biomass production also involves energy usage (along with the need for other resources such as nitrogen and phosphorus, which have been assumed to be present in sufficient quantity for this model).

    The energy consumption rate can thus, be given by:

    $ e(t)=eb+ϵggr3(t)
    $
    (8)

    where $e_{b}$ is the basal energy requirement of the cell and $\epsilon_{g}$ is the energy required per unit conversion for biomass production from base materials.

    Most metabolic networks operate in a steady state [34]. Thus, here we tried to optimize the energy production and growth using linear programming, adhering to the following relations:

    $ r0(t)r2(t)+r3(t)
    $
    (9)
    $ ebϵOP(t)r2(t)+ϵF(t)r3(t)
    $
    (10)
    $ r2(γCyokCyo+γCydIIkCydII)A(acell)r3σkσV(acell)=0
    $
    (11)

    The first inequality states that the total glucose processing that takes place in OP and fermentation is constrained by the total glucose input into the cell. The next relation describes the fact that the total energy production in the cell has a lower bound of the basal metabolic rate of the cell ($e_b$). Below this level, the cell may cease to function properly or shut down entirely [17]. The third relation is an equation which is modified and combined form of Equations (3) and (4). The way to look at it is that both the terms in Equation (10) simplify to $r_1$, as is evident from Equations (3) and (4).

    Let us also define an additional parameter called $Z$ denoting the ratio of surface area-to-volume of a cell. From (11), it is evident that $Z$ controls the distribution of $r_1$ into $r_2$ and $r_3$ by controlling the total number of sites available for those processes. A low value of $Z$ denotes either a spherical cell and/or a large cell size; and a high value of Z represents an elongated/deformed cell shape and/or a small cell size.

    These conditions can be used for linear programming and the point in solution space having the highest value of $r_3$ will give the optimal values of $(r_2, r_3)$ at a given set of steady state conditions. This accords with our assumption that only $r_3$ related processes directly help in biomass production, and any organism would maximize its biomass production in a given set of conditions, provided its basal needs are satisfied. All other parameters are considered to be constants for finding the optimal solution for a given iteration.

    Given the number of model parameters, it is pragmatic to focus on a few important ones, which would enable us to predict and investigate broad-scale natural phenomena from an improved viewpoint. In this work, we primarily focus on changing the substrate concentration and the surface area-to-volume ratio of bacterial cells to gain insights from the model and explore the Warburg effect (overflow metabolism) in bacterial cells.

    $r_0$ is the rate of substrate input from the environment, and is representative of the external substrate concentration. Figure 2 plots the results of the applying the maximization criterion for $r_3$ constrained by (9)-(11), on changing the value of $r_0$. Three important regimes of substrate concentration are considered: glucose starved (low $r_0$), moderate glucose availability (moderate $r_0$), and glucose rich environment (high $r_0$).

    Figure 2.  Representation of the solutions for a bacterial cell at steady state with all features except glucose concentration constant. The dot-dashed red line represents relation (9), the solid green line represents relation (10) and the dashed blue line represents Equation (11). The area shaded in yellow represents the solution for (9) and (10), and the red dot represents the optimized value of $r_3$ for (9)-(11).

    When (9) and (10) do not have a common solution space, i.e., when the substrate availability is not sufficient to sustain all basic metabolic activities, but is high enough not to cause complete dormancy [17], the maximized solution is $(0, r_0)$ in the $(r_2, r_3)$ space. This suggests that under a substrate-poor scenario there exists a need for high efficiency in substrate conversion, without much consideration for its rate of production or cellular growth.

    Increasing $r_0$ enables high rates of $r_3$ due to fulfillment of basal metabolic processes and a need to increase biomass output for growth. This points at the higher growth rates associated with nutrient and substrate rich environments [41]. At extremely high glucose concentrations, the value of $\beta$ would saturate (to its highest value in order to keep the protein-to-lipid ratio of the membrane intact) and $k_\beta$ would decrease (as only a specific maximal number of glucose molecules can be transported into the cell constrained by the protein efficiency) in Equation (1). These two features make the value of $r_0$ constant above a certain threshold of $G_{0}$. Thus, beyond this threshold value, growth (which is proportional to $r_3$) would not depend upon $G_{0}$ explicitly, but only on the available $r_0$. Such a behavior is observed in E. coli along with an increase in expected growth rate with increasing $G_{0}$ until the threshold concentration (maximal value of $r_0$) is reached [35].

    Such an overall pattern of starvation metabolism in environments with scarce substrate environments and proliferative metabolism in environments with abundant substrate is seen in all unicellular organisms [41].

    The solutions of the constraint equations (9)-(11) for three differing regimes of $Z$ are plotted in Figure 3. The value of $r_0$ has been kept constant in the three cases for clarity. As mentioned previously, a low value of $Z$ refers to either a spherical cell and/or a large cell size; and a high value of $Z$ points to an elongated/deformed cell shape and/or a small cell size.

    Figure 3.  Representation of the solutions for a bacterial cell at steady state with all features constant except the ratio of surface area to volume of the cell (denoted by $Z$). The dot-dashed red line represents relation (9), the solid green line represents relation (10) and the dashed blue line represents Equation (11). The area shaded in yellow represents the solution for (9) and (10), and the red dot represents the optimized value of $r_3$ for (9)-(11).

    Large values of $Z$ enable higher efficiency for energy conversion processes but trade off for slower growth, which may be typical for substrate poor environments. Low values of $Z$ sacrifice efficiency for a higher rate of energy and biomass production, and would be expected in conditions where substrate is abundant. This shape and size based control of metabolic strategies is quite commonly seen in different types of bacteria [48]. Numerous previous works and experiments support the predictions from our model regarding the interdependence of metabolism, growth, shape and size. These cases have been analyzed in the discussion section.

    The Warburg effect is termed overflow metabolism in bacteria, due to the cellular excretion (or overflow) of excess metabolites like lactate, acetate, or ethanol after incomplete oxidation of glucose. Acetate overflow metabolism has been well documented in E. coli [49], but the process is not clearly understood [43].

    During the process of conversion of $r_3$ products into biomass, energy consumption is involved as in Equation (8). If the value of $\epsilon_g\cdot g > \epsilon_F$, then the energy gained from $r_3$ alone is insufficient to convert substrate into biomass and the cell would depend upon more efficient $r_2$ for energy. But, if the value of $r_3$ is high enough $e_+$ (Equation 6) would be insufficient to sustain $e_-$ (Equation 8), i.e., $e_- > e_+$. In such a case, the excess $r_3$ products would be dumped outside the cell and the rest would be used for biomass production. The maximum value of $r_3$ for which all substrate would be converted into biomass, is given by the relation:

    $ e_+ \geq e_- \Rightarrow \epsilon_2 \cdot r_2 + \epsilon_3 \cdot r_3 \geq e_b + \epsilon_g\cdot g \cdot r_3 $
    $ ϵ2r2+(ϵ3ϵgg)r3eb
    $
    (12)

    The solution for (9) and (12) would give us the maximal value of $r_3$ beyond which export of excess $r_3$ products will occur. Additionally in such a high flux regime, we would need to invoke Equation (5), which describes the maximum rate of OP, in order not to destabilize the protein-lipid ratio of the bacterial membrane.

    In such a scenario, the fermentation related enzymes are up-regulated [20], resulting in changes to the slope of Equation (11), even though the value of $Z$ remains unchanged. This occurs because the number of OP enzymes ($\gamma$s) remaining constant whereas that of fermentation ($\sigma$) increasing in value. This decreases the slope of the line- a shift to match the intersection of Equations (5) and (9), i.e., in order to process the remaining glucose influx (shown in Figure 4a via the black dot, which is the final solution for Equations (5), (9)-(11)).

    Figure 4.  Representation of overflow metabolism in a bacterial cell. (a) The dot-dashed red line represents relation (9), the solid green line represents relation (10) and the dashed blue line represents Equation (11) and the solid purple line represents relation (5). The area shaded in yellow represents the solution for (9) and (10), and the red dot represents the optimized value of $r_3$ for (9)-(11). The black dot represents altered final solution due to (5). See text for details. (b) The solid green line represents (10), the solid purple line represents the final solutions of (5), (9)-(11) and the black dot dash line represents (12). $\Delta r_3$ represents the estimate of overflow metabolic products. The phase space has been divided in four parts based on the solid purple line and (12). (c) Overflow products vs. growth (Equation 7).

    Furthermore, the intersections of the line representing final solutions of (5), (9)-(11) with the line representing (12), provides us with three different regimes of bacterial metabolism (denoted by regime 2-4 in Figure 4b). We also find an additional regime of metabolism arising from the part of the phase space where there is no solution for (5), (9)-(11) (denoted by regime 1 in Figure 4b). This leads us to a total of four such scenarios (as seen in Figure 4b). We discuss these regimes in brief before delving into overflow metabolism in detail again.

    As discussed in section 3.1, regime 1 in Figure 4b, c, is characterized by substrate concentrations that are insufficient to fulfill all the basic metabolic requirements of the cell. Thus, the cell resorts to limited activity and uses only OP to extract as much energy as possible from the substrate for sustainence.

    Regime 2 is more interesting and is denoted by an arrow in Figures 4b, c. Here, the substrate flux is enough to maintain the basic cellular metabolic requirements, but does not produce enough energy for biomass production (i.e., $e_+ \geq e_b$ but $<\epsilon_g\cdot g \cdot r_3$). In such a case, even though it is a low substrate scenario, $r_3$ products are in excess. According to a previous model [23], in such a regime, excess $r_3$ products might be converted back to pyruvate ($r_1$ product) and reused for OP to keep the respiration at full capacity. Unfortunately, a direct prediction of this could not be obtained from our model, but it predicts excess $r_3$ products that is definitely not known to be excreted away (see data in [1]).

    Once enough energy can be produced for the cell to start proliferating (the first intersection of the solid purple line and the dot dashed black line in Figure 4b), the cell not only has enough energy to sustain basic metabolic activities but also for biomass production. In this case, there are no overflow products. This scenario continues till the second intersection of the aforementioned lines in Figure 4b. Above this limit, overflow metabolism takes place, because $e_+ \ngtr e_-$ and thus the excess products are excreted. There are several other reasons for non-reduction of $r_3$ processes even though they seem wasteful and they can be found in relevant reviews [20].

    In Figure 4b, the difference ($\Delta r_3$) in the final solution of $r_3$ value for the solutions of (7), (9)-(11) with (12) will give an estimate of the overflow metabolism. In this fourth regime, $\Delta r_3$ can be plotted against growth/biomass production rate (Equation (7)) to obtain Figure 4c. The prediction of this relation matches numerous laboratory observations of overflow metabolism in multiple strains of bacteria [1].

    As represented in Equation (7), the bacterial growth rate $R$ can be given by:

    $ R=ΛΛ0=gr3,maxΛ0
    $
    (13)

    where $r_{3, max}$ is the final solution for (5), (9)-(12) (symbolized by the purple line in Figure 4b) and $\Lambda_0$ is the biomass ($\Lambda$) required to make a new cell. This growth rate, $R$, can then be incorporated into a regular Lotka-Volterra equation system to find the population size $N_i$ of a species $i$ directly as a function of substrate concentration through $R$, given by:

    $ dNi(t)dt=RiNi(t)(1jαijNj(t)Ki)
    $
    (14)

    where $R_i$ is the growth rate of species $i$, $N_i$ is the number of individuals of species $i$, $\alpha_{ij}$ is the competition coefficient between species $i$ and $j$ and $K_i$ is the carrying capacity of species $i$.

    Our model can be extrapolated to include multiple substrates using a vector to symbolize $r_0$, in order to estimate $R$. We can then use the independent experimental data for growth and substrate preference in individual species to calculate $\alpha_{ij}$ [39], in order to obtain all the parameters in (13).

    In addition to the direct estimation of populations, we can use the same technique of vectorization of resources and then species in the model to calculate the magnitude of overflow metabolism. This understanding can then be used in the context of many modern and paleo-ecosystems where spatio-temporal change in substrate concentration is significant and would result in interactions between various communities. Such usage is not possible from any of the earlier models because they do not estimate overflow metabolism from first-principles [22], and further, most the FBA models are specific to a particular species. Temperate wetlands are one such example of an ecosystem with spatio-temporal change in substrate concentration. Our model can be extrapolated to predict and estimate the gas fluxes ($CO_2$ and methane), and further to account for phenomena such as aerobic methanogenesis.

    In temperate zone wetlands, the fall season can be seen as a pulse of high concentration of substrate and resources. Due to the Warburg effect, an increased concentration of substrates would not result in higher carbon dioxide fluxes, but rather in production of secondary metabolites like lactate and acetate, and a sudden proliferation of bacterial populations. This can not only affect the amount of carbon dioxide released but also the amount of substrate that is available to methanogens. Acetate is produced by heterotrophic bacteria through overflow metabolism [1] and can be utilized by the acetate-based methanogens, which form a large part of the methanogen community in the wetlands. Moreover, lactate is also formed during the process [41] and can be used by the syntropic relations of hydrogen-based methanogens and sulfate-reducing bacteria [21].

    This methane produced by the methanogens, using the metabolites from the Warburg effect (overflow metabolism), is then oxidized by the methanotrophs, which use the oxygen from the water column (of the small water bodies in these wetlands) above the methanogens, thus producing carbon dioxide. We illustrate this idea in Figure 5 where the bold red line is the total $CO_2$ production and the dotted red line represents the $CO_2$ emitted from the heterotrophic bacteria. So, even though the total $CO_2$ emissions increase, it is actually the increase in methane production and its subsequent oxidation that is fueling this rise.

    Figure 5.  A representation of the effect of overflow metabolism in temperate zone wetlands. A refers to heterotrophic bacteria, B refers to methanogens (which feed on lactate and acetate to produce methane), and C refers to methanotrophs (which consume $CH_4$ and $O_2$ to produce $CO_2$). The area shaded yellow in the figure, refers to the $CO_2$ produced by methanotrophs, by oxidizing $CH_4$. The $CO_2$ and methane emissions are representative from previous literature [5].

    Once the initial substrates start depleting, the water column becomes anoxic due to oxygen usage by both the methanotrophs, whose population rises because of increased methane availability, and by the already large aerobic heterotrophic community, fueled by the initial pulse of substrates. After a certain degree of anoxia is reached, the aerobic heterotrophs start declining due to lower oxygen and lower substrate availability. Only the anaerobic heterotrophs remain plentiful, but in reduced abundance as easily available resources have been depleted, and they have to process the less usable ones. During this time the total $CO_2$ production falls, and due to the lack of sufficient oxygen, not all of the methane gets oxidized. This results in a net release of methane from the system.

    Now as the process continues, the methane flux rises to a maximum, where the metabolites for methanogenesis are still available (from the accumulated overflow metabolism of the heterotrophs) but are getting depleted. After a certain tipping point, the methane flux also decreases, and the column becomes completely anoxic. In previous literature [5], such a rough pattern has been observed and the time frame for the whole process sums up to about one year. Seasonal rainfall mixes the anoxic waters with atmospheric oxygen well, and the cycle starts again by provision of pulsed high substrate input in the next fall. The process has been visualized in Figure 5.

    Here we considered the three major trade-offs of Warburg effect in a bacterial cell through linear equations and inequalities with the goal of improving the understanding of the ecological consequences of bacterial metabolism.

    Most previous modeling of the Warburg effect comes from the family of models called FBA (Flux Balance Analysis), which was briefly discussed in the introduction of this work [22,23,34,37,42,49]. These models use the knowledge of constructed biochemical networks, in particular the genome-scale metabolic network reconstructions [22]. These networks consist of most identified metabolic reactions in a given organism and the genes that encode each enzyme. The model estimates the flow of metabolites through this network, thus predicting the growth rate of an organism or rate of production of a given metabolite. These networks are specific to organisms and making a generalized model network for all aerobic heterotrophic bacteria would be an immense task. Calculations over such networks are also computationally intensive.

    In contrast, we try to generate a very simple model using linear relations. The parameters that are used in the model can be inferred from experiments and are usable for any aerobic heterotrophic bacterial species. In addition, one can look at the growth and other estimates that are predicted by the model, and explore how they change as functions of the parameter values. Disadvantages of our approach are that we cannot predict the flux of other metabolites that are not encoded in our model and we cannot take protein costs and related terms into account.

    Consequently, our model reflects the classic trade-off between generalizability and specificity. Because our aim was to study the ecology of these organisms, we chose a more general model that helps us explore the Warburg effect in this class of organisms broadly, rather than obtaining highly resolved pathways and fluxes. This simple formulation allowed us to incorporate the volume and surface area of the cell, leading to parameterization of shape and size of the cell. Exploration of how cellular metabolism and growth depend on cell shape and size (in addition to substrate concentration) is a novel feature of our model as compared to previous studies [22,23,34,37,42].

    Even though this family of FBA models has been noticeably successful in estimating fluxes, it is unable to explain overflow metabolism from first principles [22]. Only when using measured fluxes like maximal oxygen uptake rates or other pathway capacities as auxiliary constraints do FBA models predict the use of fermentation or other inefficient routes [22]. Such a method does not seem adequate, as these constraints act like fitted parameters and the models do not fully explain why organisms simply do not increase the capacity of the efficient routes by producing more enzymes [22]. We note, however, that Zhuang et al. [49] incorporated membrane crowding and an upper limit on the number of respiratory enzymes in order to add a physical constraint on the model (FBAwmc).

    In comparison, our model has a physical constraint similar to Zhuang et al. [49], but unlike them, we use a generalized model instead of a specific organism's metabolic network. We take into consideration the facts that, as a component of the maintenance of cellular membrane structure in prokaryotes, the protein-to-lipid ratio is kept within certain bounds [22] and that at high rates of catabolism, the surface area available to proteins can become saturated and proteins (such as glucose transporters and OP enzymes) might 'compete' for expression [49].

    Molenaar et al. [22] used constraints of membrane structure maintenance and a maximal cellular density of proteins to construct their model. That work introduced a shape parameter but did not develop it further as the primary focus was to optimize enzyme systems in order to maximize growth. But even their model, which overcame some of the shortcomings of FBA, did not consider the minimal energy requirement of the cell.

    Though minimal energy requirements for bacterial cells have been known for some time [17], they were not directly incorporated in the models mentioned above. Our incorporation of such a constraint helped us to classify different metabolic regimes in bacteria, something that has not been done in many previous studies [22,34,37,42]. Vazquez et al. [42] sought to identify dynamic regimes but ended up making two very strict ones: one with only OP and one with mixed metabolism (fermentation and OP). Moller et al. [23] aimed to classify dynamical regimes but did not take minimal energy requirements into consideration and did not address overflow metabolism.

    Our adoption of a minimum energy constraint equation leads directly to the four regimes in metabolism, as described in the Results and Figure 4. These regimes stretch all the way from low substrate conditions to very high substrate concentrations. Even more, the same set of equations give us a direct estimate of overflow metabolism products. Understanding this set of regimes is crucial for many biotechnological applications which may utilize bacterial culture under different conditions.

    There are numerous studies and experiments that follow the predictions outlined in our work - especially regarding the shape and size dependence of bacterial metabolism and growth.

    In substrate poor conditions, it has been observed that E. coli reduces its $Z$ by becoming much smaller to allow for more efficiency [18]. In a similar note, certain strains of E. coli grew to become much larger than undiluted cells within a few generations [4] on serial dilution with fresh growth media.

    A comparable result was shown in a long term evolutionary experiment in the same organism, where the mean cell volume increased in serial dilutions over 10,000 generations [19]. The increase in cell volume was also accompanied by an increase in relative fitness, which can be taken as a measure of $r_3$, implying a lower $Z$ has a higher $r_3$, as predicted from our model. Such a general trend of higher fitness being associated with larger size was shown in about 40 species of obligate heterotrophic bacteria in another work [6].

    In a set of classic experiments, Salmonella enterica serovar Typhimurium produced wider cells (lower $Z$) in resource rich medium than when grown in minimal medium, and slow growing cells (low $r_3$) were smaller than fast growing cells (high $r_3$) [33]. The latter was been also demonstrated in E. coli, where faster growing cells (high $r_3$) are significantly wider (high $Z$) [24].

    Geobacter sulfurreducens has a capacity to process acetate more efficiently than a similar iron-reducer Rhodoferax ferrireducens [9,29,49] due to its smaller size (and thus, larger $Z$). Similarly, living in energy-starved environments Dehalococcus spp. may have evolved its disc shape to maximize the dechlorination rate (given that the process has a low thermodynamic efficiency) [15].

    When grown in nutrient-limiting conditions, certain Streptococcus isolates grew as true filaments instead of as cocci [12,31]. In a similar way, Pseudomonas aeruginosa, Pseudomonas putida and Pseudomonas fluorescens elongate into thin slim cells in nutrient poor environment, unlike the short rods observed in normal media [36,38].

    A cell cannot increase its $Z$ indefinitely by change in cell shape, hence another strategy would be to use subsidiary filaments to increase surface area (and $Z$). When deprived of certain substrates, Actinomyces israelii grows branched filamentous roads (high $Z$) and returns to its normal morphology once those substrates are added back [27]. Nutrient-poor conditions also enhance filamentation in Arthobacter globiforms [8,14] and Clostridiium welchii [46,47].

    As outlined in the Results, we can use a vectorized version of our model to understand the wetland gas emission dynamics via estimation of overflow metabolism. As a further speculation, we note that a similar process may have happened over longer geological timescales. In the past, events involving heavy releases of methane such as the end-Permian mass extinction [30] might also be explainable to some extent using our formulation. High primary productivity and substrate availability due to increased $CO_2$ and weathering processes might have triggered overflow metabolism in the heterotrophic microbes leading to a large scale production of metabolites such as acetate and lactate. These substrates can then be utilized by methanogens, especially acetate, which has been linked to the massive methanogenic burst at end-Permian [30].

    Although simple, our work provides a fairly straightforward way to look at ecological trends in systems of bacterial taxa. This is an added benefit which extends beyond the main results concerning overflow metabolism and the relative dynamics of respiration and fermentation. Not only are these trends supported by previous studies and experiments, but even more importantly they provide simple predictions, which can be tested in the lab.

    WFF was partially supported by the U.S. Army Research Laboratory and the U.S. Army Research Office under Grant W911NF-14-1-0490.

    The authors declare there is no conflict of intetest.

    [1] Costerton JW, Stewart PS, Greenberg EP (1999) Bacterial Biofilms: A Common Cause of Persistent Infections. Science 27: 1318-1322.
    [2] Davies D (2003) Understanding biofilm resistance to antibacterial agents. Natur Rev Drug Discov 2: 114-122. doi: 10.1038/nrd1008
    [3] Sun G (2014) Prevention of hospital and community acquired infections by using antibacterial textiles and clothing. In: Polymeric materials with antimicrobial activity, Muñoz-Bonilla A, Cerrada ML, Fernández-García M., Eds., RSC Polymer Chemistry Series, Ch 6, 139-154.
    [4] Chen L, Bromberg L, Hatton TA, et al. (2008) Electrospun cellulose acetate fibers containing chlorhexidine as a bactericide. Polymer 49: 1266-1275. doi: 10.1016/j.polymer.2008.01.003
    [5] DeLeo FR, Chambers HF (2009) Reemergence of antibiotic-resistant Staphylococcus aureus in the genomics era. J Clin Invest 119: 2464-2474. doi: 10.1172/JCI38226
    [6] Melaiye A, Sun Z, Hindi K, et al. (2005) Silver(I)−Imidazole Cyclophane gem-Diol Complexes Encapsulated by Electrospun Tecophilic Nanofibers:  Formation of Nanosilver Particles and Antimicrobial Activity. J Am Chem Soc 8: 2285-2291.
    [7] Baley GJ, Peck GE, Banker GS (1977) Bactericidal properties of quaternary ammonium compounds in dispersed systems. J Pharm Sci 66: 696-699. doi: 10.1002/jps.2600660522
    [8] Ortenzio LF, Stuart LS (1959) The behavior of chlorine-bearing organic compounds in the AOAC available chlorine gemicidal equivalent concentration test. J Assoc Off Ana Chem 42: 630-633.
    [9] Chopra I, Roberts M (2001) Tetracycline Antibiotics: Mode of Action, Applications, Molecular Biology, and Epidemiology of Bacterial Resistance. Microbiol Mol Biol Rev 65: 232-260. doi: 10.1128/MMBR.65.2.232-260.2001
    [10] Danese PN (2002) Antibiofilm Approaches: Prevention of Catheter Colonization. Chem Biol 9: 873-880. doi: 10.1016/S1074-5521(02)00192-8
    [11] Jarvis WR (1996) Selected aspects of the socioeconomic impact of nosocomial infections: morbidity, mortality, cost, and prevention. Infect Cont Hosp Ep 17: 552-557. doi: 10.2307/30141291
    [12] McGowan JE (2001) Economic impact of antimicrobial resistance. Emerg Infect Dis 7: 286-292. doi: 10.3201/eid0702.010228
    [13] Reneker DH, Chun I (1996) Nanometre diameter fibres of polymer, produced by electrospinning, Nanotechnology 7: 216-223.
    [14] Li D, Xia Y (2004) Electrospinning of nanofibers: Reinventing the wheel? Adv Mater 16: 1151-1170. doi: 10.1002/adma.200400719
    [15] Deitzel, JM, Kleinmeyer J, Harris D et al. (2001) The effect of processing variables on the morphology of electrospun nanofibers and textiles. Polymer 42: 261-272. doi: 10.1016/S0032-3861(00)00250-0
    [16] Daels N, De Vrieze S, Sampers I, et al (2011) Potential of a functionalised nanofibre microfiltration membrane as an antibacterial water filter. Desalination 275: 285-290. doi: 10.1016/j.desal.2011.03.012
    [17] Zodrow K, Brunet L, Mahendra S (2009) Polysulfone ultrafiltration membranes impregnated with silver nanoparticles show imporved biofouling resistance and virus removal. Water Res 43: 715-723. doi: 10.1016/j.watres.2008.11.014
    [18] Payne RJH, Jansen VAA (2003) Pharmacokinetic principles of bacteriobacteriophage therapy. Clin Pharmacokinet 42: 315-325. doi: 10.2165/00003088-200342040-00002
    [19] Gao Y, Truong YB, Zhu Y, et al. (2014) Electrospun antibacterial nanofibers: production, activity, and in vivo applications. J Appl Polym Sci 131: 40797.
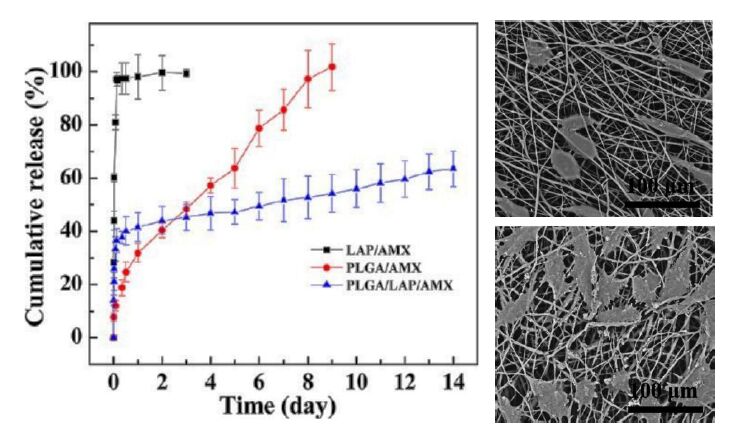
    [20] Wang S, Zheng F, Huang Y, et al. (2012) Encapsulation of amoxicillin within laponite-doped poly(lactic-co-glycolic acid) nanofibers: preparation, characterization, and antibacterial activity. Acs Appl Mater Interfaces 4: 6396-6401.
    [21] Özdemir I, Özcan EO, Günal S (2010) Synthesis and Antimicrobial Activity of Novel Ag-N-Heterocyclic Carbene Complexes. Molecules 15: 2499-2508. doi: 10.3390/molecules15042499
    [22] Clement JL, Jarret PS (1994) Antibacterial Silver. Met Based Drugs 1: 467-482. doi: 10.1155/MBD.1994.467
    [23] Tambe SM, Sampath L, Modak SM (2001) In-vitro evaluation of the risk of developing bacterial resistance to antiseptics and antibiotics used in medical devices. J Antimicrob Chemoth 47: 589-598. doi: 10.1093/jac/47.5.589
    [24] Liu JJ, Galettis P, Farr A, et al. (2008) In vitro antitumour and hepatotoxicity profiles of Au(I) and Ag(I) bidentate pyridyl phosphine complexes and relationships to cellular uptake. J Inorg Biochem 102: 303-310. doi: 10.1016/j.jinorgbio.2007.09.003
    [25] Jeong L, Kim MH, Jung JY, et al. (2014) Effect of silk fibroin nanofibers containing silver sulfadiazine on wound healing. Int J Nanomed 9: 5277-5287.
    [26] Burd A, Kwok CH, Hung SC, et al. (2007) A comparative study of the cyto¬toxicity of silver-based dressings in monolayer cell, tissue explant, and animal model. Wound Repair Regen 15: 94-104. doi: 10.1111/j.1524-475X.2006.00190.x
    [27] Lok CN, Ho CM, Chen R, et al. (2006) Proteomic analysis of the mode of antibacterial action of silver nanoparticles. J Proteome Res 5: 916-924. doi: 10.1021/pr0504079
    [28] Lansdown AB (2005) A guide to the properties and uses of silver dressings in wound care. Prof Nurse 20: 41-43.
    [29] Vepari C, Kaplan DL (2007) Silk as a biomaterial. Prog Polym Sci 32: 991-1007. doi: 10.1016/j.progpolymsci.2007.05.013
    [30] Kasoju N, Bora U (2012) Silk fibroin in tissue engineering. Adv Healthc Mater 1: 393-412. doi: 10.1002/adhm.201200097
    [31] Dong G, Xiao X, Liu X, et al. (2009) Functional Ag porous films prepared by electrospinning. J Appl Surf Sci 255: 7623-7626. doi: 10.1016/j.apsusc.2009.04.039
    [32] Xu X, Yang Q, Wang Y, el al. (2006) Biodegradable electrospun poly(l-lactide) fibers containing antibacterial silver nanoparticles. Eur Polym J 42: 2081-2087. doi: 10.1016/j.eurpolymj.2006.03.032
    [33] Son WK, Youk JH, Park WH (2006) Antimicrobial cellulose acetate nanofibers containing silver nanoparticles. Carbohyd Polym 65: 430-434. doi: 10.1016/j.carbpol.2006.01.037
    [34] Lala NL, Ramaseshan R, Bojun L, et al. (2007) Fabrication of nanofibers with antimicrobial functionality used as filters: protection against bacterial contaminants. Biotechnol Bioeng 97: 1357-1365. doi: 10.1002/bit.21351
    [35] Yang QB, Li DM, Hong YL, el al. (2003) Preparation and characterization of a PAN nanofibre containing Ag nanoparticles via electrospinning Proceedings of the 2002 International Conference on Science and Technology of Synthetic Metals, Elsevier SA, Lausanne, Switzerland, 973-974.
    [36] Sheikh FA, Barakat NAM, Kanjwal MA, el al. (2009) Electrospun antimicrobial polyurethane nanofibers containing silver nanoparticles for biotechnological applications. Macromol Res 17: 688-696. doi: 10.1007/BF03218929
    [37] Gliscinska E, Gutarowska B, Brycki B, el al. (2012) Electrospun Polyacrylonitrile Nanofibers Modified by Quaternary Ammonium Salts. J Appl Polym Sci 128: 767-775.
    [38] Yarin AL, Zussman E (2004) Upward needleless electrospinning of multiple nanofibers. Polymer 45: 2977-2980. doi: 10.1016/j.polymer.2004.02.066
    [39] Nomiya K, Tsuda K, Sudoh T, el al. (1997) Ag(I)-N bond-containing compound showing wide spectra in effective antimicrobial activities: Polymeric silver(I) imidazolate. J Inorg Biochem 68: 39-44. doi: 10.1016/S0162-0134(97)00006-8
    [40] Nomiya K, Noguchi R, Oda M (2000) Synthesis and crystal structure of coinage metal(I) complexes with tetrazole (Htetz) and triphenylphosphine ligands, and their antimicrobial activities. A helical polymer of silver(I) complex [Ag(tetz)(PPh3)2]n and a monomeric gold(I) complex [Au(tetz)(PPh3)]. Inorg Chim Acta 298: 24-32.
    [41] Atiyeh BS, Ioannovich J, Al-Amm CA, el al. (2002) Management of acute and chronic open wounds: the importance of moist environment in opimal wound healing. Curr Pharm Biotechnol 3: 179-195. doi: 10.2174/1389201023378283
    [42] Akhavan O, Ghaderi E (2009) Enhancement of antibacterial properties of Ag nanorods by electric field. Sci Technol Adv Mat 10: 015003. doi: 10.1088/1468-6996/10/1/015003
    [43] Tijing LD, Amarjargal A, Jiang Z (2013) Antibacterial tourmaline nanoparticles/polyurethane hybrid mat decorated with silver nanoparticles prepared by electrospinning and UV photoreduction. Curr Appl Phys 13: 205-210. doi: 10.1016/j.cap.2012.07.011
    [44] Raffi M, Mehrwan S, Bhatti TM, et al. (2010) Investigations into the antibacterial behavior of copper nanoparticles against Escherichia coli. Ann Microbiol 60: 75-80. doi: 10.1007/s13213-010-0015-6
    [45] Zhong W, Zishena W, Zhenhuana Y, et al. (1994) Synthesis, characterization and antifungal activity of copper (II), zinc (II), cobalt (II) and nickel (II) complexes derived from 2-chlorobenzaldehyde and glycine. Synth React Inorg Met-Org Chem 24: 1453-1460. doi: 10.1080/00945719408002572
    [46] Sheikh FA, Kanjwal MA, Saran S, et al. (2011) Polyurethane nanofibers containing copper nanoparticles as future materials. Appl Surf Sci 257: 3020-3026. doi: 10.1016/j.apsusc.2010.10.110
    [47] 
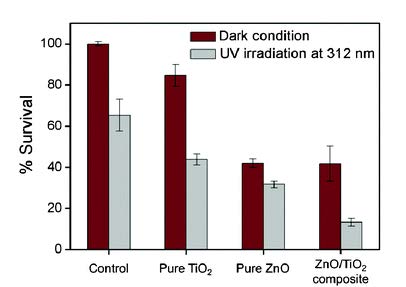
Hwang SH, Song J, Jung Y, et al. (2011) Electrospun ZnO/TiO2 composite nanofibers as a bactericidal agent. J Chem Commun 47: 9164-9166. doi: 10.1039/c1cc12872h
    [48] Lee S (2009) Multifunctionality of layered fabric systems based on electrospun polyurethane/zinc oxide nanocomposite fibers. J Appl Polym Sci 114: 3652-3658. doi: 10.1002/app.30778
    [49] Lee K, Lee S (2012) Multifunctionality of poly(vinyl alcohol) nanofiber webs containing titanium dioxide. J Appl Polym Sci 124: 4038-4046. doi: 10.1002/app.34929
    [50] Yu W, Lan CH, Wang SJ, et al. (2010), Influence of Zinc oxide nanoparticles on the crystallization behavior of electrospun poly(3-hydroxybutyrate-co-3-hydroxyvalerate) nanofibers. Polymer 51: 2403.
    [51] Drew C, Liu X, Ziegler D, et al. (2003) Metal oxide-coated polymer nanofibers. Nano Lett 3: 143-147. doi: 10.1021/nl025850m
    [52] Horzum N, Mari M, Wagner M, et al. (2015) Controlled surface mineralization of metal oxides on nanofibers. RSC Adv 5: 37340-37345. doi: 10.1039/C5RA02140E
    [53] Klabunde KJ, Stark J, Koper O, et al. (1996) Nanocrystals as stoichiometric reagents with unique surface chemistry. J Phys Chem 100: 12142-12153. doi: 10.1021/jp960224x
    [54] Stoimenov PK, Klinger RL, Marchin GL (2002) Metal Oxide Nanoparticles as Bactericidal Agents. Langmuir 18: 6679-6686. doi: 10.1021/la0202374
    [55] Koper O, Klabunde J, Marchin G, et al. (2012) Nanoscale Powders and Formulations with Biocidal Activity Toward Spores and Vegetative Cells of Bacillus Species, Viruses, and Toxins. Curr Microbiol 44: 49-55.
    [56] McDonnell G, Russell AD (1999) Antiseptics and disinfectants: activity, action, and resistance. Clin Microbiol Rev 12: 147-179.
    [57] Kügler R, Bouloussa O, Rondelez F (2005) Evidence of a charge-density threshold for optimum Synthesis and antimicrobial activity of modified poly(glycidyl methacrylate-co-2-hydroxy -ethyl methacrylate) derivatives with quaternary ammonium and phosphonium salts. J Polym Sci Pol Chem 40: 2384-2393.
    [58] Kenawy ER, Abdel-Hay FI, El-Shanshoury A, et al. (2002) Biologically active polymers. V. Synthesis and antimicrobial activity of modified poly(glycidyl methacrylate-co-2-hydroxyethyl methacrylate) derivatives with quaternary ammonium and phosphonium salts. J Polym Sci Part A: Polym Chem 40: 2384-2393.
    [59] Kenawy ER, Mahmoud YAG (2003) Biological active polymers. Macromol Biosci 3: 107-116. doi: 10.1002/mabi.200390016
    [60] Lundin JG, Coneski PN, Fulmer PA, et al. (2014) Relationship between surface concentration of amphiphilic quaternary ammonium biocides in electrospun polymer fibers and biocidal activity. React Funct Polym 77: 39-46. doi: 10.1016/j.reactfunctpolym.2014.02.004
    [61] Arumugam GK, Khan S, Heiden PA (2009) Comparison of the Effects of an Ionic Liquid and Other Salts on the Properties of Electrospun Fibers, 2-Poly(vinyl alcohol). Macromol Mater Eng 294: 45-53. doi: 10.1002/mame.200800199
    [62] You Y, Lee SJ, Min BM, et al. (2006) Effect of solution properties on nanofibrous structure of electrospun poly(lactic-co-glycolic acid). J Appl Polym Sci 99: 1214-1221. doi: 10.1002/app.22602
    [63] Tong HW, Wang M (2011) Electrospinning of poly(hydroxybutyrate-co-hydroxyvalerate) fibrous scaffolds for tissue engineering applications: effects of electrospinning parameters and solution properties. J Macromol Sci 50: 1535-1558. doi: 10.1080/00222348.2010.541008
    [64] Park JA, Kim SB (2015) Preparation and characterization of antimicrobial electrospun poly(vinyl alcohol) nanofibers containing benzyl triethylammonium chloride. React Funct Polym 93: 30-37. doi: 10.1016/j.reactfunctpolym.2015.05.008
    [65] Kim SJ, Nam YS, Rhee DM, et al. (2007) Preparation and characterization of antimicrobial polycarbonate nanofibrous membrane. Eur Polym J 43: 3146-3152. doi: 10.1016/j.eurpolymj.2007.04.046
    [66] Nicosia A, Gieparda W, Foksowicz-Flaczyk J, et al. (2015) Air filtration and antimicrobial capabilities of electrospun PLA/PHB containing ionic liquid. Sep Purif Technol 154: 154-160. doi: 10.1016/j.seppur.2015.09.037
    [67] Buruiana EC, Buruiana T (2002) Recent developments in polyurethane cationomers. Photoisomerization reactions in azoaromatic polycations. J Photoch Photobiol A: Chem 151: 237-252. doi: 10.1016/S1010-6030(02)00181-8
    [68] Uykun N, Ergal I, Kurt H, et al. (2014) Electrospun antibacterial nanofibrous polyvinylpyrrolidone/ cetyltrimethylammonium bromide membranes for biomedical applications. J Bioact Compat Pol 29: 382-397. doi: 10.1177/0883911514535153
    [69] Qun XL, Fanf Y, Shan Y, et al. (2010) Antibacterial Nanofibers of Self-quaternized Block Copolymers of 4-Vinyl Pyridine and Pentachlorophenyl Acrylate. High Perform Polym 22: 359-376. doi: 10.1177/0954008309104776
    [70] Cashion MP, Li X, Geng Y, at al. (2010) Gemini Surfactant Electrospun Membranes. Langmuir 26: 678-683. doi: 10.1021/la902287b
    [71] Singh G, Bittner AM, Loscher S, et al. (2008) Electrospinning of diphenylalanine nanotube. Adv Mater 20: 2332-2336. doi: 10.1002/adma.200702802
    [72] Worley SD, Williams DE (1988) Halamine Water Disinfectants. Crit Rev Environ Control 18: 133-175. doi: 10.1080/10643388809388345
    [73] Song J, Jang J (2014) Antimicrobial polymer nanostructures: Synthetic route, mechanism of action and perspective. Adv Colloid Interface Sci 203: 37-50. doi: 10.1016/j.cis.2013.11.007
    [74] Cerkez I, Worley SD, Broughton RM, et al. Huang (2013) Rechargeable antimicrobial coatings for poly(lactic acid) nonwoven fabrics. Polymer 54: 536-541. doi: 10.1016/j.polymer.2012.11.049
    [75] Chen Z, Sun Y (2005) N-Chloro-Hindered Amines as Multifunctional Polymer Additives. Macromolecules 38: 8116-8119. doi: 10.1021/ma050874b
    [76] Chen Z, Sun Y (2005) Antimicrobial Functions of N-Chloro-Hindered Amines. Polym Preprint 46: 835-836.
    [77] Dong A, Zhang Q, Wang T, et al. (2010) Immobilization of cyclic N-halamine on polystyrene-functionalized silica nanoparticles: synthesis, characterization, and biocidal activity. J Phys Chem C 114: 17298-17303. doi: 10.1021/jp104083h
    [78] Kang J, Han J, Gao Y, et al. (2015) Unexpected Enhancement in Antibacterial Activity of N-Halamine Polymers from Spheres to Fibers. ACS Appl Mater Interfaces 7: 17516-17526. doi: 10.1021/acsami.5b05429
    [79] Sun X, Zhang L, Cao Z, et al. (2010) Electrospun Composite Nanofiber Fabrics Containing Uniformly Dispersed Antimicrobial Agents As an Innovative Type of Polymeric Materials with Superior Antimicrobial Efficacy. ACS Appl Mater Interfaces 2: 952-956. doi: 10.1021/am100018k
    [80] Tan K, Obendorf SK (2007) Fabrication and evaluation of electrospun antimicrobial nylon 6 membranes. J Membrane Sci 305: 287-298. doi: 10.1016/j.memsci.2007.08.015
    [81] Dickerson MB, Sierra AA, Bedford NM, et al. (2013) Keratin-based antimicrobial textiles, films, and nanofibers. J Mater Chem B 1: 5505-5514.
    [82] Fan X, Jiang Q, Sun Z, et al. (2015) Preparation and Characterization of Electrospun Antimicrobial Fibrous Membranes Based on Polyhydroxybutyrate (PHB). Fiber Polym 16: 1751-1758. doi: 10.1007/s12221-015-5108-1
    [83] Ignatova M, Rashkov I, Manolova N (2013) Drug-loaded electrospun materials in wound-dressing applications and in local cancer treatment. Expert Opin Drug Del 10: 469-483. doi: 10.1517/17425247.2013.758103
    [84] Kim K, Luu YK, Chang C et al. (2004) Incorporation and controlled release of a hydrophilic antibiotic using poly(lactide-co-glycolide)-based electrospun nanofibrous scaffolds. J Control Release 98: 47-56. doi: 10.1016/j.jconrel.2004.04.009
    [85] Yoo HS, Kim TG, Park TG (2009) Surface-functionalized electrospun nanofibers for tissue engineering and drug delivery. Adv Drug Deliver Rev 61: 1033-1042. doi: 10.1016/j.addr.2009.07.007
    [86] Zong XH, Li S, Chen E, at al. (2004) Prevention of postsurgery-induced abdominal adhesions by electrospun bioabsorbable nanofibrous poly(lactide-co-glycolide)-based membranes. Ann Surg 240: 910-915. doi: 10.1097/01.sla.0000143302.48223.7e
    [87] Hong Y, Fujimoto K, Hashizume R, et al. (2008) Generating elastic, biodegradable polyurethane/poly(lactide-co-glycolide) fibrous sheets with controlled antibiotic release via two-stream electrospinning. Biomacromolecules 9: 1200-1207. doi: 10.1021/bm701201w
    [88] Thakur RA, Florek CA, Kohn J, et al. (2008) Electrospun nanofibrous polymeric scaffold with targeted drug release profiles for potential application as wound dressing. Int J Pharm 364: 87-93. doi: 10.1016/j.ijpharm.2008.07.033
    [89] Gilchrist SE, Lange D, Letchford DK, et al. (2013) Fusidic acid and rifampicin co-loaded PLGA nanofibers for the prevention of orthopedic implant associated infections. J Control Release 170: 64-73. doi: 10.1016/j.jconrel.2013.04.012
    [90] Qi R, Guo R, Shen M, et al. (2010) Electrospun poly(lactic-co-glycolic acid)/halloysite nanotube composite nanofibers for drug encapsulation and sustained release. J Mater Chem 20: 10622-10629. doi: 10.1039/c0jm01328e
    [91] Moghe AK, Gupta BS (2008) Co‐axial Electrospinning for Nanofiber Structures: Preparation and Applications. Polym Rev 48: 353-377. doi: 10.1080/15583720802022257
    [92] Viseras C, Cerezo P, Sanchez R, et al. (2010) Current challenges in clay minerals for drug delivery. Appl Clay Sci 48: 291-295. doi: 10.1016/j.clay.2010.01.007
    [93] 
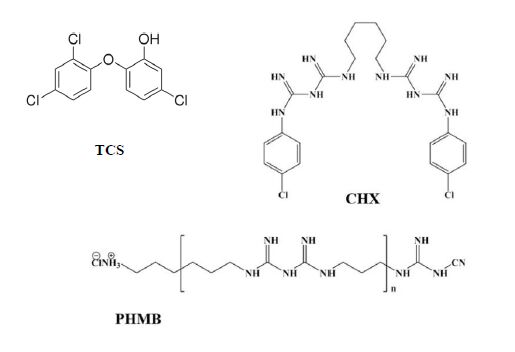
McMurry LM, Oethinger M, Levy SB (1998) Triclosan targets lipid synthesis. Nature 394: 531-532. doi: 10.1038/28970
    [94] Green JBD, Fulghum T, Nordhaus MA (2011, Immobilized antimicrobial agents: a critical perspective, In: Science Against Microbial Pathogens: Communicating Current Research and Technological Advances, Formatex Microbiology Books Series, Méndez-Vila E, Ed., Badajoz (Spain).
    [95] Kaehn K (2010) Polihexanide: A Safe and Highly Effective Biocide. Skin Pharmacol Physiol 23: 7-16. doi: 10.1159/000318237
    [96] Gilbert P, Pemberton D, Wilkinson DE (1990) Synergism within polyhexamethylene biguanide biocide formulations. J Appl Bacteriol 69: 593-598. doi: 10.1111/j.1365-2672.1990.tb01553.x
    [97] 
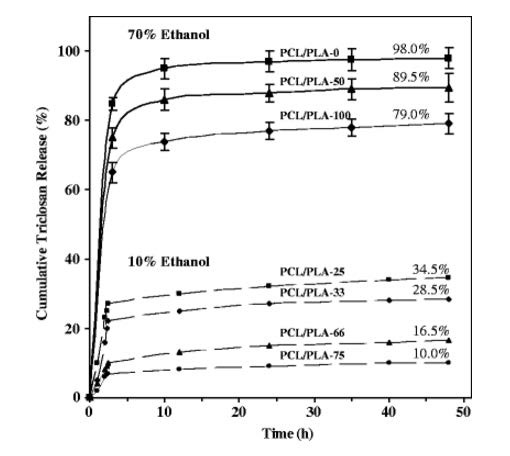
del Valle LJ, Camps R, Díaz A, et al. (2011) Electrospinning of polylactide and polycaprolactone mixtures for preparation of materials with tunable drug release properties. J Polym Res 18: 1903-1917. doi: 10.1007/s10965-011-9597-3
    [98] del Valle LJ, Díaz A, Royo M, et al. (2012) Biodegradable polyesters reinforced with triclosan loaded polylactide micro/nanofibers: Properties, release and biocompatibility. Express Polym Lett 6: 266-282. doi: 10.3144/expresspolymlett.2012.30
    [99] 
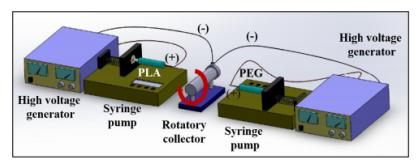
Llorens E, Bellmunt S, del Valle LJ, et al. (2014) Scaffolds constituted by mixed polylactide and poly(ethylene glycol) electrospun microfibers. J Polym Res 21: 603. doi: 10.1007/s10965-014-0603-4
    [100] Llorens E, Ibañez H, del Valle LJ, et al. (2015) Biocompatibility and drug release behavior of scaffolds prepared by coaxial electrospinning of poly(butylene succinate) and polyethylene glycol. Mater Sci Eng C 49: 472-484. doi: 10.1016/j.msec.2015.01.039
    [101] Llorens E, del Valle LJ, Puiggalí J (2015) Electrospun scaffolds of polylactide with a different enantiomeric content and loaded with anti-inflammatory and antibacterial drugs. Macromol Res 23: 636-648. doi: 10.1007/s13233-015-3082-5
    [102] Veiga M, Merino M, Cirri M. et al. (2005) Comparative study on triclosan interactions in solution and in the solid state with natural and chemically modified cyclodextrins. J Incl Phenom Macrocycl Chem 53: 77-83. doi: 10.1007/s10847-005-1047-6
    [103] 
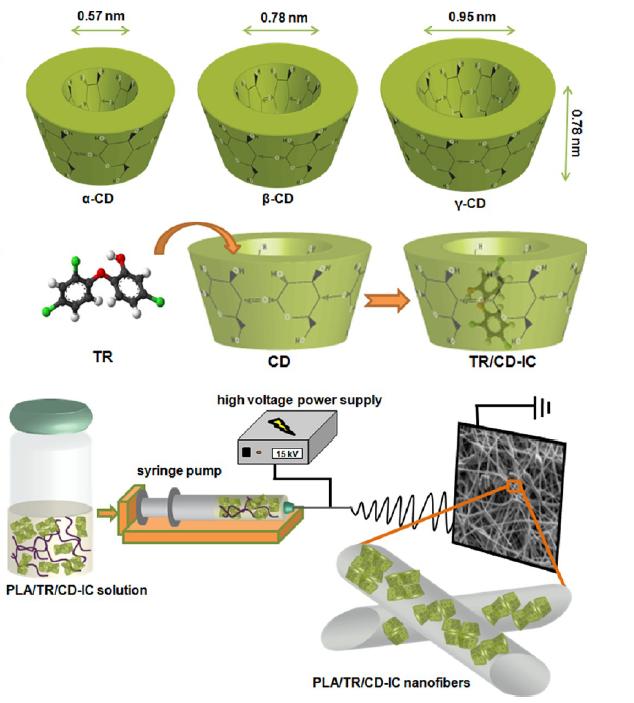
Kayaci F, Umu OCO, Tekinay T, et al. (2013) Antibacterial electrospun Poly(lactic acid) (PLA) nanofibrous webs incorporating triclosan/cyclodextrin inclusion Complexes. J Agric Food Chem 61: 3901-3908. doi: 10.1021/jf400440b
    [104] Celebioglu A, Umu OCO, Tekinay T, et al. (2014) Antibacterial electrospun nanofibers from triclosan/cyclodextrin inclusion complexes. Colloid Surface B 116: 612-619. doi: 10.1016/j.colsurfb.2013.10.029
    [105] Chen L, Bromberg L, Hatton TA (2008) Electrospun cellulose acetate fibers containing chlorhexidine as a bactericide. Polymer 49: 1266-1275. doi: 10.1016/j.polymer.2008.01.003
    [106] Ignatova M, Stoilova O, N Manolova N, et al. (2010) Electrospun mats from styrene/maleic anhydride copolymers: Modification with amines and assessment of antimicrobial activity. Macromol Biosci 10: 944-954. doi: 10.1002/mabi.200900433
    [107] Fernandes JG, Correia DM, Botelho G, et al. (2014) PHB-PEO electrospun fiber membranes containing chlorhexidine for drug delivery applications. Polym Test 34: 64-71. doi: 10.1016/j.polymertesting.2013.12.007
    [108] del Valle LJ, Roa M, Díaz A, et al. (2012) Electrospun nanofibers of a degradable poly(ester amide). Scaffolds loaded with antimicrobial agents. J Polym Res 19: 9792.
    [109] Díaz A, Katsarava R, Puiggalí J (2014) Synthesis, properties and applications of biodegradable polymers derived from diols and dicarboxylic Acids: From Polyesters to poly(ester amide)s. Int J Mol Sci 15: 7064-7123. doi: 10.3390/ijms15057064
    [110] Rodríguez-Galán A, Franco L, Puiggalí J (2011) Degradable poly(ester amide)s for biomedical applications. Polymers 3: 65-99.
    [111] Murase SK, del Valle LJ, Kobauri S, et al. (2015) Electrospun fibrous mats from a L-phenylalanine based poly(ester amide): Drug delivery and accelerated degradation by loading enzymes. Polym Degrad Stab 119: 275-287. doi: 10.1016/j.polymdegradstab.2015.05.018
    [112] Díaz A, del Valle LJ, Tugushi D, et al. (2015) New poly(ester urea) derived from L-leucine: Electrospun scaffolds loaded with antibacterial drugs and enzymes. Mater Sci Eng C 46: 450-462. doi: 10.1016/j.msec.2014.10.055
    [113] Saha K, Butola BS, Joshi M (2014) Drug-loaded polyurethane/clay nanocomposite nanofibers for topical drug-delivery application. J Appl Polym Sci 131: 40230.
    [114] Llorens E, Calderón S, del Valle LJ, et al. (2015) Polybiguanide (PHMB) loaded in PLA scaffolds displaying high hydrophobic, biocompatibility and antibacterial properties. Mater Sci Eng C 50: 74-84. doi: 10.1016/j.msec.2015.01.100
    [115] Dash M, Chiellini F, Ottenbrite RM, et al. (2007) Chitosan-a versatile semi-synthetic polymer in biomedical applications. Prog Polym Sci 36: 981-1014.
    [116] Fischer TH, Bode AP, Demcheva M, et al. (2007) Hemostatic properties of glucosamine-based materials. J Biomed Mater Res A 80: 167-174.
    [117] Muzzarelli RAA, Belcher R, Freisers H, In: Chitosan in natural chelating polymer; alginic acid, chitin and chitosan, Pergamon Press, Oxford, Pergamon Press, Oxford, 1973, 144-176.
    [118] Geng X, Kwon OH, Jang J (2005) Electrospinning of chitosan dissolved in concentrated acetic acid solution. Biomaterials 26: 5427-5432. doi: 10.1016/j.biomaterials.2005.01.066
    [119] Spasova M, Manolova N, Paneva D, et al (2004) Preparation of chitosan-containing nanofibres by electrospinning of chitosan/poly(ethylene oxide) blend solutions. e-Polymers 4: 624-635.
    [120] Bhattaraia B, Edmondson D, Veiseh O, et al. (2005) Electrospun chitosan-based nanofibers and their cellular compatibility. Biomaterials 26: 6176-6184. doi: 10.1016/j.biomaterials.2005.03.027
    [121] Ignatova M, Starbova K, Markova N, et al. (2006) Electrospun nano-fibre mats with antibacterial properties from quaternised chitosan and poly(vinyl alcohol). Carbohyd Res 341: 2098-2107. doi: 10.1016/j.carres.2006.05.006
    [122] Min BM, Lee SW, Lim JN, et al. (2004) Chitin and chitosan nanofibers: Electrospinning of chitin and deacetylation of chitin nanofibers. Polymer 45: 7137-7142. doi: 10.1016/j.polymer.2004.08.048
    [123] Ohkawa K, Cha D, Kim H, et al. (2004) Electrospinning of chitosan. Macromol Rapid Comm 25: 1600-1605. doi: 10.1002/marc.200400253
    [124] Neamnark A, Rujiravaniti R, Supaphol P (2006) Electrospinning of hexanoyl chitosan. Carbohydrate. Polymers 66: 298-305. doi: 10.1016/j.carbpol.2006.03.015
    [125] Homayoni H, Ravandi SH, Valizadeh M (2009) Electrospinning of chitosan nanofibers: Processing optimization. Carbohyd Polym 77: 656-661. doi: 10.1016/j.carbpol.2009.02.008
    [126] Zong X, Kim K, Fang D, et al. (2002) Structure and process relationship on electrospun bioabsorbable nanofiber membranes. Polymer 43: 4403-4412. doi: 10.1016/S0032-3861(02)00275-6
    [127] Au HT, Pham LN, Vu THT, et al. (2012) Fabrication of an antibacterial non-woven mat of a poly(lactic acid)/chitosan blend by electrospinning. Macromol Res 20: 51-58. doi: 10.1007/s13233-012-0010-9
    [128] Shalumon KT, Anulekha KH, Girish CM, et al. (2010) Single step electrospinning of chitosan/poly(caprolactone) nanofibers using formic acid/acetone solvent mixture. Carbohyd Polym 80: 413-417. doi: 10.1016/j.carbpol.2009.11.039
    [129] Cooper A, Oldinski R, Ma H, et al. (2013) Chitosan-based nanofibrous membranes for antibacterial filter applications. Carbohyd Polym 92: 254-259. doi: 10.1016/j.carbpol.2012.08.114
    [130] Zheng H, Du Y, Yu J, et al. (2001) Preparation and characterization of chitosan/poly(vinyl alcohol) blend fibers. J Appl Polym Sci 80: 2558-2565. doi: 10.1002/app.1365
    [131] Chuang WY, Young TH, Yao CH, et al. (1999) Properties of the poly(vinyl alcohol)/chitosan blend and its effect on the culture of fibroblast in vitro. Biomaterials 20: 1479-1487. doi: 10.1016/S0142-9612(99)00054-X
    [132] Jia YT, Gong J, Gu XH, et al. (2007) Fabrication and characterization of poly(vinyl alcohol)/chitosan blend nanofibers produced by electrospinning method. Carbohyd Polym 67: 403-409. doi: 10.1016/j.carbpol.2006.06.010
    [133] Zhang H, Li S, White CJB, et al. (2009) Studies on electrospun nylon-6/chitosan complex nanofiber interactions. Electrochim Acta 54: 5739-5745. doi: 10.1016/j.electacta.2009.05.021
    [134] Lin SJ, Hsiao WU, Jee SH, et al. (2006) Study on the effects of nylon–chitosan-blended membranes on the spheroid-forming activity of human melanocytes. Biomaterials 27: 5079-5088. doi: 10.1016/j.biomaterials.2006.05.035
    [135] Ma Z, Kotaki M, Yong T, et al. (2005) Surface engineering of electrospun polyethylene terephthalate (PET) nanofibers towards development of a new material for blood vessel engineering. Biomaterials 26: 2527-2536. doi: 10.1016/j.biomaterials.2004.07.026
    [136] Jung KH, Huh MW, Meng W, et al. (2007) Preparation and antibacterial activity of PET/chitosan nanofibrous mats using an electrospinning technique. J Appl Polym Sci 105: 2816-2823. doi: 10.1002/app.25594
    [137] An J, Zhang H, Zhang JT, et al. (2009) Preparation and antibacterial activity of electrospun chitosan/poly(ethylene oxide) membranes containing silver nanoparticles. Colloid Polym Sci 287: 1425-1434. doi: 10.1007/s00396-009-2108-y
    [138] Zhuang XP, Cheng BW, Kang WM, et al. (2010) Electrospun chitosan/gelatin nanofibers containing silver nanoparticles. Carbohyd Polym 82: 524-527. doi: 10.1016/j.carbpol.2010.04.085
    [139] Cai ZX, Mo XM, Zhang KH, et al. (2010) Fabrication of chitosan/silk fibroin composite nanofibers for wound dressing applications. Int J Mol Sci 11: 3529-3539. doi: 10.3390/ijms11093529
    [140] Alipour SM, Nouri M, Mokhtari J, et al. (2009) Electrospinning of poly(vinyl alcohol)–water-soluble quaternized chitosan derivative blend. Carbohyd Res 344: 2496-2501. doi: 10.1016/j.carres.2009.10.004
    [141] Fu GD, Yao F, Li Z, et al. (2008) Solvent-resistant antibacterial microfibers of self-quaternized block copolymers from atom transfer radical polymerization and electrospinning. J Mater Chem 18: 859-867. doi: 10.1039/b716127a
    [142] Parfitt T (2005) Georgia: an unlikely stronghold for bacteriophage therapy. The Lancet 365: 2166-2167. doi: 10.1016/S0140-6736(05)66759-1
    [143] Sulakvelidze A, Kutter E (2005) Bacteriophage therapy in humans, In: Bacteriophages: Biology and Applications, Kutter E, Sulakvelidze A, Eds., CRC Press, Boca Raton, FL, 381-436.
    [144] Kutter E, De Vos D, Gvasalia G, et al. (2010) Phage therapy in clinical practice: treatment of human infections. Curr Pharm Biotechnol 11: 69-86. doi: 10.2174/138920110790725401
    [145] Abedon S, Kuhl S, Blasdel B, et al. (2011) Phage treatment of human infections. Bacteriophage 1: 66-85. doi: 10.4161/bact.1.2.15845
    [146] FDA (2006) FDA approval of Listeria-specific bacteriophage preparation on ready-to-eat (RTE) meat and poultry products. FDA, Washington, DC.
    [147] Frykberg RG, Armstrong DG, Giurini J, et al. (2000) Diabetic foot disorders: a clinical practice guideline. J Foot Ankle Surg 39: S1-S60. doi: 10.1016/S1067-2516(00)80057-5
    [148] Anany H, Chen W, Pelton R (2011) Biocontrol of Listeria monocytogenes and Escherichia coli O157:H7 in Meat by Using Phages Immobilized on Modified Cellulose Membranes. Appl Environ Microb 77: 6379-6387. doi: 10.1128/AEM.05493-11
    [149] Markoishvili K, Tsitlanadze G, Katsarava R, et al. (2002) A novel sustained-release matrix based on biodegradable poly(ester amide)s and impregnated with bacteriophages and an antibiotic shows promise in management of infected venous stasis ulcers and other poorly healing wounds. Int J Dermatol 41: 453-458. doi: 10.1046/j.1365-4362.2002.01451.x
    [150] Katsarava R, Alavidze Z (2004) Polymer Blends as Biodegradable Matrices for Preparing Biocomposites, US Patent 6,703,040 (Assigned to Intralytix, Inc.).
    [151] Katsarava R, Gomurashvili Z (2011) Biodegradable Polymers Composed of Naturally Occurring α-Amino Acids, In: Handbook of Biodegradable Polymers—Isolation, Synthesis, Characterization and Applications. Lendlein A, Sisson A, Eds., Wiley-VCH, Verlag GmbH & Co KGaA, Ch. 5.
    [152] Jikia D, Chkhaidze N, Imedashvili E, et al. (2005) The use of a novel biodegradable preparation capable of the sustained release of bacteriophages and ciprofloxacin, in the complex treatment of multidrug - resistant Staphylococcus aureus-infected local radiation injuries caused by exposure to Sr90. Clin Exp Dermatol 30: 23-26. doi: 10.1111/j.1365-2230.2004.01600.x
    [153] Puapermpoonsiri U, Spencer J, van der Walle CF (2009) A freeze-dried formulation of bacteriophage encapsulated in biodegradable microspheres. Eur J Pharm Biopharm 72: 26-33. doi: 10.1016/j.ejpb.2008.12.001
    [154] Gervais L, Gel M, Allain B, et al. (2007) Immobilization of biotinylated bacteriophages on biosensor surfaces. Sensor Actuat B-Chem 125: 615-621. doi: 10.1016/j.snb.2007.03.007
    [155] Nanduri V, Balasubramanian S, Sista S, et al. (2007) Highly sensitive phage-based biosensor for the detection of β-galactosidase. Anal Chim Acta 589: 166-172. doi: 10.1016/j.aca.2007.02.071
    [156] Tawil N, Sacher E, Rioux D, et al. (2015) Surface Chemistry of Bacteriophage and Laser Ablated Nanoparticle Complexes for Pathogen Detection. J Phys Chem C 119: 14375-14382.
    [157] Sun W, Brovko L, Griffiths M (2001) Food-borne pathogens. Use of bioluminescent salmonella for assessing the efficiency of Constructed phage-based biosorbent. J Ind Microbiol Biot 27: 126-128.
    [158] Cademartiri R, Anany H, Gross I, et al. (2010). Immobilization of bacteriophages on modified silica particles. Biomaterials 31: 1904-1910. doi: 10.1016/j.biomaterials.2009.11.029
    [159] Bennett AR, Davids FGC, Vlahodimou S, et al. (1997) The use of bacteriophage-based systems for the separation and concentration of Salmonella. J Appl Microbiol 83: 259-265. doi: 10.1046/j.1365-2672.1997.00257.x
    [160] Pearson HA, Sahukhal GS, Elasri MO, et al. (2013) Phage-Bacterium War on Polymeric Surfaces: Can Surface-Anchored Bacteriophages Eliminate Microbial Infections? Biomacromolecules 14: 1257-1261. doi: 10.1021/bm400290u
    [161] Dai M, Senecal A, Nugen SR (2014) Electrospun water-soluble polymer nanofibers for the dehydration and storage of sensitive reagents. Nanotechnology 25: 225101. doi: 10.1088/0957-4484/25/22/225101
    [162] Korehei R, Kadla J (2011) Incorporating pre-encapsulated bacteriophage in electrospun fibres, 16th International Symposium on Wood, Fiber and Pulping Chemistry, Tianjin, People’s Republic of China. Proceedings ISWFPC 2: 1302-1306.
    [163] Lee SW, Belcher AM (2004) Virus-based fabrication of micro- and nanofibers using electrospinning. J Nano Lett 4: 387-390. doi: 10.1021/nl034911t
    [164] Salalha W, Kuhn J, Dror Y, et al. (2006) Encapsulation of bacteria and viruses in electrospun nanofibers. Nanotechnology 17: 4675-4681. doi: 10.1088/0957-4484/17/18/025
    [165] Korehei R, Kadla J (2013) Incorporation of T4 bacteriophage in electrospun fibres. J Appl Microbiol 114: 1425-1434. doi: 10.1111/jam.12158
  • This article has been cited by:

    1. Laidson P. Gomes, Sandra I. Anjo, Bruno Manadas, Ana V. Coelho, Vania M. F. Paschoalin, Proteomic Analyses Reveal New Insights on the Antimicrobial Mechanisms of Chitosan Biopolymers and Their Nanosized Particles against Escherichia coli, 2019, 21, 1422-0067, 225, 10.3390/ijms21010225
    2. Clifford W. Sandlin, Song Gu, Jun Xu, Charuhas Deshpande, Michael D. Feldman, Matthew C. Good, Victoria Lawson, Epithelial cell size dysregulation in human lung adenocarcinoma, 2022, 17, 1932-6203, e0274091, 10.1371/journal.pone.0274091
    3. Nkrumah A. Grant, Rohan Maddamsetti, Richard E. Lenski, Maintenance of Metabolic Plasticity despite Relaxed Selection in a Long-Term Evolution Experiment with Escherichia coli, 2021, 198, 0003-0147, 93, 10.1086/714530
    4. Tess F Hutchinson, Adam J Kessler, Wei Wen Wong, Puspitaningsih Hall, Pok Man Leung, Thanavit Jirapanjawat, Chris Greening, Ronnie N Glud, Perran L M Cook, Microorganisms oxidize glucose through distinct pathways in permeable and cohesive sediments, 2024, 18, 1751-7362, 10.1093/ismejo/wrae001
    5. Muhammad Yasir, Nicholas M. Thomson, A. Keith Turner, Mark A. Webber, Ian G. Charles, Overflow metabolism provides a selective advantage to Escherichia coli in mixed cultures, 2024, 74, 1869-2044, 10.1186/s13213-024-01760-z
    6. Anshuman Swain, Alan J. Kaufman, Marcin Kalinowski, Stephanie A. Yarwood, William F. Fagan, Were Neoarchean atmospheric methane hazes and early Paleoproterozoic glaciations driven by the rise of oxygen in surface environments?, 2024, 643, 0012821X, 118900, 10.1016/j.epsl.2024.118900
    7. Hossein Sedighikamal, Shohreh Mashayekhan, Critical assessment of quenching and extraction/sample preparation methods for microorganisms in metabolomics, 2025, 21, 1573-3890, 10.1007/s11306-025-02228-0
  • Reader Comments
  • © 2016 the Author(s), licensee AIMS Press. This is an open access article distributed under the terms of the Creative Commons Attribution License (http://creativecommons.org/licenses/by/4.0)
通讯作者: 陈斌, bchen63@163.com
  • 1. 

    沈阳化工大学材料科学与工程学院 沈阳 110142

  1. 本站搜索
  2. 百度学术搜索
  3. 万方数据库搜索
  4. CNKI搜索

Metrics

Article views(15289) PDF downloads(2211) Cited by(36)

Figures and Tables

Figures(23)

/

DownLoad:  Full-Size Img  PowerPoint
Return
Return

Catalog