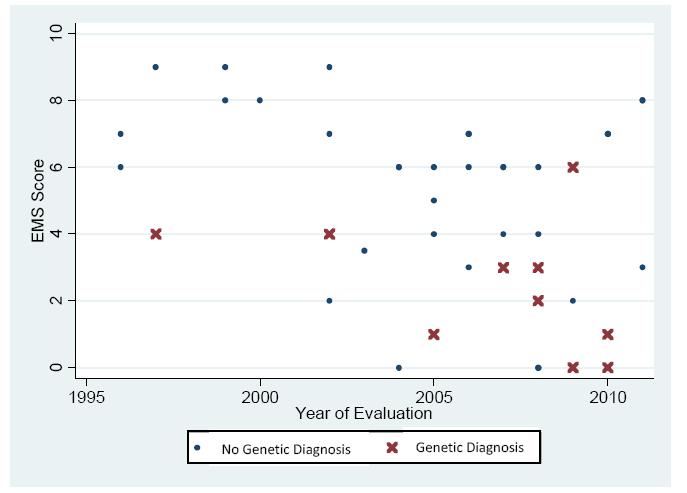
Genetic testing is judiciously applied to individuals with Disorders of Sex Development (DSD) and so it is necessary to identify those most likely to benefit from such testing. We hypothesized that the external masculinization score (EMS) is inversely associated with the likelihood of finding a pathogenic genetic variant. Patients with 46,XY DSD from a single institution evaluated from 1994-2014 were included. Results of advanced cytogenetic and gene sequencing tests were recorded. An EMS score (range 0-12) was assigned to each patient according to the team's initial external genitalia physical examination. During 1994-2011, 44 (40%) patients with 46,XY DSD were evaluated and underwent genetic testing beyond initial karyotype; 23% (10/44) had a genetic diagnosis made by gene sequencing or array. The median EMS score of those with an identified pathogenic variant was significantly different from those in whom no confirmed genetic cause was identified [median 3 (95% CI, 2-6) versus 6 (95% CI, 5-7), respectively (p = 0.02)], but limited to diagnoses of complete or partial androgen insensitivity (8/10) or 5-reductase deficiency (2/10). In the modern cohort (2012-2014), the difference in median EMS in whom a genetic cause was or was not identified approached significance (p = 0.05, median 3 (95% CI, 0-7) versus 7 (95% CI, 6-9), respectively). When all patients from 1994-2014 are pooled, the EMS is significantly different amongst those with compared to those without a genetic cause (median EMS 3 vs. 6, p < 0.02). We conclude that an EMS of 3 or less may indicate a higher likelihood of identifying a genetic cause of 46,XY DSD and justify genetic screening, especially when androgen insensitivity is suspected.
1.
Introduction
The pandemic caused by COVID-19 affected the world in a significant way, not only in terms of people's health but also from an economic/financial perspective [1,2,3]. Aspects related to marketing and the social responsibility of organizations were also studied [4,5]. Much research has been carried out in which behavioral, environmental, psychological, and social issues have been discussed [6,7,8,9]. Hospitals have had to change the management of their inventories and models have been proposed in the literature to avoid shortages and supply medicines to patients on time [10].
From the perspective of the dynamics of the phenomenon generated by SARS-Cov2, compartmental models are a strategy widely used to analyze the evolution of an epidemic [11]. Individuals in the population under study are divided into compartments according to their characteristics. This type of models is utilized to predict the spread of the epidemic under different scenarios as well as the introduction of large-scale vaccination [12]. The governments and most important pharmaceutical companies in the world started to work quickly to find a vaccine from the beginning of the pandemic which was available at the end of 2020. However, in South America the vaccination process began in the first months of 2021. Many researchers have worked on issues related to COVID-19 vaccination. Among others, in [13,14] it was discussed the impact of vaccination in containing the COVID-19 epidemic. In [15], the spread of infections in Italy was analyzed in the midst of vaccination and appearance of new variants.
In [16], through multivariate regression, the relationship between the different macro-economic factors of fully vaccinated health and care personnel [17] between February and June 2021 was investigated. In [18], it were identified post-vaccination risk factors for COVID-19 infection using univariate and multivariate logistic regression of data collected in the United Kingdom between March 2020 and July 2021. In [19], it was used logistic regression to analyze individuals at risk who are reluctant to be vaccinated against COVID-19 utilizing data collected in the last quarter of 2021 in Germany. In [20], it was studied the most important statistical characteristics of populations in two regions relative to total COVID-19 immunization using the maximum likelihood estimation of the parameters of a probability model. In [21], a cluster analysis was carried out using the K-means algorithm on data of the proportion of daily residents in the home, the trips made daily and the dose of vaccines per capita in the 50 US states. In that work, a multivariate regression analysis (fixed effects model) was also performed from panel data on temporally segmented observations.
In [22], it was presented a longitudinal study using multivariate logistic regression on hesitancy to get vaccinated, social norms and acceptance of the vaccine in the US, a country with a high degree of access to inoculation against COVID-19. In [23], it was applied a canonical correlation analysis to data obtained from a cohort of individuals which includes measures of physical and mental wellness of children and their parents as well as demographic and socioeconomic data. In [24], a cluster analysis was conducted to identify patterns of behavior in vaccine data in Brazilian states. In [25], probabilistic vaccine projections about the spread of SARS-CoV-2 infections were established. In [26], the authors identified the key issues associated with vaccinations in the presence of misinformation in rural areas of developing countries. In [27], the barriers to vaccination faced by socially vulnerable groups were analyzed using univariate and multivariate multilevel logistic regression in the Ile-de-France region and in Marseille with data collected between November and December 2021.
In [28], the reported benefits of inoculation on the COVID-19 mortality rate were evaluated by stepwise linear regression isolating the independent effects of treatment and associated comorbidities separating out bias and uncovering beneficial factors. In [29], a multidimensional approach using logistic regression and linear regression was used to identify relationships between the demographic aspects of participants and their knowledge, attitudes and practices. In [30], a multivariate model was utilized to study the association between the variation of vital parameters with lunar cycles in patients with COVID-19 hospitalized in Oklahoma, US, between February 2020 and August 2021. In [31,32], mathematical models were proposed to optimize the vaccination process. In [33,34,35,36,37], a multivariate analysis in research related to SARS-COV2 was utilized. In [38], the use of K-means was applied to complement a component analysis that was carried out to classify countries according to the number of infected people. Further literature covering related topics can be found in Table 1.
The objective in this work is to analyze data on vaccinated people and deaths due to COVID-19 during the years 2021 and 2022 in ten South American countries: Argentina (ARG), Bolivia (BOL), Brazil (BRA), Chile (CHI), Colombia (COL), Ecuador (ECU), Peru (PER), Paraguay (PRY), Uruguay (URY) and Venezuela (VEN). As a result of the analysis, the countries were classified into groups and these groups were characterized. The statistical methods employed are component analysis and the K-means method. All computational experiments were conducted using the $\texttt{R}$ software [59].
To show the content in a proper way, the remainder of this document has been distributed as follows. In Section 2, we introduce the materials and methods utilized in this work. The results of our study are presented in Section 3. In particular, the principal component analysis (PCA) can be seen in Subsection 3.1; in Subsection 3.2, a sparse technique known as disjoint principal component analysis (DPCA) is used, which facilitates the grouping and characterization of the countries; and in Subsection 3.3, we present the K-means analysis, which is employed to complement the component analysis. In Section 4, we summarize all the results obtained from this statistical study. Possible future work and some motivations are also discussed in this final section.
2.
Materials and methods
To carry out the statistical analysis in this research, we have downloaded the data from the website https://ourworldindata.org/coronavirus (accessed on 13 June 2023). The period of this study is two years, from January 2021 to December 2022. The data is divided into two parts: number of vaccinated cases with full doses and number of deaths due to COVID-19. Table 2 shows the vaccinated data matrix. In Table 3, we can see the death data matrix. For each matrix, in the columns we have the countries and in the rows we have the months. In each matrix entry we have the number of inhabitants per million. We have included plots corresponding to Tables 2 and 3 in logarithmic scale in Figure 1.
2.1. Measures of variables
The two data matrices shown in the previous section are of order $ 24 \times 10 $ (24 months and 10 countries) whose entries are non-negative real numbers. For the dimensional reduction that was carried out to classify the countries into groups we have used the PCA and the K-means methods. With both methods, we have utilized the countries as variables and the months as entities. In the case of PCA, the components define the groups of countries. In the case of K-means, the clusters define the groups of countries. In the next section, we present the procedure that was employed both with the vaccinated matrix and with the death matrix.
2.2. Models and data analysis procedure
Next, we propose a procedure that allows us to classify the countries of South America into groups. Our procedure is based on the PCA and K-means methods. We can see this procedure in Algorithm 1, which is used for analyzing COVID-19 data of the number of vaccinated cases and the number of deaths. We want to highlight step 9 in this 10-step algorithm. In step 9, a comparison of the country grouping obtained by the PCA method and by the K-means method is performed.
A detailed background of the PCA and the component rotation methods can be seen in [60]. In particular, the calculation of rotated components with the VARIMAX method may be found in [61]. In [62] we can see how to calculate disjoint components. DPCA is a recent sparse technique that facilitates the interpretation of the components. During the last years some researchers have proposed algorithms to calculate disjoint components. In [38,63], we observe a statistical study where DPCA was used. For full details of the DPCA method, see [62]. The DPCA method has even extended for three-way matrices as we can see in [64,65]. A background of the K-means method is presented in [66]. In [38,67] we find applications of the K-means method to study COVID-19 data.
3.
Results and discussion
3.1. Principal component analysis
PCA was used to classify the selected countries. What are the countries that have common characteristics? What are the countries with different characteristics? These research questions are the ones we want to answer for vaccinated people and for deaths due to COVID-19. Next, we discuss the results obtained from the PCA. Figure 2a shows the cumulative proportional variance plot for vaccinated COVID-19 cases. Figure 2b displays the same type of plot but for COVID-19 deaths. Regarding the number of components to be computed, we utilized three components to obtain an explained variability of around 90%. In [38], we can see a similar justification for selecting the number of components. The three components capture 89.91% of the variability of the data in the case of the COVID-19 vaccinated cases and 86.16% for COVID-19 deaths.
Table 4 reports the three principal components calculated (PC1, PC2, and PC3) with the matrix of vaccinated people and Table 5 for COVID-19 deaths. The corresponding columns show the loadings, that is, the correlations between countries and components. Note that there are countries that have similar loadings (in absolute value) for the different components which makes the interpretation difficult (for example with BOL, COL and PER for vaccinated cases, as well as with BRA, PER and URY for deaths). To improve the interpretation, a VARIMAX rotation [61] was performed (the fit of the model remains) but a clear interpretation was not obtained either vaccinated cases or deaths. For this reason, we decide to use a sparse technique known as DPCA to obtain a better interpretation.
3.2. Disjoint principal component analysis
As we can see in Algorithm 1 that we propose, the disjoint components are used when the classical components and the rotated components do not allow a clear classification of the countries. Did the PCA method allow us to group countries? The response is no. This the reason we employ DPCA. Now, we report the results obtained after applying the DPCA method.
In the last three columns of Table 4, we can see the computed disjoint components (DC1, DC2, and DC3) for vaccinated COVID-19 cases. The variability captured by the three disjoint components is 87.25% with the matrix of vaccinated cases, that is, 2.66% of explained variability was lost which is not significant but we gain in interpretability. The DPCA loading matrix allows us to group the ten countries as follows: (Group 1) ARG, BOL, BRA, COL, PER and VEN; (Group 2) ECU and PRY; and (Group 3) CHI and URY.
In the case of deaths, in the last three columns of Table 5 we can see the calculated disjoint components. The three disjoint components explain 83.27% of the variability of the data, that is, 2.89% of explained variability has been lost which is not significant and we gain in interpretability. Thus, due to the DPCA method we can group the countries in this way: (Group 1) ARG, BOL, COL, ECU, PRY and VEN; (Group 2) BRA, PER and URY; and (Group 3) CHI.
Figure 3a shows the space of the variables (countries) in the case of number of vaccinated cases due to COVID-19 considering two dimensions. The space of the countries with two dimensions regarding the number of COVID-19 deaths can be seen in Figure 3b. In both plots, the countries are distributed in a plane. However, the countries have been grouped considering the results obtained with the DPCA to facilitate interpretation.
Figure 4a presents the number of vaccinated COVID-19 cases for each month of the analysis period while Figure 4b displays the number of COVID-19 deaths. Note that again the countries have been grouped according to the DPCA results. In this way, we can characterize the three groups of countries for COVID-19 vaccinated cases and deaths.
3.3. K-means analysis
Was the country grouping obtained with the components correct? This is the research question that we want to answer with the K-means method. Next, we carry out a K-means analysis [38,66,67] to compare with the results obtained using components. The computations were made with three clusters for COVID-19 vaccinated cases and deaths to make the corresponding contrast. Nevertheless, note that in Figure 5a the silhouette plot suggests three clusters for vaccinated people but in Figure 5b the silhouette plot suggests only two clusters for COVID-19 deaths.
We now proceed with the analysis of the clusters. On one hand, Figure 6a shows the K-means plot applied to the vaccinated matrix. On the other hand, we can see in Figure 6b the plot of the K-means applied to the matrix of deaths.
The groups obtained with the data set of COVID-19 vaccinated cases are: (Group 1) BOL, BRA, COL and PER; (Group 2) ARG, ECU, PRY and VEN; and (Group 3) CHI and URY. When comparing this grouping with the one obtained using components we notice a single difference: ARG and VEN leave Group 1 and move to Group 2.
Regarding the data set of COVID-19 deaths, the countries are grouped as follows: (Group 1) BOL, ECU and VEN; (Group 2) ARG, BRA, COL, PER, PRY and URY; and (Group 3) CHI. Note that BOL, ECU and VEN stayed in Group 1 but the countries ARG, COL and PRY moved from Group 1 to Group 2.
It is important to have two grouping methods to be able to compare the results obtained by both of them. This is what we considered when designing Algorithm 1. The comparative clustering study between the component analysis and the K-means method gave very similar results but there were a couple of differences that were noted above. To conclude, we chose the grouping that was obtained with the components for two reasons: (i) the components have the advantage of representing latent variables that can be characterized and that maximize the variability of the data (in this way the greatest possible amount of information is captured); and (ii) with the K-means method the number of clusters to be built is known in advance, the variables are grouped solely by their similarity (distances) and the quality of the clusters depends on the initialization of the algorithm. In such a case, the use of the K-means method was important because it complemented and helped to confirm the grouping that was obtained using components. In addition, in the case of COVID-19 deaths the number of recommended clusters was two.
3.4. Discussion and summary of results
There are various reasons why countries hastened or delayed the start of the vaccination process as budgets, availability of vaccines, public/private health infrastructure and decision-making capacity, among others. The number of deaths is mainly affected by the vaccination process but the transmission rate of the virus due to people's carelessness is also an important factor with our data capturing all of the above. Algorithm 1 that we propose has the ability to group countries according to how the number of vaccinated cases and the number of deaths change over time. Here, we have a discussion of the groups formed both in COVID-19 vaccinated cases and deaths. For vaccinated people the following is observed:
Group 1: ARG, BOL, BRA, COL, PER and VEN. These countries had a prolonged and sustained vaccination process from May 2021 to April 2022, approximately one year. A significant peak was observed between September 2021 and October 2021. We have characterized this group as "countries that had a moderate start in vaccinating their citizens".
Group 2: ECU and PRY. These countries started the vaccination process late. A first segment is observed from July 2021 to September 2021 with a very important peak in August 2021. We can see a second segment from September 2021 to April 2022 with a peak that is not very pronounced in December 2021. We have characterized this group as "countries that took the longest to start vaccinating their citizens".
Group 3: CHI and URY. These countries quickly started the vaccination process which begins in February 2021 and ends approximately in March 2022. Two peaks of a similar size are observed, the first of them between March and April 2021 and the second one in June 2021. We have characterized this group as "countries that react promptly in vaccinating their citizens".
In the ten countries, the vaccination process was mild in the second semester of 2022. Regarding the number of deaths due to COVID-19 we have to conclude the following:
Group 1: ARG, BOL, COL, ECU, PRY and VEN. In this group, VEN is a special case. The component analysis placed VEN in this group but we believe that this country did not report the correct count of deaths due to COVID-19. Leaving VEN aside, the other countries have a pronounced first peak of deaths between June 2021 and July 2021 with a slight second peak between January 2022 and February 2022. We have characterized this group as "countries with a significant number of COVID-19 deaths in the middle of the year 2021".
Group 2: BRA, PER and URY. These countries presented a considerable peak of deaths between April 2021 and May 2021. There is a second milder peak between February 2022 and March 2022. We have characterized this group as "countries with a considerable number of COVID-19 deaths in the fourth month of the year 2021".
Group 3: CHI. In this group there is only CHI. This country presented an extremely considerable peak of deaths in March 2022. We have characterized this group as "countries with a considerable number of COVID-19 deaths in the third month of the year 2022".
The ten South American countries have in common the fact that approximately, in the second semester of 2022, the number of deaths due to COVID-19 decreased considerably. Other important conclusions are the following:
(i) CHI was the country that best managed the pandemic since it was the first country to start the vaccination process very early in February 2021 and only had a peak of deaths in March 2022. Leaving VEN aside, CHI was the country with the smallest number of COVID-19 deaths per million inhabitants.
(ii) ARG, PER and VEN are the countries that took the longest to start the COVID-19 vaccination process.
(iii) URY had an intensive COVID-19 vaccination period in the months of April, May and June 2021. However, in those same months URY had the largest number of deaths due to COVID-19. URY started the vaccination process quickly. Nonetheless, this did not help to control the significant number of deaths in the first half of 2021.
(iv) PER was the country with the largest number of deaths per million inhabitants. This occurred in the months of March, April, and May 2021. In second position is PRY with a very high peak in June 2021.
(v) ECU had a peak of vaccinated cases between July and August 2021, and in those same months it also had the largest number of deaths per million inhabitants.
This comparative study allowed us to obtain the results that we summarize in Table 6 for COVID-19 vaccinated people and the results that we summarize in Table 7 for deaths due to COVID-19.
4.
Conclusions
In the present study, we have grouped ten South American countries into three groups. These groups have also been constructed and characterized using two criteria. The first criterion is the number of COVID-19 vaccinated people per million inhabitants and the second one is the number of COVID-19 deaths per million inhabitants. The formed groups permitted us to determine those countries that had a similar behavior as well as those countries that had a different behavior. To carry out the statistical analysis of data related to COVID-19 vaccinated cases and deaths we have utilized two methods: (i) principal component analysis and (ii) K-means analysis. As mentioned, all calculations were performed with the $\texttt{R}$ software. These two methods were combined in a procedure that we have proposed and that was summarized in Algorithm 1. We believe that the procedure we have designed can be used by other researchers to classify entities (countries and companies among others) in their studies.
Regarding the vaccination process, the governments of Chile and Uruguay were the first ones to vaccinate their citizens. Obviously, this showed that they were the most responsible countries in the region. The governments of Ecuador and Paraguay are the ones that took the longest to start vaccination. Regarding the number of COVID-19 deaths, Brazil, Peru and Uruguay had a large number of deaths in April 2021.
In the cases of Ecuador and Paraguay, these countries had a considerable peak of deaths in mid-2021. It should be noted that Chile, despite being the first country in South America to start vaccination showed a significant number of deaths in March 2022. In addition, Venezuela was the country that took the longest to start vaccination. However, this country did not present any peak regarding the number of deaths. Despite the restrictions imposed on citizens by the governments of the ten South American countries analyzed, the indiscipline of the people was a factor that raised the number of deaths, even in countries that started the vaccination process early.
Our comparative study where countries were grouped using one or more variables is very important because it allowed us to evaluate the behavior of governments in the face of certain events. In particular, the COVID-19 pandemic has been the most important health event for the last 3-4 years. For this reason, regarding future work we recommend applying the methodology shown in this article to countries that are in other regions of the planet. For example, a study of the vaccination process and deaths due to COVID-19 in Central and North American countries can be carried out as well as in countries from Europe, Asia or Africa. We could also consider incorporating another statistical methods that complement the use of components and the K-means method. Another important future work is to build an $\texttt{R}$ package that includes the two methods used in this work so that diverse practitioners may employ it and make their analyses easier to them when conducting similar studies.
Use of AI tools declaration
The authors declare they have not used artificial intelligence (AI) tools in the creation of this article.
Acknowledgments
The authors thank to the Editors and Reviewers for their valuable comments that helped to improve the quality of this article.
Conflict of interest
The authors declare there are no conflicts of interest.