
Citation: Lynda M. Hegarty, Jacqueline L. Mair, Karen Kirby, Elaine Murtagh, Marie H. Murphy. School-based Interventions to Reduce Sedentary Behaviour in Children: A Systematic Review[J]. AIMS Public Health, 2016, 3(3): 520-541. doi: 10.3934/publichealth.2016.3.520
[1] | Tuan Syaripah Najihah, Mohd Hafiz Ibrahim, A'fifah Abd Razak, Rosimah Nulit, Puteri Edaroyati Megat Wahab . Effects of water stress on the growth, physiology and biochemical properties of oil palm seedlings. AIMS Agriculture and Food, 2019, 4(4): 854-868. doi: 10.3934/agrfood.2019.4.854 |
[2] | A. Nurbekov, A. Akramkhanov, A. Kassam, D. Sydyk, Z. Ziyadaullaev, J.P.A. Lamers . Conservation Agriculture for combating land degradation in Central Asia: a synthesis. AIMS Agriculture and Food, 2016, 1(2): 144-156. doi: 10.3934/agrfood.2016.2.144 |
[3] | Joe Mari J. Maja, James Robbins . Controlling irrigation in a container nursery using IoT. AIMS Agriculture and Food, 2018, 3(3): 205-215. doi: 10.3934/agrfood.2018.3.205 |
[4] | Mohamamd I. Majdalawi, Ansam A. Ghanayem, Amani A. Alassaf, Sabine Schlüter, Mohammed A. Tabieh, Amer Z. Salman, Muhanad W. Akash, Rui C. Pedroso . Economic efficient use of soilless techniques to maximize benefits for farmers. AIMS Agriculture and Food, 2023, 8(4): 1038-1051. doi: 10.3934/agrfood.2023056 |
[5] | Ogunniyi Adebayo, Omonona Bolarin, Abioye Oyewale, Olagunju Kehinde . Impact of irrigation technology use on crop yield, crop income and household food security in Nigeria: A treatment effect approach. AIMS Agriculture and Food, 2018, 3(2): 154-171. doi: 10.3934/agrfood.2018.2.154 |
[6] | Farid Hellal, Hani Mansour, Mohamed Abdel-Hady, Saied El-Sayed, Chedly Abdelly . Assessment water productivity of barley varieties under water stress by AquaCrop model. AIMS Agriculture and Food, 2019, 4(3): 501-517. doi: 10.3934/agrfood.2019.3.501 |
[7] | Florencia G. Palis, R. M. Lampayan, R.J. Flor, E. Sibayan . A multi-stakeholder partnership for the dissemination of alternate wetting and drying water-saving technology for rice farmers in the Philippines. AIMS Agriculture and Food, 2017, 2(3): 290-309. doi: 10.3934/agrfood.2017.3.290 |
[8] | Francisco Jean da Silva Paiva, Geovani Soares de Lima, Vera Lúcia Antunes de Lima, Weslley Bruno Belo de Souza, Lauriane Almeida dos Anjos Soares, Rafaela Aparecida Frazão Torres, Hans Raj Gheyi, Mariana de Oliveira Pereira, Maria Sallydelândia Sobral de Farias, André Alisson Rodrigues da Silva, Reynaldo Teodoro de Fátima, Jean Telvio Andrade Ferreira . Production and postharvest quality of Passiflora edulis Sims under brackish water and potassium doses. AIMS Agriculture and Food, 2024, 9(2): 551-567. doi: 10.3934/agrfood.2024031 |
[9] | Marcello Mastrorilli, Raffaella Zucaro . Towards sustainable use of water in rainfed and irrigated cropping systems: review of some technical and policy issues. AIMS Agriculture and Food, 2016, 1(3): 294-314. doi: 10.3934/agrfood.2016.3.294 |
[10] | Helmi Helmi, Hairul Basri, Sufardi, Helmi Helmi . Analysis of soil water balance and availability on several land use types for hydrological disaster mitigation in Krueng Jreu Sub-watershed. AIMS Agriculture and Food, 2020, 5(4): 950-963. doi: 10.3934/agrfood.2020.4.950 |
During the last 50 years, Iran has faced numerous severe and prolonged droughts, which have significantly threatened water availability in agricultural sector and created economic and social difficulties [1]. The outlooks of long-term climatic forecasts indicate that water shortage in most areas of the country will continue and show that Iran is moving towards water crisis in the future [2,3]. Furthermore, due to the massive gap between the demand and sustainable supply of water, Iran is experiencing widespread water shortage and unprecedented challenges in securing water and food [2] for its growing population, which is projected to reach 92 million by 2050 [4].
Although a significant part of the water scarcity in Iran is attributed to the country's natural climate and impacts of climate change, the mismanagement and government policies over the past few decades have intensified the trend of water scarcity in Iran. The total renewable water resources in Iran have been reported as 106 ± 17% billion cubic meters (BCM) which share of its groundwater is 37 ± 6% BCM [5]. However, the reports indicate total groundwater depletion in Iran is beyond the allowed limits announced by water authorities in Iran [6]. Although less than 6% of the total land area is under irrigated cultivation, the agricultural water requirement accounts for 92% of the total water demands, while the shares of municipal and industrial sectors are 6% and 2%, respectively.
Resolving the water challenges and moving toward the sustainable condition requires a thorough reconsideration of how much water is consumed, especially in the agricultural sector, and making balance between the water demands and renewable water resources under the climate change conditions. Estimation of the water consumption in the agriculture sector and amount of water requirements under climate change impacts are the key elements in the macroplanning related to the supply, allocation and principal of water management [7]. However, the water consumption in agriculture is yet to be determined accurately, and this issue has always been one of the main concerns of water authorities in Iran.
Computation of water consumption in irrigated areas is typically achievable using the simulation of water balance components on a daily basis. The simulation of water balance components is often performed through comprehensive agro-hydrological modeling (CropSyst, HYDRUS, SWAP, SWAT, and AquaCrop) at a farm scale. These models are often too complex in terms of required data, and are not recommended to be applied widely in practice. In contrast to agro-hydrological models, lumped soil water balance-based models (FAO, BUDGET, OSIRI, PILOTE and SIMDualKc) require less soil in-put data with easier crop parameterization, and may employ a simpler procedure for estimating water consumption.
Therefore, the purpose of this study was to develop a national web-based simulation tool in order to estimate the potential water consumption on a national scale. This paper introduces a National Water Portal (NWP) consisting of national climatic, soil and crop databases, simulation model and graphical user interface (GUI) to estimate total water consumption in agriculture on a national scale. The NWP is based on daily water balance and adheres closely to the FAO-56 methodology and can serve as a convenient and effective means to compare net irrigation water requirement (NIR) in different plains and climate conditions.
Iran occupies a region of around 1.648 million km2 (Figure 1a). The total land area of Iran is divided into six main basins which consists of 30 sub-basins (Figure 1b). Each sub-basin is divided into subsequent micro-watersheds/catchments which are called "plains" in this study (Figure 1c). With heights ranging from 25 meters to 5600 meters, the country's diverse geographic areas have produced a wide diversity of climates (Figure 1d). Average annual precipitation for the entire country is roughly 257 mm (370 km3), whereas precipitation can range from as low as 50 mm/year in deserts up to more than 1500 mm/year in the coastal regions of the Caspian Sea and the northern side of the Alborz Mountain range. The total annual precipitation equals 412 BCM (Figure 1b). Most of the rainfall in this country takes place in fall and winter, which is the period of minimum water requirements for crops. In summer, when the water consumption of plants is at its peak, the climate of Iran lacks effective rainfall [6].
The NWP model consists of three distinctive components: a database, a mathematical model, and a graphic user interface. The database stores and retrieves information on climate, soil hydraulic properties, crop characteristics, irrigation systems, and general data representing the soil profiles and synoptic stations for each plain. The structure of the NWP provides easy connection to different types of databases, including climate, soil, crop, and spatial, and enables the estimation of crop water requirement (CWR) and NIR from the farm level to regional level. The graphical user interface (GUI) is the actual frontend of the developed platform and provides easy use by farmers. The structure is designed to be interfaced via the Web to support decision-making in regards with irrigation requirements.
In this model, each plain is considered as a broad farm, and standard irrigation scheduling based on FAO-56 guidelines is implemented to calculate NIR. Synoptic data (including maximum and minimum air temperature, relative humidity, wind speed, sunshine hours, and precipitation) and soil profile data (including total available water, readily available water, and management allowed depletion in upper and lower layers) as well as plant characteristics (125 different crops) and their cultivation area were used as input data into the model. Considering the genetic variety of cultivated crops in each plain, the data used in the modeling belonged to the dominant type. Since the surface irrigation method is still the dominant type of irrigation in Iranian farms and end of each plot is closed by this irrigation, the surface runoff was not considered.
A detailed scheme of the NWP structure is presented in Figure 2. It indicates a schematic view of main components such as database, relations, and available results. The following sections provide a description of a standardized formulation of CWR and NIR computation as implemented in the NWP portal. The methodologies have been compiled from guideline provided by FAO-56.
The soil water balance (i.e., the depletion in the root zone) is calculated at the end of each day using a two-layer lumped model as [9,10]:
Dr,i=Dr,i−1−(P−RO)i−Ii–CRi+ETC,i+Dpi | (1) |
where D(r,i) is the root zone depletion at the end of day i (mm), D(r,i−1) is the root zone depletion at the end of the previous day (i – 1) (mm), Pi is the precipitation on day i (mm), ROi is the runoff from the soil surface on day i (mm), Ii is the net irrigation depth on day i that infiltrates the soil (mm), CRi is the capillary rise from the groundwater table on day i (mm), ET(C,i) is the crop evapotranspiration on day i (mm), and DPi is the water flowing out from the root zone depth.
The soil water balance in the root zone is estimated assuming the soil profile is divided into two layers: the upper layer with a 15 cm thickness where evaporation takes place and the underlying layer that develops from the bottom of the upper layer to the root depth. The underlying layer behaves like a reservoir and its thickness increases as much as roots grow.
NWP estimates crop evapotranspiration (ETc) using a crop coefficient (Kc) multiplied by the reference evapotranspiration (ET0) [9]. The NWP model implements the dual crop coefficient approach to determine the effects of soil evaporation and crop transpiration separately. The approach for the calculation of ETc is implemented as:
ETc = Kc×ET0 | (2) |
Kc=Ke+Kcb | (3) |
where Kcb is the basal crop coefficient and Ke is the evaporative coefficient. Basal crop coefficient (Kcb) describes primarily the crop transpiration component, and direct evaporation from the soil surface is described by the soil evaporation coefficient (Ke). ET0 is the reference evapotranspiration. In NWP, ET0 can be estimated using several empirical to semi-empirical models based on meteorological data availability such as radiation-based model [11], temperature-based model [12], and combination-based model [9].
To draw the basal crop coefficient (Kcb), three values for Kcb are required: Kcb ini, Kcb mid, and Kcb end which represent average values for Kcb during the initial, mid, and late periods of growing season, respectively [9,13].
Kcb:{if{J < Jdev}→Kcb = Kcb iniif{Jdev≤ J < Jmid}→Kcb = Kcb ini+(Kcb mid−Kcb ini)(J−Jdev)Ldevif{Jmid≤ J < Jlate}→Kcb = Kcb midif{Jlate≤ J < Jharv}→Kcb = Kcb mid+(Kcb end−Kcb mid)(J−Jlate)Llateif{J = Jharv}→Kcb = Kcb end | (4) |
where J is the day of the year (1–366), Jdev is number of day of the year at beginning of development period, Jmid is number of day of the year at beginning of midseason period, Jlate is number of day of the year at beginning of late season period, Ldev is length of crop development growth stage (day), and Llate is length of late season growth stage (day).
NWP uses the recommended values for Kcb for the standard conditions (RHmin averaging 45% and with moderate wind speed, averaging 2 (m/s) [9]). The Kcb is adjusted for local climatic conditions where non-standard condition is met based on FAO 56.
The soil evaporation coefficient (Ke) is maximum when the soil surface is wet, following rain or irrigation and canopy is small. Allen (1998) suggested the procedure for calculation of evaporation in the dual Kc methodology using the following equations [9].
Ke = min{Kcbmax×few…, …Kr×(Kcbmax-Kcb)} | (5) |
Kr = max{0…, …TEW-De, i-1TEW-RAW} | (6) |
De, i = De, i-1-(Pi-ROi)-Iifw+Eifew+Tew, i+ DPe, i | (7) |
DPe, i = (Pi-ROi)+Iifw-De, i-1≥0 | (8) |
where Kr is the soil evaporation reduction coefficient, TEW (total evaporative water) is the maximum cumulative depth of evaporation (depletion) from the soil surface layer (mm), RAW (readily available water) is the cumulative depth of evaporation (depletion) at the end of stage 1 (mm), De,i − 1 is the cumulative depth of evaporation (depletion) from the soil surface at the end of the day (i − 1) (mm), De,i is the cumulative depth of evaporation (depletion) following complete wetting at the end of the day i (mm), Pi is the precipitation on day i (mm), ROi is the precipitation runoff from the soil surface on day i (mm), Ii is the irrigation depth on day i that infiltrates the soil (mm), Ei is the evaporation on day i (Ei = Ke*ET0) (mm), Tew,i is the depth of transpiration from the exposed and wetted fraction of the soil surface on day i (mm), DPe,i is the deep percolation loss from the topsoil layer on day i if soil water content exceeds field capacity (mm), fw is the fraction of soil surface wetted by irrigation (0.01–1), and few is the exposed and wetted soil surface (0.01–1).
In NWP, irrigation is described in terms of the irrigation scheduling strategy, the irrigation method, and constraints (maximum allowed soil water depletion). The irrigation scheduling strategies consist of standard conditions (no water stress) and assessment of a defined irrigation schedule. Equations for NIR calculation are as follows:
ETc, adj = (Ks×Kcb+Ke)×ET0 | (9) |
Ks = TAW-Dr, iTAW-RAW | (10) |
TAW = 1000 ×(θFC−θpwp)× Rd | (11) |
RAW = MAD×TAW | (12) |
NIRi=ETc,adj,i+DPi+RO−Pi+Dr,i | (13) |
where Ks is the water stress coefficient, TAW is the total available soil water in the root zone (mm), θFC is the water content at field capacity, θpwp is the water content at permanent wilting point, Rd is the depth of the root zone, MAD (management allowed depletion) is the average fraction of TAW that can be depleted from the root zone before moisture stress occurs (0–1), DPi is the water loss out of the root zone by deep percolation on day i (mm), ETc,adj I is the adjusted crop evapotranspiration on day i (mm), NIRi is the net irrigation requirement on day i (mm), ROi is the surface runoff on day i (mm), and Pi is the precipitation on day i (mm).
In this study, the irrigation scheduling strategy was set on standard conditions and irrigation was applied as soon as a proportion of TAW was depleted. The irrigation depth was determined based on the difference between the amount of water depleted and field capacity (θFC). The initial soil moisture was set on residual soil moisture of θpwp to force the model to apply an irrigation because farmers start with heavy irrigation after a period of dryness.
The time step where the calculations are conducted is a crucial factor in solving the water balance equation. Commonly, the equation is considered for monthly steps. However, in this study, the soil water balance equation was discussed on a daily basis in order to predict the irrigation events. In the end, cumulative NIR should be compatible with the following equation:
∑NIR+∑P = ∑RO+∑DP+∑ETc+Δθ | (14) |
where ∑NIR is the cumulative irrigation depth during a growing season, ∑P is the cumulative precipitation, ∑RO is the cumulative runoff, ∑DP is the cumulative deep percolation, ∑ETc is the crop evapotranspiration from the dual crop coefficient approach, and ∆θ is the soil moisture difference of the end and beginning of a growing season (mm).
The accuracy of dual crop coefficient approach has been confirmed by several studies during last decade [14,15,16].
The total amount of water, inclusive of losses, applied through irrigation is termed as gross irrigation requirement (GIR). The NIR divided by the irrigation efficiency gives IR. The efficiency for each plain was acquired from official reports [5]. Also, a few efficiency scenarios were assessed as explained in 2.3.4 and 3.5.
Four major databases were used in this study: (1) climatic data, (2) soil data, (3) crop data, and (4) irrigation efficiency. Detailed descriptions of these databases are presented in the following subsections.
Long-term daily climate data including maximum and minimum air temperature, relative humidity, wind speed, sunshine hours, and precipitation for the period of 1980–2017 were obtained from 407 synoptic stations and 560 climatological stations, which respectively belong to the Iran Meteorological Organization and Ministry of Energy. The data was transferred to the web-based weather database with capability of producing 5–30 years-average of climate data and presenting time-series of each parameter.
Since crop phenology and irrigation requirements vary with climate, an agro-climatic zones map of Iran was employed in the calculation of irrigation requirements in the NWP portal. This map has been produced using the UNESCO classification system, which is based on humidity, winter and summer type for arid zones.
The agro-climatic zones map was categorized into six major climatic zones including arid with cool winter and very warm summer (A_Cl_VW), arid with cool winter and warm summer (A_Cl_W), arid with mild winter and very warm summer (A_M_VW), semi-arid with cold winter and warm summer (SA_Cd_W), semi-arid with cool winter and warm summer (SA_Cl_W), and semi-humid with cool winter and warm summer, SH_Cl_W (Fig.2). The SH_Cl_W climate was the smallest area, whereas arid regions (A_Cl_VW, A_Cl_W, and A_M_VW) were the predominant climate in the country.
More than 32000 soil profiles containing general information (reports, coordinates, and exclusive codes), physical properties (texture, structure, bulk density, and water-holding capacity and infiltration rate) and chemical properties (pH, salinity, and organic matter) were collected from different sources produced by both government and private section over the past 25 years. In addition, a national-scale general soil texture map generated by Soil and Water Research Institute (SWRI 2018) was implemented in the calculation of irrigation requirements. This map has been produced by overlaying several maps including Iran's Land Suitability for Agriculture map [4] and Iran land use/land cover map.
The map consisting of 10 soil types was reclassified into 5 texture class including very light, light, moderate, heavy, and very heavy, for simplification (Table 1).
No. | Texture class | Texture type |
1 | Sand | Very light |
2 | Loamy sand | Light |
3 | Sandy loam | Light |
4 | Loam | Moderate |
5 | Silt loam | Moderate |
6 | Silt | Moderate |
7 | Sandy clay loam | Heavy |
8 | Silty clay loam | Heavy |
9 | Clay loam | Heavy |
10 | Sandy clay | Very heavy |
11 | Silty clay | Very heavy |
12 | Clay | Very heavy |
General data on crop parameters and irrigation management was derived from different national and international sources including FAO, Ministry of Agriculture, reports of agriculture research institutes, comprehensive studies on agriculture management in Iran, and Statistical Center of Iran. These data were later localized by vast field surveys among both farmer communities and agricultural experts in each province. The field surveys for the major crops in the 609 plains of Iran were conducted by a joint cooperation between APERDRI (Agricultural Planning, Economic and Rural Development Research Institute) and Agriculture and Horticulture department of Ministry of Agriculture, during the 2016–2017 growing season (Table 2). Nasiri (2014) provided the data on growth length of major crops which was validated by time series of vegetation indices derived from Landsat and Sentinels images [19].
Parameter | Definition | Source | |
Planting date | Planting month and day | APERDRI + Field surveys | |
Length of growing stages | Length of initial stage, development stage, middle stage and late-season stage | APERDRI + Field surveys | |
Basal crop coefficients | Initial basal crop coefficient, Middle basal crop coefficient and Late-season basal crop coefficient | Table 17, FAO.56 | |
Crop height | Maximum crop height (m) | Ministry of agriculture + Field surveys | |
Root depth | Minimum and maximum rooting depth (m) | Ministry of agriculture | |
Management allowed depletion | Management allowed depletion at the initial stage (%) and during the growing season (%) | Table 22, FAO.56 | |
Evaporative soil depth | The soil depth affected by evaporation (mm) | 0.1–0.15 | |
Yield | Crop yield | APERDRI | |
Slope Yield Coefficient | Slop coefficient of yield reduction | FAO.56 | |
Sensitivity Coefficient | Crop sensitivity coefficient | FAO.56 | |
Economic data | Rent, planting, mechanization harvest and sell | APERDRI | |
Irrigation method | Type of irrigation used for each field | Ministry of agriculture + field surveys | |
Fraction of wetted soil surface | The fraction of soil surface wetted by precipitation or irrigation | The type of the irrigation system and table 20 of FAO.56 |
The analysis of the irrigation efficiency measured from 1900 irrigated fields administered by farmers across the country in the period of 1991–2015 [5] were used to calculate GIR from estimated NIR. Apart from that, three different scenarios including 56% (the average efficiency of irrigation systems in Iran according to [17]), 65% (a reliable and accessible irrigation efficiency), and 100% was implemented to evaluate different possibilities of water management and compare the current situation with ideal circumstances. Also, a rate of 15 % (the highest amount of stress that farmers usually exert on crops) water stress was applied to the net irrigation water requirements calculated by NWP portal to convert the net irrigation water in standard conditions to the actual data.
The statistical data for the main crops was classified and reported on the basis of agro-climatic zones (Table 3). Wheat, barley, sugar beet, and forage maize are planted in all the agro-climatic zones as major cultivated crops across the country as indicated in the Table 3. The absence of rice in the SA_Cd_W climate can be observed, and sugar cane is solely cultivated in the A_M_VW climate (southwest of Iran). The studied crops are mainly planted in the regions with A_Cl_W and A_Cl_VW climates. Among the cultivated crops, winter wheat comprises of more than 50% of the cultivated areas and 68% of paddy fields located in the SH_Cl_W climate. Sugarcane is only cultivated in the A_M_VW climate.
Crop type | Area | Climate | Total area | |||||
A_Cl_W | SH_Cl_W | A_Cl_VW | SA_Cd_W | SA_Cl_W | A_M_VW | |||
Winter wheat | ha | 596685 | 29147 | 567851 | 34148 | 548941 | 351565 | 2128340 |
% | 28.0 | 1.4 | 26.7 | 1.6 | 25.8 | 16.5 | 52.47 | |
Winter barley | ha | 264602 | 2803 | 320364 | 20558 | 86861 | 40411 | 735601 |
% | 36.0 | 0.4 | 43.6 | 2.8 | 11.8 | 5.5 | 18.13 | |
Rice | ha | 12743 | 407831 | 10868 | - | 114997 | 49251 | 595693 |
% | 2.1 | 68.5 | 1.8 | - | 19.3 | 8.3 | 14.68 | |
Maize | ha | 19655 | 629 | 55816 | - | 68346 | 25690 | 170138 |
% | 11.6 | 0.4 | 32.8 | - | 40.2 | 15.1 | 4.19 | |
Sugar beet | ha | 61055 | 24.4 | 20722 | 2151 | 25983 | 835 | 110772 |
% | 55.1 | 0.0 | 18.7 | 1.9 | 23.5 | 0.8 | 2.73 | |
Forage maize | ha | 58987 | 2193 | 89666 | 454 | 56924 | 15087 | 223314 |
% | 26.4 | 1.0 | 40.2 | 0.2 | 25.5 | 6.8 | 5.50 | |
Sugar cane | ha | - | - | - | - | - | 89565 | 89565 |
% | - | - | - | - | - | 100.0 | 2.21 |
Data on crop growing duration obtained from filed surveys and cumulated ET0 over the growing seasons of the studied crops were laid out in Table 4. The duration of the growing season is profoundly influenced by the planting dates, crop varieties, and climatic elements. The shortest and longest time usually occurs in the A_M_VW climate and the SA_Cd_W climate, respectively. Mokhtari et al. (2019) analyzed the duration of the growing seasons of major crops in three different agro-climate zones (SA_Cd_W, A_Cl_W, and A_M_VW) of Iran using satellite data and concluded similar results [18]. The warmer temperature in both A_Cl_W and A_Cl_VW climates causes the time of the growing seasons to be shorter. Also, the warmth and humidity in the SH_Cl_W and SA_Cl_W climates along with using early season crops leads to even shorter growing period in these areas.
Crop type | Crop growth length (Day)/Cumulative ET0 (mm. season-1) | |||||||||||
A_Cl_W | SH_Cl_W | A_Cl_VW | SA_Cd_W | SA_Cl_W | A_M_VW | |||||||
Winter wheat | 250/ | 674 | 167/ | 222 | 198/ | 647 | 265/ | 512 | 227/ | 636 | 167/ | 636 |
Winter barley | 240/ | 574 | 152/ | 192 | 183/ | 507 | 250/ | 413 | 212/ | 531 | 152/ | 468 |
Rice | 101/ | 602 | 97/ | 429 | 91/ | 660 | - | - | 111/ | 707 | 95/ | 737 |
Maize | 142/ | 820 | 138/ | 608 | 123/ | 737 | 145/ | 593 | 138/ | 899 | 117/ | 618 |
Spring sugar beet | 212/ | 1038 | 195/ | 701 | 181/ | 1156 | 215/ | 864 | 202/ | 1148 | 180/ | 1229 |
Forage maize | 122/ | 736 | 118/ | 569 | 103/ | 681 | 124/ | 590 | 118/ | 802 | 96/ | 541 |
Sugar cane | - | - | - | - | - | - | - | - | 405/ | 1976 |
ET0 is the quantitative form of the climatic condition [9]. The cumulative ET0 in the areas with SA_Cd_W and SH_Cl_W climates was the lowest because of the low air temperature in the SA_Cd_W climate and the high humidity with a relatively low temperature in the SH_Cl_W region, Whereas ET0 in the A_M_VW and A_Cl_VW climates was relatively high. In general, ET0 is affected by the duration of the growing period. With the increasing of the length of growing season, the cumulative ET0 will increase.
Figure 3 depicts the cumulative GIR and NIR of an agricultural year in each plain obtained from NWP in million cubic meters (MCM). As is shown, deserts and mountain areas in the Zagros and Alborz mountains, which have very little or no cultivated areas, have the lowest GIR and NIR ranging from 0 to just under 80 MCM. Maximum NIR was seen in southwestern areas with dominant cultivation of sugar cane, parts of northern plains with dominant cultivation of rice, and parts of southern plains which face a high temperature and dry conditions (A-M-VW) and with a vast cultivation area. Furthermore, areas with the lowest irrigation efficiency, such as Qazvin, Alborz, and Tehran, have the maximum amount of GIR. Overall, visual observation indicates a high compatibility of the results with topographic and climatic maps and the model has been able to provide a good estimate of the spatial distribution of NIR and GIR for each plain.
Sugar cane with ETc of 1976 mm has the highest ETc among the studied crops because of its long period of growing season. Sugar beet with ETc of 636–1208 mm has the highest water consumption after sugarcane. ETc of rice varies from 489 to 916 mm and its ETc in the SH_Cl_W climate is lower than other agro-climate zones. ETc of maize and forage maize varies from 440 to 702 mm which is lower than ETc for sugarcane, sugar beet, and rice. Winter wheat and barley with ETc of 168–555 mm has the lowest ETc among the studied crops.
NIR directly follows the changes in ETc (Eq.6 and Eq.22). Therefore, the variations of NIR in different parts of Iran is a function of variation of ETc. Sugar cane with NIR of 18318 m3 ha−1 has distinguishably higher NIR value among the studied crops because of its long growing season. Sugar beet with NIR of 5100–11896 m3 ha−1 stands in the second place in terms of required water, and rice with NIR of 4495–8907 m3 ha−1 has the highest NIR after sugarcane and sugar beet in all the agro-climatic zones. NIR for maize and forage maize (3747 to 7083 m3 ha−1) is lower than NIR for sugarcane, sugar beet, and rice. Winter wheat and barley with NIR of 258–4235 m3 ha−1 has the lowest NIR among the studied crops.
The highest NIR is for Qazvin plain with 1.191 MCM and the lowest belongs to scattered plains around the central basin. However, the highest GIR for Tehran-Karaj plain is 2.589 MCM. This is a high amount of water demand considering the cultivation area of the plain which is caused by the dense cropping pattern and the low efficiency in this strategic plain that is mostly under cultivation of wheat, maize, and barley.
In Figure 4, the average NIR for major crops (wheat, barley, rice, maize, sugar beet, forage maize, and sugar cane) is displayed based on climatic classification. As can be seen, the amount of water demand shows a high correlation with the climatic conditions of different regions.
In Table 5, the aggregated NIR and IR for sub-basins and main basins are presented in MCM. The lowest obtained NIR belongs to Eastern basin and Mashkel sub-basin with 1298 MCM and 298 MCM, respectively. The highest amounts belong to the Central basin and Namak lake sub-basin with 44781 MCM and 5472 MCM, respectively. Total amount of NIR and GIR for the entire country are estimated to be around 47 BCM and 105 BCM, which are consistent with the results obtained from the official reports of the Ministry of Energy [5].
Main Basin | Sub-basin | CODE | NIR(MCM) | GIR(MCM) |
Caspian Basin | Aras | 11 | 1770 | 3338 |
Talesh rivers | 12 | 506 | 1007 | |
Sefi rud | 13 | 2187 | 4948 | |
Sefid rud - Haraz | 14 | 377 | 759 | |
Qarah Su - Haraz | 15 | 1396 | 2918 | |
Qarah Su - Haraz | 16 | 861 | 1925 | |
Atrak | 17 | 659 | 1489 | |
Total | 7756 | 16384 | ||
Persian Gulf and Oman Basin | Western border | 21 | 1025 | 2214 |
Karkheh | 22 | 3187 | 6990 | |
Karun | 23 | 4394 | 10539 | |
Jarahi - Zohreh rivers | 24 | 1767 | 4024 | |
Helleh | 25 | 576 | 1141 | |
Mand | 26 | 1350 | 2552 | |
Kol - Mehran rivers | 27 | 972 | 1952 | |
Bandarabbas - Sadich | 28 | 1167 | 2460 | |
South Balochistan | 29 | 408 | 610 | |
Total | 14846 | 32482 | ||
Urmia Lake Basin | Urmia lake | 30 | 2958 | 6051 |
Total | 2958 | 6051 | ||
Central Basin | Namak lake | 41 | 5472 | 14641 |
Gavkhouni | 42 | 1109 | 2653 | |
Tashk - Bakhtegan - Maharlu | 43 | 2064 | 3850 | |
Abarkuh - Sirjan | 44 | 1188 | 2476 | |
Hamun e Jaz Murian | 45 | 2145 | 4295 | |
Dasht e Lut | 46 | 1316 | 2856 | |
Dasht e Kavir | 47 | 3728 | 9623 | |
Kavir e Siahkuh | 48 | 451 | 996 | |
Darreanjir | 49 | 1569 | 3391 | |
Total | 19042 | 44781 | ||
Eastern Basin | Khaf salt marsh | 51 | 415 | 987 |
Hamun lake | 52 | 576 | 939 | |
Mashkel | 53 | 298 | 446 | |
Total | 1289 | 2372 | ||
Sarakhs Basin | Karakum | 60 | 1432 | 3276 |
Total | 1432 | 3276 | ||
Total (Over all) | 47323 | 105346 |
Due to the existence of various climatic conditions, cultivated crops, altering physical and chemical properties of soils across the country, and in the absence of an integrated network of lysimetric data in Iran, a comprehensive accuracy assessment of NWP outputs with the references data was not possible. Instead, an attempt was made to assess the accuracy of results by comparing the estimated total gross irrigation requirements (GIR) with the amount of water withdrawal by agricultural tube-wells in each plain (Figure 5). Since groundwater resources has a very high share in the supply of needed water by agricultural sector in Iran and more than 91% of water in the basins is consumed by this sector, comparison of total GIR and the amount of water withdrawals by agricultural tube-wells can be an effective approach in evaluating the accuracy of developed system.
In addition, the estimated GIR for the major crops was compared with the water requirements reported in the literature review (Table 6 and Figure 6). Most of the relevant research studies published in the Iranian research databases during the last decades was analyzed and the reported NIR was compared with the estimated values. The estimated GIR matches well with the reported NIR and has an acceptable correlation of 0.78 with the results from literature review (Figure 6).
Crop | State (plain code) | Measured GIR (according to reference m3 ha−1) | Estimated GIR by NWD m3 ha−1 | Reference |
Barley | Eastern Azarbayjan (1104) | 2060 | 2750 | [19] |
Kerman (4905) | 7706 | 6558 | [20] | |
Sugar beet | Ardebil (1601) | 6251 | 11937 | [20] |
Ardebil (1103) | 10130 | 5630 | [21] | |
Khorasan Razavi (6007) | 27941 | 23615 | [22] | |
Isfahan (4201) | 10660 | 11510 | [23] | |
Hamedan (4117) | 16161 | 15608 | [24] | |
Forage corn | Tehran(4134) | 14479 | 12604 | [25] |
Kerman (4905) | 9473 | 6472 | [20] | |
Wheat | Lorestan (2208) | 5000 | 5951 | [26] |
Fars (4318) | 7020 | 7682 | [27] | |
Khorasan Razavi (6007) | 12460 | 6887 | [28] | |
Khozestan (2201) | 5655 | 9248 | [29] | |
Charmahal-Bakhtiari (2330) | 5368 | 9387 | [30] | |
Alborz (4133) | 7650 | 8088 | [28] | |
Khozestan(2201) | 3457 | 9248 | [31] | |
Kerman (4905) | 8391 | 8376 | [20] | |
Golestan (1601) | 1592 | 1648 | [20] | |
Hamedan (4117) | 5007 | 6808 | [32] | |
Khozestan (2407) | 4398 | 6842 | [33] | |
Rice | Mazandaran (1503) | 3540 | 4520 | [34] |
Mazandaran (1403) | 4435 | 4320 | [35] | |
Mazandaran (1502) | 4725 | 4090 | [36] | |
Guilan (1202) | 4425 | 3940 | [37] | |
Guilan (1202) | 4916 | 3940 | [38] | |
Maze | Eastern Azarbayjan (3019) | 7754 | 6270 | [39] |
Tehran(4134) | 4820 | 7040 | [40] | |
Fars (4323) | 7680 | 6390 | [41] | |
Sugar cane | Khozestan (2302) | 20780 | 21340 | [42] |
Table 7 illustrates the effects of irrigation efficiency and water stress scenarios on the total irrigation water requirement under different climatic conditions. Considering the average efficiency of the irrigation systems operating in Iran (56% scenario), 11.068 MCM water is lost annually because of low irrigation efficiency. By increasing the irrigation efficiency to 65% without considering any water stress, 3.482 MCM of water can be saved. In case of applying 15% water stress, assuming the crop yield remains unchanged, the saved water will reach to 6.732 MCM. The results indicate that if increasing irrigation efficiency is not feasible, 3.772 MCM water can be saved by applying 15% water stress.
Saved water with/without water stress in MCM | ||||||
No water stress | 15% water tress | |||||
Climate | 65% | 100% | 56% | 65% | 100% | |
Wheat | A_Cl_W | 157 | 500 | 168 | 302 | 594 |
SH_Cl_W | 2 | 6 | 2 | 4 | 8 | |
A_Cl_VW | 378 | 1200 | 434 | 751 | 1443 | |
SA_Cd_W | 2 | 6 | 2 | 4 | 7 | |
SA_Cl_W | 88 | 281 | 91 | 167 | 332 | |
A_M_VW | 90 | 286 | 104 | 179 | 344 | |
Rice | A_Cl_W | 76 | 240 | 91 | 154 | 291 |
SH_Cl_W | 11 | 35 | 12 | 21 | 42 | |
A_Cl_VW | 144 | 459 | 155 | 278 | 546 | |
SA_Cl_W | 168 | 534 | 173 | 317 | 631 | |
A_M_VW | 77 | 245 | 70 | 137 | 284 | |
Maize | A_Cl_W | 87 | 278 | 92 | 167 | 330 |
SH_Cl_W | 10 | 32 | 11 | 19 | 38 | |
A_Cl_VW | 296 | 941 | 317 | 569 | 1118 | |
SA_Cl_W | 165 | 525 | 170 | 312 | 620 | |
A_M_VW | 37 | 119 | 39 | 71 | 140 | |
Sugar beet | A_Cl_W | 320 | 1017 | 353 | 624 | 1214 |
SH_Cl_W | 4 | 11 | 4 | 7 | 13 | |
A_Cl_VW | 217 | 688 | 237 | 421 | 821 | |
SA_Cd_W | 5 | 16 | 6 | 10 | 20 | |
SA_Cl_W | 193 | 613 | 209 | 373 | 730 | |
A_M_VW | 24 | 76 | 26 | 46 | 90 | |
Forage maize | A_Cl_W | 227 | 722 | 243 | 436 | 858 |
SH_Cl_W | 3 | 10 | 3 | 6 | 12 | |
A_Cl_VW | 400 | 1272 | 431 | 772 | 1514 | |
SA_Cd_W | 3 | 10 | 3 | 6 | 12 | |
SA_Cl_W | 181 | 574 | 198 | 351 | 685 | |
A_M_VW | 46 | 147 | 50 | 90 | 176 | |
Sugar cane | A_M_VW | 71 | 225 | 78 | 138 | 269 |
Total | 3482 | 11068 | 3772 | 6732 | 13182 |
In this study, web-based water balance simulation tools were developed to estimate the NIR in Iran. The daily water balance components were calculated for the 125 different crops including the dominant strategic crops of winter wheat, barely, rice, maze, sugar beet, and sugarcane in each 609 plains using climatological, crop, and soil data representative for each plain. The web-based simulation model was developed using the FAO-56 dual Kc methodology. Access to the actual irrigated water was nearly impossible in most cases. Therefore, a rate of 15 % water stress was applied to convert the net irrigation water in standard conditions to the actual data. General data on climate, soil, and crop parameters and irrigation management was derived from different national and international sources and was localized by several vast field surveys.
In absence of reference lysimetric data or measured irrigation requirements, the accuracy assessment of the outputs was performed by comparing the estimated NIR with the values found in the literature review. Most of the relevant research studies published in the Iranian research databases during the last decades was analyzed and the reported NIR was compared with the estimated values. In addition, the accuracy of results was evaluated by comparing the estimated GIR with the amount of water withdrawal by agricultural tube-wells in each plain.
In field scale, sugar cane has the highest NIR value (18318 m3 ha−1) among the studied crops and sugar beet has the second highest (5100–11896 m3 ha−1). Moreover, the maximum amount of aggregated NIR in plain scale belongs to Qazvin plain and the highest GIR was observed in Tehran-Karaj plain with values of 1.191 and 2.589 MCM, respectively. The aggregated NIR and GIR in scales of sub-basins and main basins indicates that the lowest estimated NIR belongs to the Eastern basin and Mashkel sub-basin with 1.298 and 0.298 MCM, respectively. The highest amounts belong to the Central basin and Namak lake sub-basin with 44.781 and 5.472 MCM, respectively. Total amount of NIR and GIR for the entire country are estimated to be around 47 and 105 BCM. In addition, the results indicate that 3.772 MCM water can be saved by applying 15% water stress. By increasing the irrigation efficiency to 65% without considering any water stress, 3.482 MCM of water can be saved.
The estimated values of 47.323 and 105.346 MCM for NIR and GIR in the current study shows a strong agreement with the literature [5]. Furthermore, the output of the model matches other case studies in different areas of the country and the model proved to be a useful asset in estimation of water requirement of different crops in different climates [19,20,21,22,23,24,25,26,27,28,29,30,31,32,33,34,35,36,37,38,39,40,41]. One of the unexpected results of the study was the poor water management in the northern portion of the plains. An unexpected amount of NIR was detected in those areas, such as Gorgan plain, which can be a sign of unauthorized depletion of renewable water resources
In a comprehensive study, Mirzaie-Nodoushan et al. (2020) reported the total blue water consumption for the croplands in Iran varies between 48.9 and 58.6 BCM under different diets [43]. Karandish et al. (2021) estimated the total blue water consumption value as 45.5 BCM for 27 major crops in Iran which is very consistent with the estimated NIR in the present study. They also mentioned that 78% of this consumption (35.5 BCM) is unsustainable and addressed that the remaining water consumption is used inefficiently [44].
In another study, the relationship of blue and green water consumption with croplands in Iran was analyzed based on designed scenarios by Khorsandi et al (2023) using the methodology proposed by Khorsandi et al. (2022) [45,46]. The results indicate the total water use for producing 19 main crops at the national level varied from 30.47 to 49.91 BCM during 2005–2014. Their results indicate total water consumption in Iran reaches to the 55.27 BCM for an area of 148433.8 km2 in 2020. The 8.27 BCM difference between our estimation for 2016 and their estimation (55.27–47 BCM) can provide a reasonable estimate of water consumption from rain-fed agriculture in Iran. This rain-fed water consumption is out of human control, and with efficient land management, it can be a sustainable source of agricultural production.
At the same time, Khorsandi et al. (2022) mentioned 77.4 BCM for the total water consumption from 248804.6 km2 of possible arable lands [46]. This area is the maximum possible land to be used for farming/agriculture in irrigated and rain-fed systems which includes a complete diet and possibly other water usages. The data extracted from Iran's Ministry of Agriculture shows during 2005–2014 the total croplands (both for agriculture and horticulture) was 128039.6–160347.2 km2. Our results for the maximum amount of water that irrigated agriculture can consume show 47 BCM from an area of 87255 km2. The difference between our maximum estimation (47 BCM) and their estimate (77.4 BCM) can show the extent of water use by sectors not related to both agriculture and natural reserves.
Ministry of Energy (MoE) estimates for maximum total water consumption in agriculture show 32.8 BCM. Since Karandish et al. (2021) provides net water consumption and MoE provides water withdrawal, their division is a reasonable estimate for the current water efficiency, which is 60% [44]. For efficient agriculture with a cap on water withdrawal, water efficiency should be improved to more than 60–72% levels.
Results indicate that the developed system in this study (NWP) can be considered as a reliable decision-making support tool for the water authorities in making water management decisions, allocating water resources and modifying the cultivation pattern. NWP is a temporary answer to the problem of the absence of reference lysimetric data and national database on the amount of water consumption in agriculture in Iran, which is a vast country with various climatic conditions. Simplicity of use, minimum required input data, and maximum accuracy were the main features of the developed system.
Conceptualization, Majid Vazifedoust, Mohammadreza Keshavarz, Ali Mokhtari, Elham Barikani and Mojtaba Palouj; Methodology, Majid Vazifedoust, Mohammadreza Keshavarz and Ali Mokhtari; Software, Majid Vazifedoust; Validation, Majid Vazifedoust, Mohammadreza Keshavarz and Ali Mokhtari; Formal analysis, Majid Vazifedoust; Investigation, Majid Vazifedoust, Mohammadreza Keshavarz, Ali Mokhtari, Elham Barikani and Mojtaba Palouj; Resources, Majid Vazifedoust; Data curation, Elham Barikani and Mojtaba Palouj; Writing-original draft preparation, Ali Mokhtari; Writing-review and editing, Majid Vazifedoust and Mohammadreza Keshavarz; Visualization, Ali Mokhtari; Supervision, Majid Vazifedoust; Project administration, Majid Vazifedoust. All authors have read and agreed to the published version of the manuscript.
The authors declare they have not used Artificial Intelligence (AI) tools in the creation of this article.
The authors declare no conflict of interest.
[1] | Sedentary Behaviour Research Network. What is sedentary behavior? 28 October 2014. Available from: http://www.sedentarybehaviour.org/what-is-sedentary-behaviour/. |
[2] | Biddle SJ, Gorely T and Stensel DJ (2004) Health-enhancing physical activity and sedentary behaviour in children and adolescents. J Sports Sci 22(8): 679-701. |
[3] | Cale L and Harris J (2013) “Every child (of every size) matters” in physical education! Physical education’s role in childhood obesity. Sport Educ Soc 18(4): 433-452. |
[4] | Healy GN, Clark BK, Winkler EA, et al. (2011) Measurement of adults' sedentary time in population-based studies. Am J Prev Med 41(2): 216-227. |
[5] | Brug J and Chinapaw M (2015) Determinants of engaging in sedentary behavior across the lifespan; lessons learned from two systematic reviews conducted within DEDIPAC. Int J Behav Nutr Phys Act 12(1): 134. |
[6] | Prentice-Dunn H and Prentice-Dunn S (2012) Physical activity, sedentary behavior, and childhood obesity: a review of cross-sectional studies. Psychol Health Med 17(3): 255-273. |
[7] | Katzmarzyk PT, Barreira TV, Broyles ST, et al. (2015) Physical activity, sedentary time, and obesity in an international sample of children. Med Sci Sports Exercise 47(10): 2062-9. |
[8] | Tremblay MS, LeBlanc AG, Kho ME, et al. (2011) Systematic review of sedentary behaviour and health indicators in school-aged children and youth. Int J Behav Nutr Phys Act 8(1): 98. |
[9] | Basterfield L, Adamson AJ, Frary JK, et al. (2011) Longitudinal study of physical activity and sedentary behavior in children. Pediatrics 127(1): e24-e30. |
[10] |
Verloigne M, Bere E, Van Lippevelde W, et al. (2012) The effect of the UP4FUN pilot intervention on objectively measured sedentary time and physical activity in 10–12 year old children in Belgium: the ENERGY-project. BMC Public Health 12: 805. doi: 10.1186/1471-2458-12-805
![]() |
[11] | Biddle SJ, Pearson N, Ross GM et al. (2010) Tracking of sedentary behaviours of young people: a systematic review. Prev Med 51(5): 345-351. |
[12] | Jones RA, Hinkley T, Okely AD, et al. (2013) Tracking Physical Activity and Sedentary Behavior in Childhood: A Systematic Review. Am J Prev Med 44(6): 651-658. |
[13] | Colley RC, Garriguet D, Janssen I, et al. (2011) Physical activity of Canadian children and youth: accelerometer results from the 2007 to 2009 Canadian Health Measures Survey. Health Rep 22(1): 15. |
[14] | Saunders TJ, Chaput JP and Tremblay MS (2014) Sedentary behaviour as an emerging risk factor for cardiometabolic diseases in children and youth. Can J Diabetes 38(1): 53-61. |
[15] |
Sandercock GR, Alibrahim M and Bellamy M (2016) Media device ownership and media use: Associations with sedentary time, physical activity and fitness in English youth. Prev Med Rep 4: 162-168. doi: 10.1016/j.pmedr.2016.05.013
![]() |
[16] | Bradley RH, McRitchie S, Houts RM, et al. (2011) Parenting and the decline of physical activity from age 9 to 15. Int J Behav Nutr Phys Act 8(1): 33. |
[17] | Chu AHY, Ng SHX, Tan CS, et al. (2016) A systematic review and meta‐analysis of workplace intervention strategies to reduce sedentary time in white‐collar workers. Obesity Rev 17(5): 467-481. |
[18] | Yıldırım M, Verloigne M, De Bourdeaudhuij I (2011) Study protocol of physical activity and sedentary behaviour measurement among schoolchildren by accelerometry-Cross-sectional survey as part of the ENERGY-project. BMC Public Health 11(1): 182. |
[19] | Rush E, Coppinger T, Obolonkin V, et al. (2012) Use of pedometers to identify less active children and time spent in moderate to vigorous physical activity in the school setting. J Sci Med Sport 15(3): 226-230. |
[20] | van Stralen MM, Yıldırım M, Wulp A, et al. (2014) Measured sedentary time and physical activity during the school day of European 10-to 12-year-old children: The ENERGY project. J Sci Med Sport 17(2): 201-206. |
[21] | Kastorini CM, Lykou A, Yannakoulia M, et al. (2016) The influence of a school-based intervention programme regarding adherence to a healthy diet in children and adolescents from disadvantaged areas in Greece: the DIATROFI study. J Epidemiol Community Health, doi:10.1136/jech-2015-205680. |
[22] |
Vander Ploeg KA, Maximova K, McGavock J, et al. (2014) Do school-based physical activity interventions increase or reduce inequalities in health? Soc Sci Med 112: 80-87. doi: 10.1016/j.socscimed.2014.04.032
![]() |
[23] | Nyberg G, Norman Å, Sundblom E, et al. (2016) Effectiveness of a universal parental support programme to promote health behaviours and prevent overweight and obesity in 6-year-old children in disadvantaged areas, the Healthy School Start Study II, a cluster-randomised controlled trial. Int J Behav Nutr Phys Act 13(1): 4. |
[24] | van Grieken A, Ezendam NP, Paulis WD, et al. (2012) Primary prevention of overweight in children and adolescents: a meta-analysis of the effectiveness of interventions aiming to decrease sedentary behaviour. Int J Behav Nutr Phys Act 9 (1): 1-11. |
[25] | Grant PM, Ryan CG, Tigbe WW, et al. (2006) The validation of a novel activity monitor in the measurement of posture and motion during everyday activities. Br J Sports Med 40(12): 992-997. |
[26] | Reilly JJ, Penpraze V, Hislop J, et al. (2008) Objective measurement of physical activity and sedentary behaviour: review with new data. Arch Dis Child 93(7): 614-619. |
[27] | Yang CC and Hsu YL (2010) A review of accelerometry-based wearable motion detectors for physical activity monitoring. Sensors 10(8): 7772-7788. |
[28] | Hardy LL, Hills AP, Timperio A, et al. (2013) A hitchhiker's guide to assessing sedentary behaviour among young people: Deciding what method to use. J Sci Med Sport 16(1): 28-35. |
[29] |
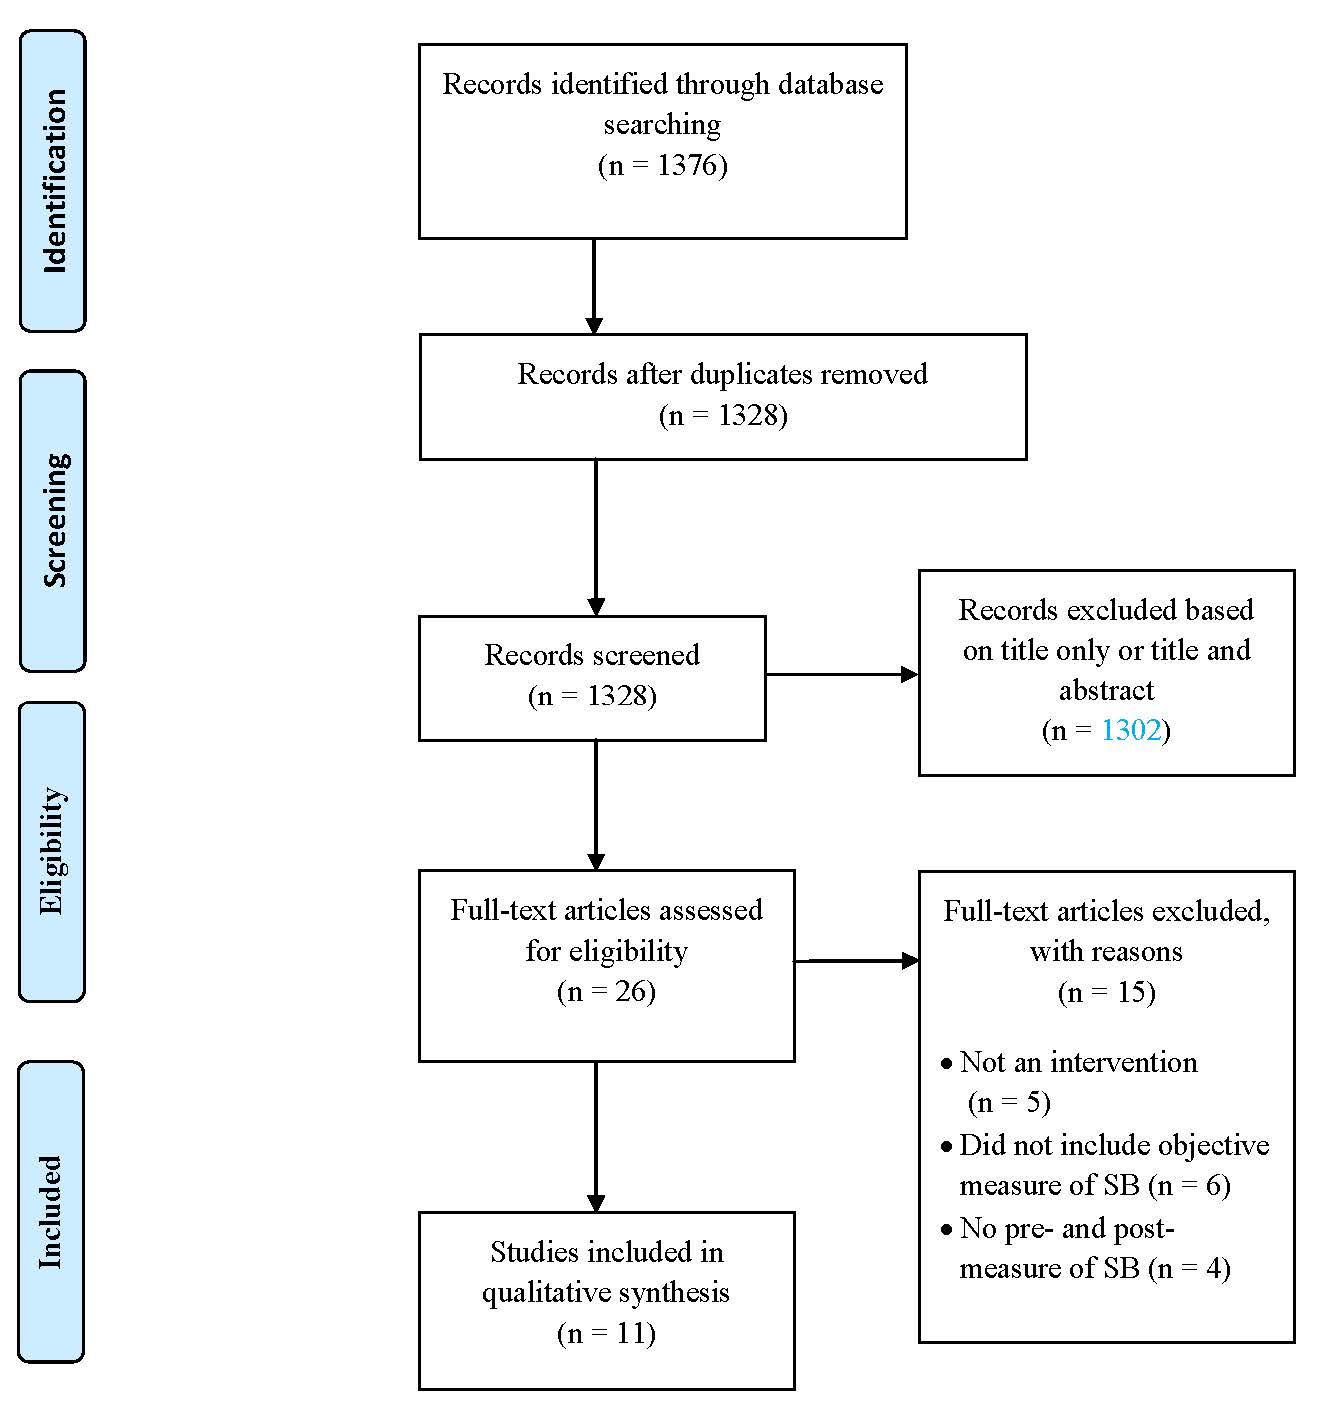
Moher D, Liberati A, Tetzlaff J, et al. (2009) Preferred reporting items for systematic reviews and meta-analyses: the PRISMA statement. BMJ 339: b2535. doi: 10.1136/bmj.b2535
![]() |
[30] |
Higgins JP, Altman DG, Gøtzsche PC, et al. (2011) The Cochrane Collaboration’s tool for assessing risk of bias in randomised trials. BMJ 343: d5928. doi: 10.1136/bmj.d5928
![]() |
[31] | PROSPERO International prospective register of systematic reviews. CRD, 42015025724, Available from: http://www.crd.york.ac.uk/PROSPERO/display_record.asp?ID=CRD42015025724. |
[32] | Breslin G, Brennan D, Rafferty R, et al. (2012) The effect of a healthy lifestyle programme on 8–9 year olds from social disadvantage. Arch Dis Child 97(7): 618-624. |
[33] |
Fairclough SJ, Hackett AF, Davies IG, et al. (2013) Promoting healthy weight in primary school children through physical activity and nutrition education: a pragmatic evaluation of the CHANGE! Randomised intervention study. BMC Public Health 13: 626. doi: 10.1186/1471-2458-13-626
![]() |
[34] |
Kipping RR, Howe LD, Jago R, et al. (2014) Effect of intervention aimed at increasing physical activity, reducing sedentary behaviour, and increasing fruit and vegetable consumption in children: active for Life Year 5 (AFLY5) school based cluster randomised controlled trial. BMJ 348: g3256. doi: 10.1136/bmj.g3256
![]() |
[35] |
Carson V, Salmon J, Arundell L, et al. (2013) Examination of mid-intervention mediating effects on objectively assessed sedentary time among children in the Transform-Us! cluster-randomized controlled trial. Int J Behav Nutr Phys Act 10: 62. doi: 10.1186/1479-5868-10-62
![]() |
[36] | Yildirim M, Arundell L, Cerin E, et al. (2014) What helps children to move more at school recess and lunchtime? Mid-intervention results from Transform-Us! cluster-randomised controlled trial. Br J Sports Med 48(3): 271-277. |
[37] | Aminian S and Hinckson EA (2012) Examining the validity of the ActivPAL monitor in measuring posture and ambulatory movement in children. International J Behav Nutr Phys Act 9(1): 119. |
[38] | Hinckson EA, Aminian S, Ikeda E, et al. (2013) Acceptability of standing workstations in elementary schools: a pilot study. Prev Med 56(1): 82-85. |
[39] |
Verloigne M, Bere E, Van Lippevelde W, et al. (2012) The effect of the UP4FUN pilot intervention on objectively measured sedentary time and physical activity in 10–12 year old children in Belgium: the ENERGY-project. BMC Public Health 12: 805. doi: 10.1186/1471-2458-12-805
![]() |
[40] | Verloigne M, Ridgers ND, Chinapaw M, et al. (2015) The UP4FUN Intervention Effect on Breaking Up Sedentary Time in 10-to 12-Year-Old Belgian Children: The ENERGY Project. Pediatr Exerc Sci 27(2). |
[41] | Vik FN, Lien N, Berntsen S, et al. (2015) Evaluation of the UP4FUN intervention: a cluster randomized trial to reduce and break up sitting time in European 10–12-year-old children. PloS One 10(3): p.e0122612. |
[42] | Clemes SA, Barber SE, Bingham DD, et al. (2015) Reducing children's classroom sitting time using sit-to-stand desks: findings from pilot studies in UK and Australian primary schools. J Public Health p.fdv084. |
[43] | Bandura A (1986) Social Foundations of Thought and Action: A Social Cognitive Theory. New Jersey: Prentice Hall. |
[44] | Lawlor DA. AFLY5 Study [Internet]. Message to: Lynda Hegarty. 2016 Feb 10 [cited 2016 Feb 29]. [1 paragraph]. |
[45] | Russ LB, Webster CA, Beets MW, et al. (2015) Systematic Review and Meta-Analysis of Multi-Component Interventions Through Schools to Increase Physical Activity. J Phys Act Health 12(10). |
[46] | Shirley K, Rutfield R, Hall N, et al. (2015) Combinations of obesity prevention strategies in US elementary schools: a critical review. J Prim Prev 36(1): 1-20. |
[47] | Amini M, Djazayery A, Majdzadeh R, et al (2015) Effect of school-based interventions to control childhood obesity: a review of reviews. Int J Prev Med 6, doi:10.4103/2008-7802.162059 |
[48] | Biddle SJ, O'Connell S and Braithwaite RE (2011) Sedentary behaviour interventions in young people: a meta-analysis. Br J Sports Med 45(11): 937-942. |
[49] | Chastin SF, Egerton T, Leask C, et al. (2015) Meta‐analysis of the relationship between breaks in sedentary behavior and cardiometabolic health. Obesity 23(9): 1800-1810. |
[50] | Machin D, Campbell MJ, Tan SB et al. (2011) Sample size tables for clinical studies. John Wiley & Sons. |
[51] | Button KS, Ioannidis JP, Mokrysz C, et al. (2013) Power failure: why small sample size undermines the reliability of neuroscience. Nat Rev Neurosci 14(5): 365-376. |
[52] | JanssenX, Basterfield L, Parkinson KN, et al. (2015) Objective measurement of sedentary behavior: impact of non-wear time rules on changes in sedentary time. BMC Public Health 15(1): 1. |
[53] | Carr LJ and Mahar MT (2012) Accuracy of intensity and inclinometer output of three activity monitors for identification of sedentary behavior and light-intensity activity. J Obes, doi:10.1155/2012/460271. |
[54] | Breslin G and Brennan D (2012) A healthy lifestyle intervention delivered by aspiring physical education teachers to children from social disadvantage: study protocol and preliminary findings. Child Care Pract 18(3): 207-225. |
[55] | Koepp GA, Snedden BJ, Flynn L, et al. (2012) Feasibility analysis of standing desks for sixth graders. ICAN Infant Child Adolesc Nutr 4(2): 89-92. |
[56] | British Heart Foundation. Sedentary behaviour, 2012. Available from: http://www.bhf.org.uk/thinkfit/default.aspx?page=1304 (Accessed 22 May 2013). |
[57] | World Health Organization. Health education: theoretical concepts, effective strategies and core competencies. 2012. Available from: http://applications.emro.who.int/dsaf/EMRPUB_2012_EN_1362.pdf (Accessed 26 October 2014). |
[58] | Bronfenbrenner U (1994) Ecological models of human development. Read Dev Child 2: 37-43. |
[59] | Sallis J, Owen N. Ecological Models of Health Behavior. In: Glanz K, Rimer BK, Viswanath K, editors. Health behavior: Theory, research, and practice. San Francisco, CA: Jossey-Bass; 2015. p. 43-64. |
[60] | Waters E, de Silva-Sanigorski A, Hall BJ, et al. (2011) Interventions for preventing obesity in children. Cochrane Database Syst Rev 132(12): 428-432. |
[61] | Shrestha N, Kukkonen‐Harjula KT, Verbeek JH, et al. (2016) Workplace interventions for reducing sitting at work. Cochrane Database of Systematic Reviews 2016, Issue 3. Art. No.: CD010912. DOI: 10.1002/14651858.CD010912.pub3. |
[62] | LeBlanc AG, Broyles ST, Chaput JP, et al. (2015) Correlates of objectively measured sedentary time and self-reported screen time in Canadian children. Int J Behav Nutr Phys Act 12(1): 1. |
No. | Texture class | Texture type |
1 | Sand | Very light |
2 | Loamy sand | Light |
3 | Sandy loam | Light |
4 | Loam | Moderate |
5 | Silt loam | Moderate |
6 | Silt | Moderate |
7 | Sandy clay loam | Heavy |
8 | Silty clay loam | Heavy |
9 | Clay loam | Heavy |
10 | Sandy clay | Very heavy |
11 | Silty clay | Very heavy |
12 | Clay | Very heavy |
Parameter | Definition | Source | |
Planting date | Planting month and day | APERDRI + Field surveys | |
Length of growing stages | Length of initial stage, development stage, middle stage and late-season stage | APERDRI + Field surveys | |
Basal crop coefficients | Initial basal crop coefficient, Middle basal crop coefficient and Late-season basal crop coefficient | Table 17, FAO.56 | |
Crop height | Maximum crop height (m) | Ministry of agriculture + Field surveys | |
Root depth | Minimum and maximum rooting depth (m) | Ministry of agriculture | |
Management allowed depletion | Management allowed depletion at the initial stage (%) and during the growing season (%) | Table 22, FAO.56 | |
Evaporative soil depth | The soil depth affected by evaporation (mm) | 0.1–0.15 | |
Yield | Crop yield | APERDRI | |
Slope Yield Coefficient | Slop coefficient of yield reduction | FAO.56 | |
Sensitivity Coefficient | Crop sensitivity coefficient | FAO.56 | |
Economic data | Rent, planting, mechanization harvest and sell | APERDRI | |
Irrigation method | Type of irrigation used for each field | Ministry of agriculture + field surveys | |
Fraction of wetted soil surface | The fraction of soil surface wetted by precipitation or irrigation | The type of the irrigation system and table 20 of FAO.56 |
Crop type | Area | Climate | Total area | |||||
A_Cl_W | SH_Cl_W | A_Cl_VW | SA_Cd_W | SA_Cl_W | A_M_VW | |||
Winter wheat | ha | 596685 | 29147 | 567851 | 34148 | 548941 | 351565 | 2128340 |
% | 28.0 | 1.4 | 26.7 | 1.6 | 25.8 | 16.5 | 52.47 | |
Winter barley | ha | 264602 | 2803 | 320364 | 20558 | 86861 | 40411 | 735601 |
% | 36.0 | 0.4 | 43.6 | 2.8 | 11.8 | 5.5 | 18.13 | |
Rice | ha | 12743 | 407831 | 10868 | - | 114997 | 49251 | 595693 |
% | 2.1 | 68.5 | 1.8 | - | 19.3 | 8.3 | 14.68 | |
Maize | ha | 19655 | 629 | 55816 | - | 68346 | 25690 | 170138 |
% | 11.6 | 0.4 | 32.8 | - | 40.2 | 15.1 | 4.19 | |
Sugar beet | ha | 61055 | 24.4 | 20722 | 2151 | 25983 | 835 | 110772 |
% | 55.1 | 0.0 | 18.7 | 1.9 | 23.5 | 0.8 | 2.73 | |
Forage maize | ha | 58987 | 2193 | 89666 | 454 | 56924 | 15087 | 223314 |
% | 26.4 | 1.0 | 40.2 | 0.2 | 25.5 | 6.8 | 5.50 | |
Sugar cane | ha | - | - | - | - | - | 89565 | 89565 |
% | - | - | - | - | - | 100.0 | 2.21 |
Crop type | Crop growth length (Day)/Cumulative ET0 (mm. season-1) | |||||||||||
A_Cl_W | SH_Cl_W | A_Cl_VW | SA_Cd_W | SA_Cl_W | A_M_VW | |||||||
Winter wheat | 250/ | 674 | 167/ | 222 | 198/ | 647 | 265/ | 512 | 227/ | 636 | 167/ | 636 |
Winter barley | 240/ | 574 | 152/ | 192 | 183/ | 507 | 250/ | 413 | 212/ | 531 | 152/ | 468 |
Rice | 101/ | 602 | 97/ | 429 | 91/ | 660 | - | - | 111/ | 707 | 95/ | 737 |
Maize | 142/ | 820 | 138/ | 608 | 123/ | 737 | 145/ | 593 | 138/ | 899 | 117/ | 618 |
Spring sugar beet | 212/ | 1038 | 195/ | 701 | 181/ | 1156 | 215/ | 864 | 202/ | 1148 | 180/ | 1229 |
Forage maize | 122/ | 736 | 118/ | 569 | 103/ | 681 | 124/ | 590 | 118/ | 802 | 96/ | 541 |
Sugar cane | - | - | - | - | - | - | - | - | 405/ | 1976 |
Main Basin | Sub-basin | CODE | NIR(MCM) | GIR(MCM) |
Caspian Basin | Aras | 11 | 1770 | 3338 |
Talesh rivers | 12 | 506 | 1007 | |
Sefi rud | 13 | 2187 | 4948 | |
Sefid rud - Haraz | 14 | 377 | 759 | |
Qarah Su - Haraz | 15 | 1396 | 2918 | |
Qarah Su - Haraz | 16 | 861 | 1925 | |
Atrak | 17 | 659 | 1489 | |
Total | 7756 | 16384 | ||
Persian Gulf and Oman Basin | Western border | 21 | 1025 | 2214 |
Karkheh | 22 | 3187 | 6990 | |
Karun | 23 | 4394 | 10539 | |
Jarahi - Zohreh rivers | 24 | 1767 | 4024 | |
Helleh | 25 | 576 | 1141 | |
Mand | 26 | 1350 | 2552 | |
Kol - Mehran rivers | 27 | 972 | 1952 | |
Bandarabbas - Sadich | 28 | 1167 | 2460 | |
South Balochistan | 29 | 408 | 610 | |
Total | 14846 | 32482 | ||
Urmia Lake Basin | Urmia lake | 30 | 2958 | 6051 |
Total | 2958 | 6051 | ||
Central Basin | Namak lake | 41 | 5472 | 14641 |
Gavkhouni | 42 | 1109 | 2653 | |
Tashk - Bakhtegan - Maharlu | 43 | 2064 | 3850 | |
Abarkuh - Sirjan | 44 | 1188 | 2476 | |
Hamun e Jaz Murian | 45 | 2145 | 4295 | |
Dasht e Lut | 46 | 1316 | 2856 | |
Dasht e Kavir | 47 | 3728 | 9623 | |
Kavir e Siahkuh | 48 | 451 | 996 | |
Darreanjir | 49 | 1569 | 3391 | |
Total | 19042 | 44781 | ||
Eastern Basin | Khaf salt marsh | 51 | 415 | 987 |
Hamun lake | 52 | 576 | 939 | |
Mashkel | 53 | 298 | 446 | |
Total | 1289 | 2372 | ||
Sarakhs Basin | Karakum | 60 | 1432 | 3276 |
Total | 1432 | 3276 | ||
Total (Over all) | 47323 | 105346 |
Crop | State (plain code) | Measured GIR (according to reference m3 ha−1) | Estimated GIR by NWD m3 ha−1 | Reference |
Barley | Eastern Azarbayjan (1104) | 2060 | 2750 | [19] |
Kerman (4905) | 7706 | 6558 | [20] | |
Sugar beet | Ardebil (1601) | 6251 | 11937 | [20] |
Ardebil (1103) | 10130 | 5630 | [21] | |
Khorasan Razavi (6007) | 27941 | 23615 | [22] | |
Isfahan (4201) | 10660 | 11510 | [23] | |
Hamedan (4117) | 16161 | 15608 | [24] | |
Forage corn | Tehran(4134) | 14479 | 12604 | [25] |
Kerman (4905) | 9473 | 6472 | [20] | |
Wheat | Lorestan (2208) | 5000 | 5951 | [26] |
Fars (4318) | 7020 | 7682 | [27] | |
Khorasan Razavi (6007) | 12460 | 6887 | [28] | |
Khozestan (2201) | 5655 | 9248 | [29] | |
Charmahal-Bakhtiari (2330) | 5368 | 9387 | [30] | |
Alborz (4133) | 7650 | 8088 | [28] | |
Khozestan(2201) | 3457 | 9248 | [31] | |
Kerman (4905) | 8391 | 8376 | [20] | |
Golestan (1601) | 1592 | 1648 | [20] | |
Hamedan (4117) | 5007 | 6808 | [32] | |
Khozestan (2407) | 4398 | 6842 | [33] | |
Rice | Mazandaran (1503) | 3540 | 4520 | [34] |
Mazandaran (1403) | 4435 | 4320 | [35] | |
Mazandaran (1502) | 4725 | 4090 | [36] | |
Guilan (1202) | 4425 | 3940 | [37] | |
Guilan (1202) | 4916 | 3940 | [38] | |
Maze | Eastern Azarbayjan (3019) | 7754 | 6270 | [39] |
Tehran(4134) | 4820 | 7040 | [40] | |
Fars (4323) | 7680 | 6390 | [41] | |
Sugar cane | Khozestan (2302) | 20780 | 21340 | [42] |
Saved water with/without water stress in MCM | ||||||
No water stress | 15% water tress | |||||
Climate | 65% | 100% | 56% | 65% | 100% | |
Wheat | A_Cl_W | 157 | 500 | 168 | 302 | 594 |
SH_Cl_W | 2 | 6 | 2 | 4 | 8 | |
A_Cl_VW | 378 | 1200 | 434 | 751 | 1443 | |
SA_Cd_W | 2 | 6 | 2 | 4 | 7 | |
SA_Cl_W | 88 | 281 | 91 | 167 | 332 | |
A_M_VW | 90 | 286 | 104 | 179 | 344 | |
Rice | A_Cl_W | 76 | 240 | 91 | 154 | 291 |
SH_Cl_W | 11 | 35 | 12 | 21 | 42 | |
A_Cl_VW | 144 | 459 | 155 | 278 | 546 | |
SA_Cl_W | 168 | 534 | 173 | 317 | 631 | |
A_M_VW | 77 | 245 | 70 | 137 | 284 | |
Maize | A_Cl_W | 87 | 278 | 92 | 167 | 330 |
SH_Cl_W | 10 | 32 | 11 | 19 | 38 | |
A_Cl_VW | 296 | 941 | 317 | 569 | 1118 | |
SA_Cl_W | 165 | 525 | 170 | 312 | 620 | |
A_M_VW | 37 | 119 | 39 | 71 | 140 | |
Sugar beet | A_Cl_W | 320 | 1017 | 353 | 624 | 1214 |
SH_Cl_W | 4 | 11 | 4 | 7 | 13 | |
A_Cl_VW | 217 | 688 | 237 | 421 | 821 | |
SA_Cd_W | 5 | 16 | 6 | 10 | 20 | |
SA_Cl_W | 193 | 613 | 209 | 373 | 730 | |
A_M_VW | 24 | 76 | 26 | 46 | 90 | |
Forage maize | A_Cl_W | 227 | 722 | 243 | 436 | 858 |
SH_Cl_W | 3 | 10 | 3 | 6 | 12 | |
A_Cl_VW | 400 | 1272 | 431 | 772 | 1514 | |
SA_Cd_W | 3 | 10 | 3 | 6 | 12 | |
SA_Cl_W | 181 | 574 | 198 | 351 | 685 | |
A_M_VW | 46 | 147 | 50 | 90 | 176 | |
Sugar cane | A_M_VW | 71 | 225 | 78 | 138 | 269 |
Total | 3482 | 11068 | 3772 | 6732 | 13182 |