This study investigated the impact of perceived corporate social responsibility (CSR) on customer loyalty in Vietnam's banking sector, with customer trust as a mediating factor. While prior research has examined CSR's direct influence on customer loyalty, limited studies have explored its indirect effects in developing economies. Using a survey-based approach, data were collected from 386 banking customers across 11 major banks in Vietnam and analyzed through partial least squares structural equation modeling (PLS-SEM). The findings confirm that CSR perception positively affects customer loyalty both directly and indirectly through customer trust. This highlights the strategic importance of CSR in building long-term customer relationships and competitive advantages for banks. The study provides valuable insights for bank managers on designing CSR initiatives that enhance customer trust and loyalty.
Citation: Hung Manh Pham, Nhi Yen Thi Nguyen. From responsibility to reward: Does corporate social responsibility perception enhance customer loyalty in Vietnamese banking sector?[J]. Quantitative Finance and Economics, 2025, 9(2): 274-299. doi: 10.3934/QFE.2025009
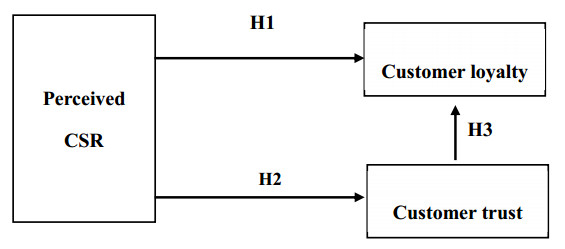
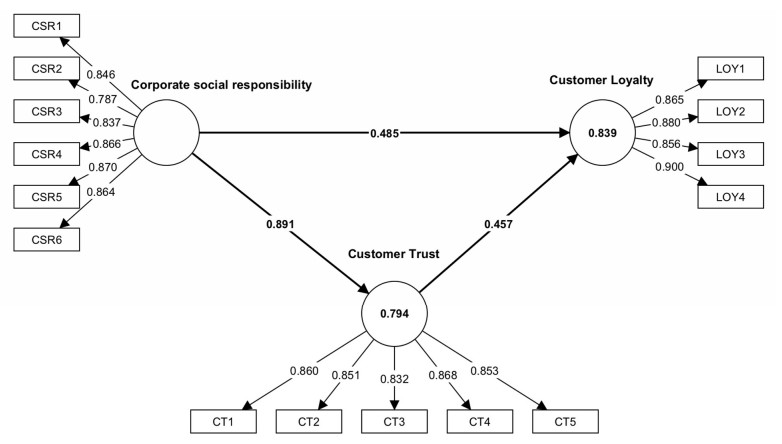
This study investigated the impact of perceived corporate social responsibility (CSR) on customer loyalty in Vietnam's banking sector, with customer trust as a mediating factor. While prior research has examined CSR's direct influence on customer loyalty, limited studies have explored its indirect effects in developing economies. Using a survey-based approach, data were collected from 386 banking customers across 11 major banks in Vietnam and analyzed through partial least squares structural equation modeling (PLS-SEM). The findings confirm that CSR perception positively affects customer loyalty both directly and indirectly through customer trust. This highlights the strategic importance of CSR in building long-term customer relationships and competitive advantages for banks. The study provides valuable insights for bank managers on designing CSR initiatives that enhance customer trust and loyalty.

| [1] |
Ahn J, Shamim A, Park J (2021) Impacts of cruise industry corporate social responsibility reputation on customers' loyalty: Mediating role of trust and identification. Int J Hosp Manag 92: 102706. https://doi.org/10.1016/j.ijhm.2020.102706 doi: 10.1016/j.ijhm.2020.102706

|
| [2] |
Al-Ghamdi SAA, Badawi NS (2019) Do corporate social responsibility activities enhance customer satisfaction and customer loyalty? Evidence from the Saudi banking sector. Cogent Bus Manag 6: 1662932. https://doi.org/10.1080/23311975.2019.1662932 doi: 10.1080/23311975.2019.1662932
|
| [3] |
Anneli Järvinen R (2014) Consumer trust in banking relationships in Europe. Int J Bank Mark 32: 551–566. https://doi.org/10.1108/IJBM-08-2013-0086 doi: 10.1108/IJBM-08-2013-0086
|
| [4] |
Aramburu IA, Pescador IG (2019) The Effects of Corporate Social Responsibility on Customer Loyalty: The Mediating Effect of Reputation in Cooperative Banks Versus Commercial Banks in the Basque Country. J Bus Ethics 154: 701–719. https://doi.org/10.1007/s10551-017-3438-1 doi: 10.1007/s10551-017-3438-1
|
| [5] |
Balcombe P, Rigby D, Azapagic A (2013) Motivations and barriers associated with adopting microgeneration energy technologies in the UK. Renew Sustain Energy Rev 22: 655–666. https://doi.org/10.1016/j.rser.2013.02.012 doi: 10.1016/j.rser.2013.02.012
|
| [6] |
Beerli A, Martín JD, Quintana A (2004) A model of customer loyalty in the retail banking market. Eur J Mark 38: 253–275. https://doi.org/10.1108/03090560410511221 doi: 10.1108/03090560410511221
|
| [7] |
Bennett R, Rundel-Thiele S (2005) The brand loyalty life cycle: Implications for marketers. J Brand Manag 12: 250–263. https://doi.org/10.1057/palgrave.bm.2540221 doi: 10.1057/palgrave.bm.2540221
|
| [8] | Brown TA (2015) Confirmatory factor analysis for applied research. New York: Guilford Press. |
| [9] |
Carrigan M, Attalla A (2001) The myth of the ethical consumer–do ethics matter in purchase behaviour? J Consum Mark 18: 560. https://doi.org/10.1108/07363760110410263 doi: 10.1108/07363760110410263
|
| [10] |
Carroll AB (1979) A three-dimensional conceptual model of corporate performance. Acad Manage Rev 4: 497. https://doi.org/10.2307/257850 doi: 10.2307/257850
|
| [11] |
Carroll AB (1991) The pyramid of corporate social responsibility: Toward the moral management of organizational stakeholders. Bus Horiz 34: 39–48. https://doi.org/10.1016/0007-6813(91)90005-G doi: 10.1016/0007-6813(91)90005-G
|
| [12] |
Chaudhuri A, Holbrook MB (2001) The Chain of Effects from Brand Trust and Brand Affect to Brand Performance: The Role of Brand Loyalty. J Mark 65: 81–93. https://doi.org/10.1509/jmkg.65.2.81.18255 doi: 10.1509/jmkg.65.2.81.18255
|
| [13] |
Chen Y (2013) Towards green loyalty: Driving from green perceived value, green satisfaction, and green trust. Sustain Dev 21: 294. https://doi.org/10.1002/sd.500 doi: 10.1002/sd.500
|
| [14] |
Choi B, La S (2013) The impact of corporate social responsibility (CSR) and customer trust on the restoration of loyalty after service failure and recovery. J Serv Mark 27: 223. https://doi.org/10.1108/08876041311330717 doi: 10.1108/08876041311330717
|
| [15] |
Chomvilailuk R, Butcher K (2014) Effects of quality and corporate social responsibility on loyalty. Serv Ind J 34: 938. https://doi.org/10.1080/02642069.2014.915952 doi: 10.1080/02642069.2014.915952
|
| [16] | Cohen J (2013) Statistical power analysis for the behavioral sciences. New York: Routledge. https://doi.org/10.4324/9780203771587 |
| [17] |
Dagger TS, Danaher PJ, Gibbs BJ (2009) How often versus how long: The interplay of contact frequency and relationship duration in customer-reported service relationship strength. J Serv Res 11: 371. https://doi.org/10.1177/1094670508331251 doi: 10.1177/1094670508331251
|
| [18] |
Delgado‐Ballester E, Luis Munuera‐Alemán J (2005) Does brand trust matter to brand equity? J Prod Brand Manag 14: 187. https://doi.org/10.1108/10610420510601058 doi: 10.1108/10610420510601058
|
| [19] |
Dick AS, Basu K (1994) Customer Loyalty: Toward an Integrated Conceptual Framework. J Acad Mark Sci 22: 99–113. https://doi.org/10.1177/0092070394222001 doi: 10.1177/0092070394222001
|
| [20] | Donaldson B, O'Toole T (2007) Strategic market relationships: From strategy to implementation. Chichester: Wiley |
| [21] |
Du S, Bhattacharya CB, Sen S (2010) Maximizing Business Returns to Corporate Social Responsibility (CSR): The Role of CSR Communication. Int J Manag Rev 12: 8–19. https://doi.org/10.1111/j.1468-2370.2009.00276.x doi: 10.1111/j.1468-2370.2009.00276.x
|
| [22] |
Eisingerich AB, Rubera G, Seifert M, et al. (2011) Doing good and doing better despite negative information? The role of corporate social responsibility in consumer resistance to negative information. J Serv Res 14: 60. https://doi.org/10.1177/1094670510389164 doi: 10.1177/1094670510389164
|
| [23] |
Ennew C, Kharouf H, Sekhon H (2011) Trust in UK financial services: A longitudinal analysis. J Financ Serv Mark 16: 65. https://doi.org/10.1057/fsm.2011.8 doi: 10.1057/fsm.2011.8
|
| [24] | European Commission (2011) A renewed EU strategy 2011–14 for corporate social responsibility. European Commission. Available from: https://commission.europa.eu/business-economy-euro/doing-business-eu/sustainability-due-diligence-responsible-business/corporate-social-responsibility-csr_en. |
| [25] |
Fatma M, Khan I (2023) How do bank customers' perceptions of CSR influence marketing outcomes: Their trust, identification, and commitment? Sustainability 15: 6000. https://doi.org/10.3390/su15076000 doi: 10.3390/su15076000
|
| [26] |
Fornell C, Larcker DF (1981) Evaluating structural equation models with unobservable variables and measurement error. J Mark Res 18: 39–50. https://doi.org/10.1177/002224378101800104 doi: 10.1177/002224378101800104
|
| [27] | Freeman RE, Harrison JS, Wicks AC, et al. (2010) Stakeholder theory: The state of the art. Cambridge: Cambridge University Press. https://doi.org/10.1017/CBO9780511815768 |
| [28] | Freeman RE, Harrison JS, Zyglidopoulos S (2018) Stakeholder theory: Concepts and strategies. Cambridge: Cambridge University Press. https://doi.org/10.1017/9781108539500 |
| [29] | Gallo A (2014) The value of keeping the right customers. Harv Bus Rev 29: 304 |
| [30] |
Green T, Peloza J (2011) How does corporate social responsibility create value for consumers? J Consum Mark 28: 48–56. https://doi.org/10.1108/07363761111101949 doi: 10.1108/07363761111101949
|
| [31] | Hair JF Jr, Hult GTM, Ringle CM, et al. (2021) Partial least squares structural equation modeling (PLS-SEM) using R: A workbook. Cham: Springer. https://doi.org/10.1007/978-3-030-80519-7 |
| [32] |
Hapsari R, Hussein AS, Handrito RP (2020) Being fair to customers: A strategy in enhancing customer engagement and loyalty in the Indonesia mobile telecommunication industry. Serv Mark Q 41: 49–67. https://doi.org/10.1080/15332969.2019.1707375 doi: 10.1080/15332969.2019.1707375
|
| [33] |
Harris LC, Goode MMH (2004) The four levels of loyalty and the pivotal role of trust: A study of online service dynamics. J Retail 80: 139–158. https://doi.org/10.1016/j.jretai.2004.04.002 doi: 10.1016/j.jretai.2004.04.002
|
| [34] |
Harrison McKnight D, Choudhury V, Kacmar C (2002) The impact of initial consumer trust on intentions to transact with a web site: A trust building model. J Strateg Inf Syst 11: 297–323. https://doi.org/10.1016/S0963-8687(02)00020-3 doi: 10.1016/S0963-8687(02)00020-3
|
| [35] |
He H, Li Y (2011) CSR and service brand: The mediating effect of brand identification and moderating effect of service quality. J Bus Ethics 100: 673–688. https://doi.org/10.1007/s10551-010-0703-y doi: 10.1007/s10551-010-0703-y
|
| [36] |
He Y, Lai KK (2014) The effect of corporate social responsibility on brand loyalty: The mediating role of brand image. Total Qual Manag Bus Excell 25: 249–263. https://doi.org/10.1080/14783363.2012.661138 doi: 10.1080/14783363.2012.661138
|
| [37] |
Henseler J, Ringle CM, Sarstedt M (2015) A new criterion for assessing discriminant validity in variance-based structural equation modeling. J Acad Mark Sci 43: 115–135. https://doi.org/10.1007/s11747-014-0403-8 doi: 10.1007/s11747-014-0403-8
|
| [38] |
Huifeng P, Ha HY (2021) Effects of mobile service operator promotions in repurchase behaviour in South Korea: A longitudinal study. Asia Pac Bus Rev 27: 583–594. https://doi.org/10.1080/13602381.2020.1859715 doi: 10.1080/13602381.2020.1859715
|
| [39] |
Hussein AS, Sumiati S, Hapsari R, Abu Bakar J (2023) Bank 4.0 experiential quality and customer loyalty: A serial mediating role of customer trust and engagement. TQM J 35: 1706–1721. https://doi.org/10.1108/TQM-11-2021-0344 doi: 10.1108/TQM-11-2021-0344
|
| [40] |
Iannotta G, Nocera G, Sironi A (2013) The impact of government ownership on bank risk. J Financ Intermed 22: 152–176. https://doi.org/10.1016/j.jfi.2012.11.002 doi: 10.1016/j.jfi.2012.11.002
|
| [41] |
Ibrahim Mohamad Ibrahim R, Bayram P (2024) The effect of customer engagement on customer loyalty: Indication from the insurance industry in Jordan. J Financ Serv Mark 29: 406–422. https://doi.org/10.1057/s41264-023-00216-w doi: 10.1057/s41264-023-00216-w
|
| [42] |
Iglesias O, Markovic S, Bagherzadeh M, et al. (2020) Co-creation: A key link between corporate social responsibility, customer trust, and customer loyalty. J Bus Ethics 163: 151–166. https://doi.org/10.1007/s10551-018-4015-y doi: 10.1007/s10551-018-4015-y
|
| [43] |
Islam T, Islam R, Pitafi AH, et al. (2021) The impact of corporate social responsibility on customer loyalty: The mediating role of corporate reputation, customer satisfaction, and trust. Sustain Prod Consum 25: 123–135. https://doi.org/10.1016/j.spc.2020.07.019 doi: 10.1016/j.spc.2020.07.019
|
| [44] |
Jin N, Lee S, Huffman L (2012) Impact of restaurant experience on brand image and customer loyalty: Moderating role of dining motivation. J Travel Tour Mark 29: 532–551. https://doi.org/10.1080/10548408.2012.701552 doi: 10.1080/10548408.2012.701552
|
| [45] | Kartsonakis S, Grigoroudis E (2023) Corporate social responsibility, customer satisfaction, and customer loyalty in banking institutions: A literature review, In: Gaganis, C., Pasiouras, F., Tasiou, M., Zopounidis, C. (eds), Sustainable Finance and ESG. Palgrave Macmillan Studies in Banking and Financial Institutions. Palgrave Macmillan, Cham. https://doi.org/10.1007/978-3-031-24283-0_34 |
| [46] |
Khan Z, Ferguson D, Pérez A (2015) Customer responses to CSR in the Pakistani banking industry. Int J Bank Mark 33: 471–493. https://doi.org/10.1108/IJBM-07-2014-0097 doi: 10.1108/IJBM-07-2014-0097
|
| [47] |
Leclercq-Machado L, Alvarez-Risco A, Esquerre-Botton S, et al. (2022) Effect of corporate social responsibility on consumer satisfaction and consumer loyalty of private banking companies in Peru. Sustainability 14: 9078. https://doi.org/10.3390/su14159078 doi: 10.3390/su14159078
|
| [48] |
Lombart C, Louis D (2014) A study of the impact of corporate social responsibility and price image on retailer personality and consumers' reactions (satisfaction, trust and loyalty to the retailer). J Retail Consum Serv 21: 630–642. https://doi.org/10.1016/j.jretconser.2013.11.009 doi: 10.1016/j.jretconser.2013.11.009
|
| [49] |
Poolthong Y, Mandhachitara R (2009) Customer Expectations of CSR, Perceived Service Quality and Brand Effect in Thai Retail Banking. Int J Bank Mark 27: 408–427. https://doi.org/10.1108/02652320910988302 doi: 10.1108/02652320910988302
|
| [50] |
Mascarenhas OA, Kesavan R, Bernacchi M (2006) Lasting customer loyalty: A total customer experience approach. J Consum Mark 23: 397–405. https://doi.org/10.1108/07363760610712939 doi: 10.1108/07363760610712939
|
| [51] |
Mende M, Bolton RN (2011) Why attachment security matters: How customers' attachment styles influence their relationships with service firms and service employees. J Serv Res 14: 285–301. https://doi.org/10.1177/1094670511411173 doi: 10.1177/1094670511411173
|
| [52] |
Moorman C, Deshpandé R, Zaltman G (1993) Factors affecting trust in market research relationships. J Mark 57: 81–101. https://doi.org/10.1177/002224299305700106 doi: 10.1177/002224299305700106
|
| [53] |
Morgan RM, Hunt SD (1994) The commitment-trust theory of relationship marketing. J Mark 58: 20–38. https://doi.org/10.1177/002224299405800302 doi: 10.1177/002224299405800302
|
| [54] |
Muflih M (2021) The link between corporate social responsibility and customer loyalty: Empirical evidence from the Islamic banking industry. J Retail Consum Serv 61: 102558. https://doi.org/10.1016/j.jretconser.2021.102558 doi: 10.1016/j.jretconser.2021.102558
|
| [55] |
My Sang T, Hung NT, Dinh NN (2023) Enhancing CSR activities to increase bank attractiveness. Cogent Bus Manag 10: 2247623. https://doi.org/10.1080/23311975.2023.2247623 doi: 10.1080/23311975.2023.2247623
|
| [56] | Nunnally J, Bernstein I (1994) The assessment of reliability. In: Psychometric theory, 3rd edn. New York: McGraw-Hill, 248–292 |
| [57] |
Öberseder M, Schlegelmilch BB, Murphy PE, et al. (2014) Consumers' perceptions of corporate social responsibility: Scale development and validation. J Bus Ethics 124: 101–115. https://doi.org/10.1007/s10551-013-1787-y doi: 10.1007/s10551-013-1787-y
|
| [58] |
Oliver RL (1999) Whence consumer loyalty? J Mark 63: 33. https://doi.org/10.2307/1252099 doi: 10.2307/1252099
|
| [59] |
Özkan P, Süer S, Keser İK, et al. (2019) The effect of service quality and customer satisfaction on customer loyalty: The mediation of perceived value of services, corporate image, and corporate reputation. Int J Bank Mark 38: 384–405. https://doi.org/10.1108/IJBM-03-2019-0096 doi: 10.1108/IJBM-03-2019-0096
|
| [60] |
Pahlevi MR, Suhartanto D (2020) The integrated model of green loyalty: Evidence from eco-friendly plastic products. J Clean Prod 257: 120844. https://doi.org/10.1016/j.jclepro.2020.120844 doi: 10.1016/j.jclepro.2020.120844
|
| [61] |
Palmatier RW, Dant RP, Grewal D, et al. (2006) Factors influencing the effectiveness of relationship marketing: A meta-analysis. J Mark 70: 136–153. https://doi.org/10.1509/jmkg.70.4.136 doi: 10.1509/jmkg.70.4.136
|
| [62] |
Pan Y, Sheng S, Xie FT (2012) Antecedents of customer loyalty: An empirical synthesis and reexamination. J Retail Consum Serv 19: 150–158. https://doi.org/10.1016/j.jretconser.2011.11.004 doi: 10.1016/j.jretconser.2011.11.004
|
| [63] |
Park E, Kim KJ (2019) What drives "customer loyalty"? The role of corporate social responsibility. Sustain Dev 27: 304–311. https://doi.org/10.1002/sd.1901 doi: 10.1002/sd.1901
|
| [64] |
Paulík J, Kombo F, Ključnikov A (2015) CSR as a driver of satisfaction and loyalty in commercial banks in the Czech Republic. J Int Stud 8: https://doi.org/10.14254/2071-8330.2015/8-3/9 doi: 10.14254/2071-8330.2015/8-3/9
|
| [65] |
Pérez A, Del Mar García De Los Salmones M, Rodríguez Del Bosque I (2013) The effect of corporate associations on consumer behaviour. Eur J Mark 47: 218–238. https://doi.org/10.1108/03090561311285529 doi: 10.1108/03090561311285529
|
| [66] |
Pérez A, Rodríguez Del Bosque I (2015) Corporate social responsibility and customer loyalty: Exploring the role of identification, satisfaction and type of company. J Serv Mark 29: 15–25. https://doi.org/10.1108/JSM-10-2013-0272 doi: 10.1108/JSM-10-2013-0272
|
| [67] |
Pham HM, Pham AD, Tran DV, et al. (2024) Integrating CSR with environmental consciousness and commitment: Pathways to employee stewardship in Vietnam's mechanical manufacturing sector. Bus Strat Dev 7: e70036. https://doi.org/10.1002/bsd2.70036 doi: 10.1002/bsd2.70036
|
| [68] |
Platonova E, Asutay M, Dixon R, et al. (2018) The impact of corporate social responsibility disclosure on financial performance: Evidence from the GCC Islamic banking sector. J Bus Ethics 151: 451–471. https://doi.org/10.1007/s10551-016-3229-0 doi: 10.1007/s10551-016-3229-0
|
| [69] |
Reinartz W, Haenlein M, Henseler J (2009) An empirical comparison of the efficacy of covariance-based and variance-based SEM. Int J Res Mark 26: 332–344. https://doi.org/10.1016/j.ijresmar.2009.08.001 doi: 10.1016/j.ijresmar.2009.08.001
|
| [70] |
Schwartz MS, Carroll AB (2003) Corporate social responsibility: A three-domain approach. Bus Ethics Q 13: 503–530. https://doi.org/10.5840/beq200313435 doi: 10.5840/beq200313435
|
| [71] |
Shen CH, Wu MW, Chen TH, et al. (2016) To engage or not to engage in corporate social responsibility: Empirical evidence from global banking sector. Econ Model 55: 207–225. https://doi.org/10.1016/j.econmod.2016.02.007 doi: 10.1016/j.econmod.2016.02.007
|
| [72] |
Shmueli G, Sarstedt M, Hair JF, et al. (2019) Predictive model assessment in PLS-SEM: guidelines for using PLSpredict. Eur J Mark 53: 2322–2347. https://doi.org/10.1108/EJM-02-2019-0189 doi: 10.1108/EJM-02-2019-0189
|
| [73] |
Spence M (1973) Job market signaling. Q J Econ 87: 355. https://doi.org/10.2307/1882010 doi: 10.2307/1882010
|
| [74] |
Suh B, Han I (2003) The impact of customer trust and perception of security control on the acceptance of electronic commerce. Int J Electron Commer 7: 135–161. https://doi.org/10.1080/10864415.2003.11044270 doi: 10.1080/10864415.2003.11044270
|
| [75] |
Vo DH, Van LTH, Dinh LTH, et al. (2020) Financial inclusion, corporate social responsibility and customer loyalty in the banking sector in Vietnam. J Int Stud 13: 9–23. https://doi.org/10.14254/2071-8330.2020/13-4/1 doi: 10.14254/2071-8330.2020/13-4/1
|
| [76] | Vu K, Vietnam tycoon sentenced to death in $\$$12.5 billion fraud case. Reuters, 2024. Available from: https://www.reuters.com/world/asia-pacific/vietnam-tycoon-sentenced-death-12-billion-fraud-case-state-media-reports-2024-04-11/. |
| [77] |
Webb DJ, Mohr LA, Harris KE (2008) A re-examination of socially responsible consumption and its measurement. J Bus Res 61: 91–98. https://doi.org/10.1016/j.jbusres.2007.05.007 doi: 10.1016/j.jbusres.2007.05.007
|
| [78] |
Wirba AV (2023) Corporate social responsibility (CSR): The role of government in promoting CSR. J Knowl Econ 15: 7428–7454. https://doi.org/10.1007/s13132-023-01185-0 doi: 10.1007/s13132-023-01185-0
|
| [79] | World Bank (2004) Strengthening implementation of corporate social responsibility in global supply chains. Washington, DC: World Bank Group. Available from: https://documents.worldbank.org/curated/en/910481468324044035/pdf/346640Strengthening1Implementation.pdf. |
| [80] |
Wongkitrungrueng A, Assarut N (2020) The role of live streaming in building consumer trust and engagement with social commerce sellers. J Bus Res 117: 543–556. https://doi.org/10.1016/j.jbusres.2018.08.032 doi: 10.1016/j.jbusres.2018.08.032
|
| [81] |
Wu MW, Shen CH (2013) Corporate social responsibility in the banking industry: Motives and financial performance. J Bank Finance 37: 3529–3547. https://doi.org/10.1016/j.jbankfin.2013.04.023 doi: 10.1016/j.jbankfin.2013.04.023
|
| [82] |
Zeithaml VA, Berry LL, Parasuraman A (1996) The behavioral consequences of service quality. J Mark 60: 31–46. https://doi.org/10.1177/002224299606000203 doi: 10.1177/002224299606000203
|
| [83] |
Zidehsaraei M, Esmaeilpour R, Akbari M (2024) The effects of similarity of values, religious values, and empathy on bank commitment to CSR and customers' internal and behavioral responses: evidence from Guilan Province in Iran. J Financ Serv Mark 29: 154–170. https://doi.org/10.1057/s41264-022-00189-2 doi: 10.1057/s41264-022-00189-2
|
Figures(2) / Tables(10)

Hung Manh Pham, Nhi Yen Thi Nguyen. From responsibility to reward: Does corporate social responsibility perception enhance customer loyalty in Vietnamese banking sector?[J]. Quantitative Finance and Economics, 2025, 9(2): 274-299. doi: 10.3934/QFE.2025009


 DownLoad: