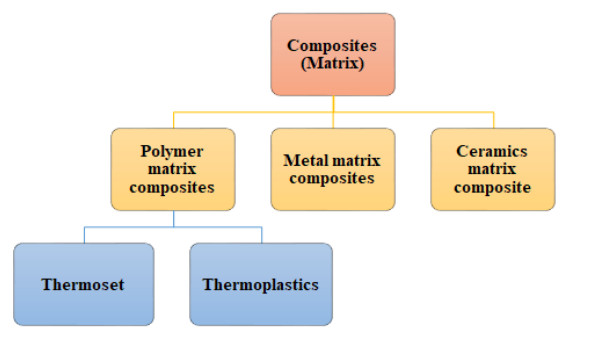
Environmental challenges associated with synthetic reinforcement in polymer composites, such as non-biodegradability and poor recyclability, require the exploration of various natural materials, especially from waste streams, to fully or partially replace such reinforcements. However, these natural fibers also present challenges such as high water absorption, low thermal stability, and average mechanical properties. To circumvent these problems, natural fiber-reinforced hybrid composites, which contain one or more types of natural reinforcement, are gaining increasing research interest. This paper presents a review of natural fiber-reinforced hybrid composites. Both thermoplastics and thermosets reinforced by natural and synthetic fibers (hybrid fibers) are reviewed. The properties of fibers and the resulting composites and processing techniques are summarized.
Citation: Kator Jeff Jomboh, Adele Dzikwi Garkida, Emmanuel Majiyebo Alemaka, Mohammed Kabir Yakubu, Vershima Cephas Alkali, Wilson Uzochukwu Eze, Nuhu Lawal. Properties and applications of natural, synthetic and hybrid fiber reinforced polymer composite: A review[J]. AIMS Materials Science, 2024, 11(4): 774-801. doi: 10.3934/matersci.2024038
Environmental challenges associated with synthetic reinforcement in polymer composites, such as non-biodegradability and poor recyclability, require the exploration of various natural materials, especially from waste streams, to fully or partially replace such reinforcements. However, these natural fibers also present challenges such as high water absorption, low thermal stability, and average mechanical properties. To circumvent these problems, natural fiber-reinforced hybrid composites, which contain one or more types of natural reinforcement, are gaining increasing research interest. This paper presents a review of natural fiber-reinforced hybrid composites. Both thermoplastics and thermosets reinforced by natural and synthetic fibers (hybrid fibers) are reviewed. The properties of fibers and the resulting composites and processing techniques are summarized.

| [1] |
Kafi A, Abedin MZ, Beg MDH, et al. (2006) Study on the mechanical properties of jute/glass fibre-reinforced unsaturated polyester hybrid composites: Effect of surface modification by ultraviolet radiation. J Reinf Plast Comp 25: 575–588. https://doi.org/10.1177/0731684405056437 doi: 10.1177/0731684405056437

|
| [2] |
Egbo MK (2021) A fundamental review on composite materials and some of their applications in biomedical engineering. J King Saud Univ–Eng Sci 33: 557–568. https://doi.org/10.1016/j.jksues.2020.07.007 doi: 10.1016/j.jksues.2020.07.007
|
| [3] | SmiComposites (2018) The most popular composite fabrication methods. Available from: https://www.smicomposites.com/the-most-popular-composite-fabrication-methods/. |
| [4] |
Keya KN, Kona NA, Koly FA, et al. (2019) Natural fiber reinforced polymer composites: history, types, advantages, and applications. Mater Eng Res 1: 69–85. https://doi.org/10.25082/MER.2019.02.006 doi: 10.25082/MER.2019.02.006
|
| [5] |
Saba N, Tahir PM, Jawaid M (2014) A review on potentiality of nano filler/natural fiber filled polymer hybrid composites. Polymers 6: 2247–2273. https://doi.org/10.3390/polym6082247 doi: 10.3390/polym6082247
|
| [6] |
Li H, Wang D, Zhang H, et al. (2022) Optimal design of vibro-impact resistant fiber reinforced composite plates with polyurea coating. Compos Struct 292: 115680. https://doi.org/10.1016/j.compstruct.2022.115680 doi: 10.1016/j.compstruct.2022.115680
|
| [7] |
De B, Bera M, Bhattacharjee D, et al. (2024) A comprehensive review on fiber-reinforced polymer composites: Raw materials to applications, recycling, and waste management. Progr Mater Sci 146: 101326. https://doi.org/10.1016/j.pmatsci.2024.101326 doi: 10.1016/j.pmatsci.2024.101326
|
| [8] |
Isa A, Nosbi N, Ismail MC, et al. (2022) A review on recycling of carbon fibers: Methods to reinforce and expected fiber composite degradations. Materials 15: 4991. https://doi.org/10.3390/ma15144991 doi: 10.3390/ma15144991
|
| [9] | Laouicia H, Benkhelladic A, Drouichea F, et al. (2024) Study of thermal and mechanical properties of fibers extracted from Algerian Agave americana L. and their polymer composites. Int J Mech Sci Adv Mat (IJMSAM) 1: 1–7. Available from: https://ensta.edu.dz/wp-content/uploads/2024/05/IJMSAM-24.pdf. |
| [10] |
Ismail SO, Akpan E, Dhakal HN (2022) Review on natural plant fibers and their hybrid composites for structural applications: Recent trends and future perspectives. Compos Part C 9: 100322. https://doi.org/10.1016/j.jcomc.2022.100322 doi: 10.1016/j.jcomc.2022.100322
|
| [11] |
Aldosari SM, Alotaibi BM, Alblalaihid KS, et al. (2024) Mechanical recycling of carbon fibee-reinforced polymer in a circular economy. Polymers 16: 1363. https://doi.org/10.3390/polym16101363 doi: 10.3390/polym16101363
|
| [12] | Rodriguez‐Castellanos W, Rodrigue D (2016) Production and characterization of hybrid polymer composites based on natural fibers, In: Poletto M, Composites from Renewable and Sustainable Materials, London: IntechOpen Limited. http://dx.doi.org/10.5772/64995 |
| [13] | Kim H (2014) Hybrid composites with natural fibers. Available from: Available from: https://core.ac.uk/download/pdf/33528249.pdf. |
| [14] | Almansour FA (2009) Interlaminar fracture toughness behaviour of flax/basalt reinforced vinyl ester hybrid composites. Available from: https://researchportal.port.ac.uk/en/studentTheses/interlaminar-fracture-toughness-behaviour-of-flaxbasalt-reinforce. |
| [15] |
Singh H, Singh T (2019) Effect of fillers of various sizes on mechanical characterization of natural fibee polymer hybrid composites: A review. Mater Today Proc 18: 5345–5350. https://doi.org/10.1016/j.matpr.2019.07.560 doi: 10.1016/j.matpr.2019.07.560
|
| [16] |
Sergi C, Sbardella F, Lilli M, et al. (2020) Hybrid cellulose–basalt polypropylene composites with enhanced compatibility: The role of coupling agent. Molecule 25: 4384. https://doi.org/10.3390/molecules25194384 doi: 10.3390/molecules25194384
|
| [17] |
Egbo MK (2020) A fundamental review on composite materials and some of their applications in biomedical engineering. J King Saud Univ–Eng Sci 33: 557–568. https://doi.org/10.1016/j.jksues.2020.07.007 doi: 10.1016/j.jksues.2020.07.007
|
| [18] | Techapaitoon M (2015) Tough natural-fiber composites. Available from: https://core.ac.uk/download/pdf/76996962.pdf. |
| [19] | Dawoud MM, Saleh HM (2018) Introductory chapter: Background on composite materials, In: Saleh HEM, Koller M, Characterizations of Some Composite Materials, London: IntechOpen Limited. https://doi.org/10.5772/intechopen.80960 |
| [20] | Advanced Materials in Transport Aircraft Structures "AMTAS" (2003) Overview of advanced composite materials and structures. Available from: https://courses.washington.edu/mengr450/Overview.pdf. |
| [21] | Squire GN, Abhyankar A, Watson KJ (2008) Composite material manufactured from a binder system including waste powder coating powder. WO 2008/020768 A1. Available from: https://patentimages.storage.googleapis.com/07/c5/ce/c86429e304a908/WO2008020768A1.pdf. |
| [22] |
Atmakuri A, Palevicius A, Vilkauskas A, et al. (2020) Review of hybrid fiber based composites with nano particles—Material properties and applications. Polymers 12: 2088. https://doi.org/10.3390/polym12092088 doi: 10.3390/polym12092088
|
| [23] |
Nurazzi NM, Asyraf MRM, Athiyah SF, et al. (2021) A review on mechanical performance of hybrid natural fiber polymer composites for structural applications. Polymers 13: 2170. https://doi.org/10.3390/polym13132170 doi: 10.3390/polym13132170
|
| [24] |
Premnath K, Arunprasath K, Sanjeevi R, et al. (2024) Natural/synthetic fiber reinforced hybrid composites on their mechanical behaviors—A review. Interactions 245: 111. https://doi.org/10.1007/s10751-024-01924-y doi: 10.1007/s10751-024-01924-y
|
| [25] |
Rajak DK, Pagar DD, Menezes PL, et al. (2019) Fiber-reinforced polymer composites: manufacturing, properties, and applications. Polymers 11: 1667. https://doi.org/10.3390/polym11101667 doi: 10.3390/polym11101667
|
| [26] |
Almushaikeh AM, Alaswad SO, Alsuhybani MS, et al. (2023) Manufacturing of carbon fiber reinforced thermoplastics and its recovery of carbon fiber: A review. Polym Test 122: 108029. https://doi.org/10.1016/j.polymertesting.2023.108029 doi: 10.1016/j.polymertesting.2023.108029
|
| [27] |
Obande W, Brádaigh CMO, Ray D (2021) Continuous fiber-reinforced thermoplastic acrylic-matrix composites prepared by liquid resin infusion—A review. Compos Part B-Eng 215: 108771. https://doi.org/10.1016/j.compositesb.2021.108771 doi: 10.1016/j.compositesb.2021.108771
|
| [28] |
Periasamy K, Kandare E, Das R, et al. (2023) Interfacial engineering methods in thermoplastic composites: An overview. Polymers 15: 415. https://doi.org/10.3390/polym15020415 doi: 10.3390/polym15020415
|
| [29] |
Jawaid M, Abdul Khalil HPS (2011) Cellulosic/synthetic fiber reinforced polymer hybrid composites: A review. Carbohydr Polym 86: 1–18. https://doi.org/10.1016/j.carbpol.2011.04.043 doi: 10.1016/j.carbpol.2011.04.043
|
| [30] |
Fredi G, Dorigato A, Fambri L, et al. (2020) Multifunctional structural composites for thermal energy storage. Multifunct Mater 3: 042001. https://doi.org/10.1088/2399-7532/abc60c doi: 10.1088/2399-7532/abc60c
|
| [31] | Girijappa YGT, Rangappa SM, Parameswaranpillai J, et al. (2019) Natural fibers as sustainable and renewable resource for development of eco-friendly composites: A comprehensive review. Frontiers Mater 6. https://doi.org/10.3389/fmats.2019.00226 |
| [32] |
Peç as P, Carvalho H, Salman H, et al. (2018) Natural fiber composites and their applications. J Compos Sci 2: 66. https://doi.org/10.3390/jcs2040066 doi: 10.3390/jcs2040066
|
| [33] |
Pickering KL, Efendy MGA, Le TM (2016) A review of recent developments in natural fiber composites and their mechanical performance. Compos Part A Appl Sci Manuf 83: 98–112. https://doi.org/10.1016/j.compositesa.2015.08.038 doi: 10.1016/j.compositesa.2015.08.038
|
| [34] |
Awais H, Nawab Y, Amjad A, et al. (2021) Environmental benign natural fiber reinforced thermoplastic composites: A review. Compos Part C 4: 100082. https://doi.org/10.1016/j.jcomc.2020.100082 doi: 10.1016/j.jcomc.2020.100082
|
| [35] |
Uzochukwu MI, Eze WU, Garba P, et al. (2020) Study on the physico-mechanical properties of treated baobab fiber (Adansonia Digitata) nano-filler/epoxy composite. Multiscale and Multidiscip Model Exp and Des 3: 151–159. https://doi.org/10.1007/s41939-020-00068-0 doi: 10.1007/s41939-020-00068-0
|
| [36] |
Zeleke Y, Rotich GK (2021) Design and development of false ceiling board using polyvinyl acetate (PVAc) composite reinforced with false banana fibers and filled with sawdust. Int J Polym Sci 2021: 5542329. https://doi.org/10.1155/2021/5542329 doi: 10.1155/2021/5542329
|
| [37] | Madu OG, Nwankwojike BN, Ani OI (2018) Optimal design for rice husk-saw dust reinforced polyester ceiling board. AJER 7: 11–16. Available from: https://www.ajer.org/papers/Vol-7-issue-6/B07061116.pdf. |
| [38] | Jomboh KJ, Yakubu MK, Eze WU, et al. (2023) Weathering resistance of post-consumer glass and sawdust reinforced polyester composites, In: Li BW, Ghosh D, Olevsky EA, et al, Advances in Powder and Ceramic Materials Science 2023. TMS 2023. The Minerals, Metals & Materials Series, Cham: Springer. https://doi.org/10.1007/978-3-031-22622-9_10 |
| [39] | Jomboh KJ, Garkida AD, Alemaka EM, et al. (2023) Optimization of post-consumer glass and sawdust reinforced polyester hybrid composites by mixture design analysis, In: The Minerals, Metals & Materials Society, TMS 2023 152nd Annual Meeting & Exhibition Supplemental Proceedings. TMS 2023. The Minerals, Metals & Materials Series, Cham: Springer. https://doi.org/10.1007/978-3-031-22524-6_70 |
| [40] | Garadimani KR, Raju GU, Kodancha KG (2015) Study on mechanical properties of corn cob particle and e-glass fiber reinforced hybrid polymer composites. Am J Mater Sci 5: 86–91. https://doi.10.5923/c.materials.201502.18 |
| [41] | Motoc DL (2015) Tailoring the effective properties of hybrid polymer based composite materials. Available from: https://www.unitbv.ro/documente/cercetare/doctorat-postdoctorat/abilitare/teze-de-abilitare/motoc-dana/05-MOTOC_LUCA-Teza_abilitare_ENG.pdf. |
| [42] | Jomboh KJ, Garkida AD, Alkali VC (2022) The effect of particle size on the morphology of polyester and epoxy-based auto-hybrid composites. In: The Minerals, Metals & Materials Society, TMS 2022 151st Annual Meeting & Exhibition Supplemental Proceedings. The Minerals, Metals & Materials Series, Cham: Springer, 599–608. https://doi.org/10.1007/978-3-030-92381-5_57 |
| [43] | Intertek (2015) Taber Abrasion ASTM D1044 (Haze), ASTM D4060 (Weight Loss). Available from: https://www.intertek.com/polymers/testlopedia/taber-abrasion/. |
| [44] |
Mohammed M, Jawad AJM, Mohammed AM, et al. (2023) Challenges and advancement in water absorption of natural fiber-reinforced polymer composites. Polym Test 124: 108083. https://doi.org/10.1016/j.polymertesting.2023.108083 doi: 10.1016/j.polymertesting.2023.108083
|
| [45] |
Khalid MA, Imran R, Arif ZU, et al. (2021) Developments in chemical treatments, manufacturing techniques and potential applications of natural-fibers-based biodegradable composites. Coatings 11: 293. https://doi.org/10.3390/coatings11030293 doi: 10.3390/coatings11030293
|
| [46] | Midani M, Elseify LA (2022) Natural fiber composites—A practical guide for industrial utilization. Int Fibre J. Available from: https://www.fiberjournal.com/natural-fiber-composites-a-practical-guide-for-industrial-utilization/. |
| [47] | Petroudy SRD (2017) 3-Physical and mechanical properties of natural fibers, In: Fan M, Fu F, Advanced High Strength Natural Fibre Composites in Construction, Cambridge: Woodhead Publishing, 59–83. https://doi.org/10.1016/B978-0-08-100411-1.00003-0 |
| [48] | Owonubi JS, Agwuncha CS, Anusionwu GC, et al. (2019) Fiber-matrix relationship for composites preparation, In: Pereira AB, Fernandes FAO, Renewable and Sustainable Composites, London: IntechOpen Limited. https://doi.org/10.5772/intechopen.84753 |
| [49] | Eze WU, Yakubu MK, Buba MA, et al. (2022) Effect of nano-structured bambara nut shell (Vigna Subterranea (L) Verdc) as filler on the physical mechanical and morphological properties of epoxy matrix. J Mater Environ Sci 13: 1155–1170. Available from: https://www.jmaterenvironsci.com/Document/vol13/vol13_N10/JMES-2022-13104-Eze.pdf. |
| [50] |
Sahu P, Gupta MK (2019) A review on the properties of natural fibers and its bio-composites: Effect of alkali treatment. J Mater Des Appl 234: 198–217. https://doi.org/10.1177/1464420719875163 doi: 10.1177/1464420719875163
|
| [51] | Dhaliwal JS (2019) Natural fibers: Application, In: Abbas M, Jeon HY, Generation, Development and Modifications of Natural Fibers, London: IntechOpen Limited. https://doi.org/doi:10.5772/intechopen.86884 |
| [52] |
Patel R, Dhar P, Babaei-Ghazvini A, et al. (2023) Transforming lignin into renewable fuels, chemicals and materials: A review. Bioresour Technol Rep 22: 101463. https://doi.org/10.1016/j.biteb.2023.101463 doi: 10.1016/j.biteb.2023.101463
|
| [53] |
Ahmad R, Hamid R, Osman SA (2019) Physical and chemical modifications of plant fibers for reinforcement in cementitious composites. Adv Civil Eng 2019: 5185806. https://doi.org/10.1155/2019/5185806 doi: 10.1155/2019/5185806
|
| [54] |
Kamarudin SH, Basri MSM, Rayung M, et al. (2022) A review on natural fiber reinforced polymer composites (NFRPC) for sustainable industrial applications. Polymers 14: 3698. https://doi.org/10.3390/polym14173698 doi: 10.3390/polym14173698
|
| [55] | Begum K, Islam M (2013) Natural fiber as a substitute to synthetic fiber in polymer composites: A review. Res J Eng Sci 2278: 9472. Available from: https://www.isca.me/IJES/Archive/v2/i4/10.ISCA-RJEngS-2013-010.pdf. |
| [56] |
Karim MA, Abdullah MZ, Deifalla AF, et al. (2023) An assessment of the processing parameters and application of fiber-reinforced polymers (FRPs) in the petroleum and natural gas industries: A review. Results Eng 18: 101091. https://doi.org/10.1016/j.rineng.2023.101091 doi: 10.1016/j.rineng.2023.101091
|
| [57] |
Mamolo SU, Sodano HA (2024) Interfacial reinforcement of carbon fiber composites through a chlorinated aramid nanofiber interphase. Compos Sci Tech 245: 110351. https://doi.org/10.1016/j.compscitech.2023.110351 doi: 10.1016/j.compscitech.2023.110351
|
| [58] | Nguyen H, Zatar W, Mutsuyoshi H (2017) Mechanical properties of hybrid polymer composite, In: Thakur VK, Thakur MK, Pappu A, Hybrid Polymer Composite Materials—Properties and Characterization, Cambridge: Woodhead Publishing, 83–113. https://doi.org/10.1016/B978-0-08-100787-7.00004-4 |
| [59] |
Bavan DS, Kumar GCM (2012) Finite element analysis of a natural fiber (maize) composite beam. J Eng 2013: 450381. https://doi.org/10.1155/2013/450381 doi: 10.1155/2013/450381
|
| [60] |
Gupta MK, Srivastava RK (2016) Mechanical properties of hybrid fibers-reinforced polymer composite: A review. Poly-Plast Technol Eng 55: 626–642. https://doi.org/10.1080/03602559.2015.1098694 doi: 10.1080/03602559.2015.1098694
|
| [61] |
Feng J, Safaei B, Qin Z, et al. (2023) Nature-inspired energy dissipation sandwich composites reinforced with high-friction grapheme. Compos Sci Technol 233: 109925. https://doi.org/10.1016/j.compscitech.2023.109925 doi: 10.1016/j.compscitech.2023.109925
|
| [62] |
Rajak DK, Wagh PH, Linul E (2022) A review on synthetic fibers for polymer matrix composites: performance, failure modes and applications. Materials 15: 4790. https://doi.org/10.3390/ma15144790 doi: 10.3390/ma15144790
|
| [63] |
Zeeshan M, Ali M, Anjum AS, et al. (2021) Optimization of mechanical/thermal properties of glass/flax/waste cotton hybrid composite. J Indust Textil 51: 768–787. https://doi.org/10.1177/1528083719891420 doi: 10.1177/1528083719891420
|
| [64] |
Kessler E, Gadow R, Straub J (2016) Basalt, glass and carbon fibers and their fiber reinforced polymer composites under thermal and mechanical load. AIMS Mater Sci 3: 1561–1576. https://doi.org/10.3934/matersci.2016.4.1561 doi: 10.3934/matersci.2016.4.1561
|
| [65] | Maiti S, Islam MI, Uddin MA, et al. (2022) Sustainable fiber-reinforced composites: A review. Adv Sustainable Syst 2200258. https://doi.org/10.1002/adsu.202200258 |
| [66] |
Munalli D, Dimitrakis G, Chronopoulos D, et al. (2019) Electromagnetic shielding effectiveness of carbon fiber reinforced composites. Compos Part B-Eng 173: 106906. https://doi.org/10.1016/j.compositesb.2019.106906 doi: 10.1016/j.compositesb.2019.106906
|
| [67] |
Begum S, Fazia S, Hashmi MSJ (2020) Polymer matrix composite with natural and synthetic fibers. Adv Mater Proc Tech 6: 547–564. https://doi.org/10.1080/2374068X.2020.1728645 doi: 10.1080/2374068X.2020.1728645
|
| [68] |
Umunakwe R, Oyetunji A, Adewuyi BO, et al. (2019) Mechanical properties and microstructure of hybrid vulcanized natural rubber filled with carbon black and nano-CaCO3 from achatina achatina shells. J Met Mater Miner 29: 80–89. https://doi.org/10.55713/jmmm.v29i4.555 doi: 10.55713/jmmm.v29i4.555
|
| [69] | Kausar A (2017) 5—Physical properties of hybrid polymer/clay composites, In: Thakur VK, Thakur MK, Pappu A, Hybrid Polymer Composite Materials—Properties and Characterization, Cambridge: Woodhead Publishing, 115–132. https://doi.org/10.1016/B978-0-08-100787-7.00005-6 |
| [70] |
Abdul-Khalil HPS, Kang CW, Khairul A, et al. (2009) The effect of different laminations on mechanical and physical properties of hybrid composites. J Reinf Plast Compos 28: 1123–1137. https://doi.org/10.1177/0731684407087755 doi: 10.1177/0731684407087755
|
| [71] | Corrosionpedia (2018) Weathering test—What does weathering test mean. Available from: https://www.corrosionpedia.com/definition/1396/weathering. |
| [72] |
Krishnasamy S, Thiagamani SMK, Kumar CM, et al. (2019) Recent advances in thermal properties of hybrid cellulosic fiber reinforced polymer composites. Int J Biol Macromol 141: 1–13. https://doi.org/10.1016/j.ijbiomac.2019.08.231 doi: 10.1016/j.ijbiomac.2019.08.231
|
| [73] |
Zheng X, Kim S, Park CV (2019) Enhancement of thermal conductivity of carbon fiber-reinforced polymer composite with copper and boron nitride particles. Compos Part A Appl Sci Manuf 121: 449–456. https://doi.org/10.1016/j.compositesa.2019.03.030 doi: 10.1016/j.compositesa.2019.03.030
|
| [74] |
Yang X, Liang C, Ma T, et al. (2018) A review on thermally conductive polymeric composites: Classification, measurement, model and equations, mechanism and fabrication methods. Adv Compos Hybrid Mater 1: 207–230. https://doi.org/10.1007/s42114-018-0031-8 doi: 10.1007/s42114-018-0031-8
|
| [75] |
Neto JSS, de Queiroz HFM, Aguiar RAA, et al. (2021) A review on the thermal characterization of natural and hybrid fiber composites. Polymers 13: 4425. https://doi.org/10.3390/polym13244425 doi: 10.3390/polym13244425
|
| [76] |
Ahmad S, Ali S, Salman M, et al. (2021) A comparative study on the effect of carbon-based and ceramic additives on the properties of fiber reinforced polymer matrix composites for high temperature applications. Ceram Inter 47: 33956–33971. https://doi.org/10.1016/j.ceramint.2021.08.356 doi: 10.1016/j.ceramint.2021.08.356
|
| [77] |
Kim Y, Lee S, Yoon H (2021) Fire-safe polymer composites: flame-retardant effect of nanofillers. Polymers 13: 540. https://doi.org/10.3390/polym13040540 doi: 10.3390/polym13040540
|
| [78] | Ngo TD (2018) Natural fibers for sustainable bio-composites, In: Günay E, Natural and Artificial Fiber-reinforced Composites as Renewable Sources, London: IntechOpen Limited. https://doi.org/10.5772/intechopen.71012 |
| [79] |
Corinaldesi V (2012) Study of lightweight mortars made of wooden waste. Adv Mater Res 2012: 34–41. https://doi.org/10.4028/www.scientific.net/AMR.548.34 doi: 10.4028/www.scientific.net/AMR.548.34
|
| [80] | Vieitez ER, Eder P, Villanueva A, et al. (2011) End-of-waste criteria (EoW) for glass cullet: Technical proposals. Available from: https://www.researchgate.net/publication/257987351_Study_of_Lightweight_Mortars_Made_of_Wooden_Waste. |
| [81] | Jomboh KJ (2023) Development of post-consumer glass and sawdust reinforced unsaturated polyester hybrid composite for particle board application, Ahmadu Bello University, Zaria. |
| [82] | Krishnaiah P (2017) Development of polylactide and polypropylene composites reinforced with sisal fibers and halloysite nanotubes for automotive and structural engineering applications. Available from: http://eprints.nottingham.ac.uk/43498/1/PhD%20Thesis_Prakash%20Krishnaiah.pdf. |
| [83] | Roylance D (2001) Finite element analysis. Available from: https://resources.saylor.org/wwwresources/archived/site/wp-content/uploads/2012/09/ME1023.2.3.pdf. |
| [84] | Nikishkov GP (2004) Introduction to the finite element method. Available from: https://citeseerx.ist.psu.edu/document?repid = rep1 & type = pdf & doi = d3fc5d5051cb464be2e4238f18ddf54d40576ddb. |
| [85] |
Liu Y, Zhao T, Ju W, et al. (2017) Materials discovery and design using machine learning. J Materiomics 3: 159–177. https://doi.org/10.1016/j.jmat.2017.08.002 doi: 10.1016/j.jmat.2017.08.002
|
| [86] |
Choi W, Advincula RC, Wu HF, et al. (2023) Artificial intelligence and machine learning in the design and additive manufacturing of responsive composites. MRS Communications 13: 714–724. https://doi.org/10.1557/s43579-023-00473-9 doi: 10.1557/s43579-023-00473-9
|
| [87] |
Steinhauser MO, Hiermaier S (2009) A review of computational methods in materials science: Examples from shock-wave and polymer physics. Int J Mol Sci 10: 5135–5216. https://doi.org/10.3390/ijms10125135 doi: 10.3390/ijms10125135
|
| [88] |
Müzel SD, Bonhin EP, Guimarães NM, et al. (2020) Application of the finite element method in the analysis of composite materials: A review. Polymers 12: 818. https://doi.org/10.3390/polym12040818 doi: 10.3390/polym12040818
|
| [89] |
Agarwal M, Pasupathy P, Wu X, et al. (2024) Multiscale computational and artificial intelligence modelsof linear and nonlinear composites. Small Sci 4: 2300185. https://doi.org/10.1002/smsc.202300185 doi: 10.1002/smsc.202300185
|
| [90] | Uzochukwu MI, Momoh OJ, Adebisi AA, et al. (2024) Evaluation of the mechanical properties of natural rubber/baobab (adansonia digitata) fiber nanocomposite using response surface methodology: A pedagogical approach. Chem Afr. https://doi.org/10.1007/s42250-024-00957-8 |
| [91] |
Adesina OT, Sadiku ER, Jamiru T, et al. (2019) Optimization of SPS processing parameters on the density and hardness properties of graphene reinforced polylactic acid nanocomposite. Int J Adv Manuf Technol 102: 4047–4058. https://doi.org/10.1007/s00170-019-03530-7 doi: 10.1007/s00170-019-03530-7
|
| [92] |
Razak SIA, Rahman WAWA, Sharif NFA, et al. (2012) Simultaneous numerical optimization of the mechanical and electrical properties of polyaniline coated kenaf fiber using response surface methodology: Nanostructured polyaniline on natural fiber. Compos Interfaces 19: 411–424. https://doi.org/10.1080/15685543.2012.757957 doi: 10.1080/15685543.2012.757957
|
| [93] |
Johnson AF, Pickett AK, Rozycki P (2001) Computational methods for predicting impact damage in composite structures. Compos Sci Tech 61: 2183–2192. https://doi.org/10.1016/S0266-3538(01)00111-7 doi: 10.1016/S0266-3538(01)00111-7
|


Figures(9) / Tables(1)

Kator Jeff Jomboh, Adele Dzikwi Garkida, Emmanuel Majiyebo Alemaka, Mohammed Kabir Yakubu, Vershima Cephas Alkali, Wilson Uzochukwu Eze, Nuhu Lawal. Properties and applications of natural, synthetic and hybrid fiber reinforced polymer composite: A review[J]. AIMS Materials Science, 2024, 11(4): 774-801. doi: 10.3934/matersci.2024038


 DownLoad: