Sago starch and cellulose fiber can be used as a raw material for making degradable plastics to replace commercial plastics. This research used corn cob fiber and sugarcane bagasse fiber as filler to improve the properties of degradable plastic. The research method consists of several stages, cellulose fiber preparation, degradable plastic synthesis and plastic characterization. The result showed tensile strength of plastic with corn cob and sugarcane bagasse filler was 6.37–11.5 MPa and 9.70–16.47 MPa, respectively. The compound composition test through Fourier Transformation Infra-Red (FTIR) exhibited hydrophilic behavior, hence plastic easily degraded by soil. Differential Scanning Calorimetry (DSC) shows that degradable plastic with corn cob fiber filler denoted a melting point of 163.84 ℃, while sugarcane bagasse fiber filler at 163.47 ℃. Thermogravimetric Analysis (TGA) analysis indicated degradable plastic had a good thermal stability. Scanning Electron Microscopy (SEM) exhibited few white lumps and indentations on the surface, indicating that the solubility was not homogeny and could be due to the influence of stirring process. In term of ability to absorb water, both plastic with fiber filler had a small water absorption with a range of 5–6%. Melt Flow Rate (MFR) analysis of degradable plastics with corn cob fiber and sugarcane bagasse pointed the value that was suitable for injection molding processing technique. The degradation of both plastics ranged about 50–85 days to completely decomposed naturally in soil, as supported by FTIR analysis.
Citation: Rozanna Dewi, Novi Sylvia, Zulnazri, Medyan Riza, Januar Parlaungan Siregar, Tezara Cionita, Budhi Santri Kusuma. Characterization of sago starch-based degradable plastic with agricultural waste cellulose fiber as filler[J]. AIMS Environmental Science, 2024, 11(2): 304-323. doi: 10.3934/environsci.2024014
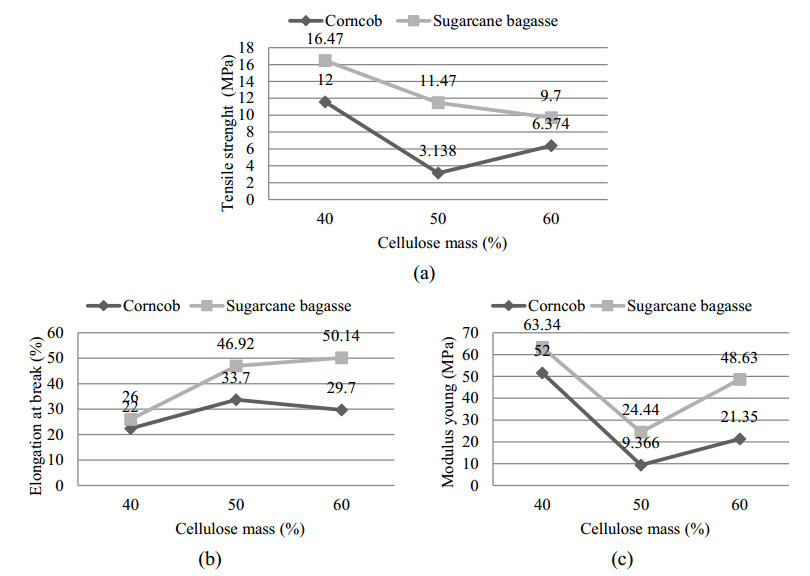
Sago starch and cellulose fiber can be used as a raw material for making degradable plastics to replace commercial plastics. This research used corn cob fiber and sugarcane bagasse fiber as filler to improve the properties of degradable plastic. The research method consists of several stages, cellulose fiber preparation, degradable plastic synthesis and plastic characterization. The result showed tensile strength of plastic with corn cob and sugarcane bagasse filler was 6.37–11.5 MPa and 9.70–16.47 MPa, respectively. The compound composition test through Fourier Transformation Infra-Red (FTIR) exhibited hydrophilic behavior, hence plastic easily degraded by soil. Differential Scanning Calorimetry (DSC) shows that degradable plastic with corn cob fiber filler denoted a melting point of 163.84 ℃, while sugarcane bagasse fiber filler at 163.47 ℃. Thermogravimetric Analysis (TGA) analysis indicated degradable plastic had a good thermal stability. Scanning Electron Microscopy (SEM) exhibited few white lumps and indentations on the surface, indicating that the solubility was not homogeny and could be due to the influence of stirring process. In term of ability to absorb water, both plastic with fiber filler had a small water absorption with a range of 5–6%. Melt Flow Rate (MFR) analysis of degradable plastics with corn cob fiber and sugarcane bagasse pointed the value that was suitable for injection molding processing technique. The degradation of both plastics ranged about 50–85 days to completely decomposed naturally in soil, as supported by FTIR analysis.

| [1] |
Robert Adhitama, Jesica Viona Setiawan, Mangihot Tua Goeltom, et al. (2023) Utilization of breadfruit (artocarpus altilis) peel waste and blood clam shell waste (anadara granosa) as raw materials for glycerol-plasticized degradable bioplastic production. Indonesian J Biotechnol Biodivers 1: 12–21. https://doi.org/10.47007/ijobb.v7i1.167. doi: 10.47007/ijobb.v7i1.167

|
| [2] |
Denny Akbar Tanjung, Novesar Jamarun, Syukri Arief, et al. (2022) Influence of LLDPE-g-MA on mechanical properties, degradation performance, and water absorption of thermoplastic sago starch blends. Indones J Chem 1: 171–178. https://doi.org/10.22146/ijc.68558. doi: 10.22146/ijc.68558
|
| [3] |
K J Falua, A Fokharel, A Babaei-Ghazvini, et al. (2022) Valorization of starch to biobased materials: a review. Polymers 14: 2215. https://doi.org/10.3390/polym14112215. doi: 10.3390/polym14112215
|
| [4] | E R M Saleh, K A Rakhman, S Samad (2022) Synthesis of biofoam from sago waste as a biodegradable food storage candidate. In First Asian PGPR Indonesian Chapter International eConference 2021, KnE Life Science 162–169. https://doi.org/10.18502/kls.v7i3.11117. |
| [5] | R Alebooyeh, A Mohammadi Nafchi, M Jokar (2012) The Effects of ZnOnanorodson the Characteristics of Sago Starch Biodegradable Films. J Chem Health Risks 2: 13–16. |
| [6] |
Hiba Shaghaleh, Xu Xu, Shifa Wang (2018) Current progress in production of biopolymeric materials based on cellulose, cellulose nanofibers, and cellulose derivatives. Roy Soc Chem RSC Adv 8: 825–842. https://doi.org/10.1039/C7RA11157F. doi: 10.1039/C7RA11157F
|
| [7] |
Binling Ai, Lili Zheng, Wenqi Li, et al. (2021) Biodegradable Cellulose Film Prepared From Banana Pseudo-Stem Using an Ionic Liquid for Mango Preservation Binling. Front Plant Sci 12: 625878. https://doi.org/10.3389/fpls.2021.625878. doi: 10.3389/fpls.2021.625878
|
| [8] |
Naresh Shahi, Byungjin Min, Bedanga Sapkota, et al. (2020) Rangari, Eco-Friendly Cellulose Nanofiber Extraction from Sugarcane Bagasse and Film Fabrication. Sustainability 12: 6015. https://doi.org/10.3390/su12156015. doi: 10.3390/su12156015
|
| [9] |
Alokika, Anu, Anil Kumar, Vinod Kumar, et al. (2021) Cellulosic and hemicellulosic fractions of sugarcane bagasse: Potential, challenges and future perspective. Int J Biol Macromol 169: 564–582. https://doi.org/10.1016/j.ijbiomac.2020.12.175. doi: 10.1016/j.ijbiomac.2020.12.175
|
| [10] | Jiarong Tian, Shaoping Qian, Zhaoyan Zhang et al. (2023) A facile approach for preparing nanofibrillated cellulose from bleached corn stalk with tailored surface functions. Cellulose 30: 5641–5656. |
| [11] |
Yingqi Kong, Shaoping Qian, Zhaoyan Zhang, et al. (2023) The impact of esterified nanofibrillated cellulose content on the properties of thermoplastic starch/PBAT biocomposite films through ball-milling. Int J Biol Macromol 253: 127462. https://doi.org/10.1016/j.ijbiomac.2023.127462 doi: 10.1016/j.ijbiomac.2023.127462
|
| [12] |
Alper Aksit, Teresa Menzel, Merve Aksit, et al. (2020) Properties of Styrene–Maleic Anhydride Copolymer Compatibilized Polyamide 66/Poly (Phenylene Ether) Blends: Effect of Maleic Anhydride Concentration and Copolymer Content. Materials 13: 1237. https://doi.org/10.3390/ma13051237. doi: 10.3390/ma13051237
|
| [13] |
Nor Izaida Ibrahim, Farah Syazwani Shahar, Mohamed Thariq Hameed Sultan, et al. (2021) Overview of Bioplastic Introduction and Its Applications in Product Packaging. Coatings 11: 1423. https://doi.org/10.3390/coatings11111423. doi: 10.3390/coatings11111423
|
| [14] | Waryat., M. Romli., A. Suryani., et al. (2013) Using of a Compatibilizer to Improve Morphological, Physical and Mechanical Properties of Biodegradable Plastic From Thermoplastic Starch/LLDPE Blends. Indones J Mater Sci 3: 214 – 221. |
| [15] |
Shiou Xuan Tan, Andri Andriyana, Hwai Chyuan Ong, et al. (2022) A Comprehensive Review on the Emerging Roles of Nanofillers and Plasticizers towards Sustainable Starch-Based Bioplastic Fabrication. Polymers 14: 664. https://doi.org/10.3390/polym14040664. doi: 10.3390/polym14040664
|
| [16] | Zheng Cao, Ying Lu, Cheng Zhang, et al. (2017) Effects of the chain-extender content on the structure and performance of poly (lactic acid)–poly (butylene succinate)–microcrystalline cellulose composites. J Appl Polym Sci 22: 44895. |
| [17] |
Pooja Saxena, Prashant Shukla, MS Gaur (2021) Thermal analysis of polymer blends and double layer by DSC. Sage J Polym Polym Compos 29: 9. https://doi.org/10.1177/0967391120984606. doi: 10.1177/0967391120984606
|
| [18] |
Chunhua Lou, Siyu Jiang, An Yan, et al. (2022) Self-extracted corn-stalk cellulose/epoxy resin composites. Sci Rep 12: 20968. https://doi.org/10.1038/s41598-022-25695-0. doi: 10.1038/s41598-022-25695-0
|
| [19] | Gadaleta G, De Gisi S, Chong ZK, et al. (2023) Degradation of thermoplastic cellulose acetate-based bioplastics by full-scale experimentation of industrial anaerobic digestion and composting. Chem Eng J 462: 142301. |
| [20] | K Hamad, M Kaseem, F Deri (2011) Melt Rheology of Poly (Lactic Acid)/Low Density Polyethylene Polymer Blends. Adv Chem Eng 1: 208–214. |
| [21] |
Rozanna Dewi, Novi Sylvia, Zulnazri, et al. (2023) Melt flow Index (MFI) analysis of sago based thermoplastic starch blend with polypropylene and polyethylene. Mater Today 87: 2214–7853. https://doi.org/10.1016/j.matpr.2023.04.173. doi: 10.1016/j.matpr.2023.04.173
|
| [22] | J. B. Engel, A. Ambrosi, I. C. Tessaro (2019) Development of biodegrdable starch-based foams incorporated with grape stalks for food packaging. Carbohydr Polym 225, 115234. |
| [23] | Lopez, O, Garcia, M.A, Villar, M.A, Gentili, A, Rodriguez, M.S, Albertengo, L (2014) Thermo-compression of biodegradable thermoplastic corn starch films containing chitin and chitosan. LWT-Food Sci Technol 57: 106–115. |
| [24] |
Parul Sahu, MK Gupta (2022) Water absorption behavior of cellulosic fibres polymer composites: A review on its effects and remedies. J Ind Text 51: 7480S–7512S. https://doi.org/10.1177/1528083720974424. doi: 10.1177/1528083720974424
|
| [25] | Celia Dolza, Eduardo Fages, Eloi Gonga, et al. (2021) Development and Characterization of Environmentally Friendly Wood Plastic Composites from Biobased Polyethylene and Short Natural Fibers Processed by Injection Moulding. Polymers 131692. https://doi.org/10.3390/polym13111692. |
| [26] | Akil HM, Santulli C, Sarasini F, et al. (2014) Environmental effects on the mechanical behaviour of pultruded jute/glass fibre-reinforced polyester hybrid composites. Composite Sci Technol 94: 62–70. |
| [27] | Azwa ZN, Yousif BF, Manalo AC, et al. (2013) A review on the degradability of polymeric composites based on natural fibres. Material Des 47: 424–442. |
| [28] |
Jung W, Savithri D, Sharma-Shivappa R, et al. (2020) Effect of Sodium Hydroxide Pretreatment on Lignin Monomeric Components of Miscanthus×giganteus and Enzymatic Hydrolysis. Waste Biomass Valor 11: 5891–5900. https://doi.org/10.1007/s12649-019-00859-8. doi: 10.1007/s12649-019-00859-8
|
| [29] | Subramanian N (2021) Biodegradable Plastic From Mixed Starch. Int J Mech Eng 3: 1009–1020. |
| [30] |
Averous L (2004) Biodegradable multiphase systems based on plasticized starch: A review. J Macromol Sci–Polymer Reviews 3: 231–274. https://doi.org/10.1081/MC-200029326. doi: 10.1081/MC-200029326
|
| [31] |
Gerardo Coppola, Maria Teresa Gaudio, Catia Giovanna Lopresto, et al. (2021) Bioplastic from Renewable Biomass: A Facile Solution for a Greener Environment. Earth Syst Environ 5: 231–251. https://doi.org/10.1007/s41748-021-00208-7 doi: 10.1007/s41748-021-00208-7
|


Figures(8) / Tables(3)

Rozanna Dewi, Novi Sylvia, Zulnazri, Medyan Riza, Januar Parlaungan Siregar, Tezara Cionita, Budhi Santri Kusuma. Characterization of sago starch-based degradable plastic with agricultural waste cellulose fiber as filler[J]. AIMS Environmental Science, 2024, 11(2): 304-323. doi: 10.3934/environsci.2024014


 DownLoad: