Possible complications, such as intestinal obstruction and inflammation of the intestinal tract, can have a detrimental effect on the prognosis after surgery for Hirschsprung disease. The aim of this study was to investigate the potential targets and mechanisms of action of echinacoside to improve the prognosis of Hirschsprung disease. Genes related to the disease were obtained through analysis of the GSE96854 dataset and four databases: OMIM, DisGeNET, Genecard and NCBI. The targets of echinacoside were obtained from three databases: PharmMapper, Drugbank and TargetNet. The intersection of disease genes and drug targets was validated by molecular docking. The valid docked targets were further explored for their expression by using immunohistochemistry. In this study, enrichment analysis was used to explore the mechanistic pathways involved in the genes. Finally, we identified CA1, CA2, CA9, CA12, DNMT1, RIMS2, RPGRIP1L and ZEB2 as the core targets. Except for ZEB2, which is predominantly expressed in brain tissue, the remaining seven genes show tissue specificity and high expression in the gastrointestinal tract. RIMS2 possesses a high mutation phenomenon in pan-cancer, while a validated ceRNA network of eight genes was constructed. The core genes are involved in several signaling pathways, including the one-carbon metabolic process, carbonate dehydratase activity and others. This study may help us to further understand the pharmacological mechanisms of echinacoside and provide new guidance and ideas to guide the treatment of Hirschsprung disease.
Citation: Enyang He, Yuhang Jiang, Diwei Wei, Yifan Wang, Wenjing Sun, Miao Jia, Bowen Shi, Hualei Cui. The potential effects and mechanism of echinacoside powder in the treatment of Hirschsprung's Disease[J]. Mathematical Biosciences and Engineering, 2023, 20(8): 14222-14240. doi: 10.3934/mbe.2023636
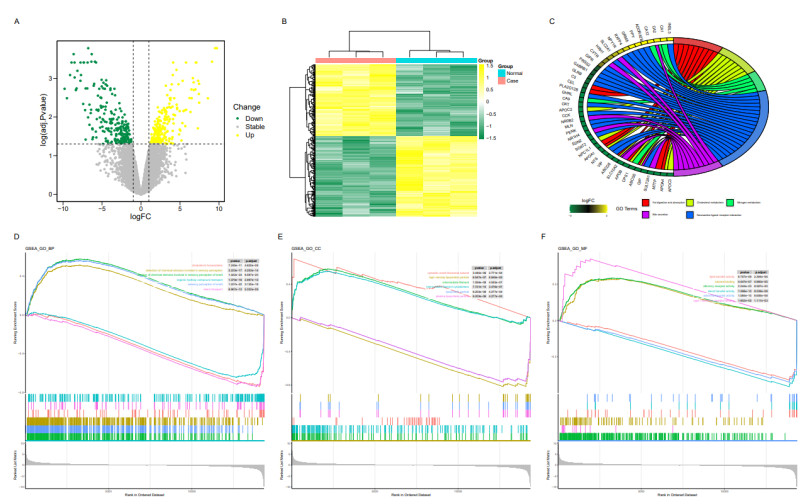
Possible complications, such as intestinal obstruction and inflammation of the intestinal tract, can have a detrimental effect on the prognosis after surgery for Hirschsprung disease. The aim of this study was to investigate the potential targets and mechanisms of action of echinacoside to improve the prognosis of Hirschsprung disease. Genes related to the disease were obtained through analysis of the GSE96854 dataset and four databases: OMIM, DisGeNET, Genecard and NCBI. The targets of echinacoside were obtained from three databases: PharmMapper, Drugbank and TargetNet. The intersection of disease genes and drug targets was validated by molecular docking. The valid docked targets were further explored for their expression by using immunohistochemistry. In this study, enrichment analysis was used to explore the mechanistic pathways involved in the genes. Finally, we identified CA1, CA2, CA9, CA12, DNMT1, RIMS2, RPGRIP1L and ZEB2 as the core targets. Except for ZEB2, which is predominantly expressed in brain tissue, the remaining seven genes show tissue specificity and high expression in the gastrointestinal tract. RIMS2 possesses a high mutation phenomenon in pan-cancer, while a validated ceRNA network of eight genes was constructed. The core genes are involved in several signaling pathways, including the one-carbon metabolic process, carbonate dehydratase activity and others. This study may help us to further understand the pharmacological mechanisms of echinacoside and provide new guidance and ideas to guide the treatment of Hirschsprung disease.

| [1] |
E. Panza, C. H. Knowles, C. Graziano, N. Thapar, A. J. Burns, M. Seri, et al., Genetics of human enteric neuropathies, Prog. Neurobiol., 96 (2012), 176–189. https://doi.org/10.1016/j.pneurobio.2012.01.001 doi: 10.1016/j.pneurobio.2012.01.001

|
| [2] |
A. M. Goldstein, N. Thapar, T. B. Karunaratne, R. De Giorgio, Clinical aspects of neurointestinal disease: Pathophysiology, diagnosis, and treatment, Dev. Biol., 417 (2016), 217–228. https://doi.org/10.1016/j.ydbio.2016.03.032 doi: 10.1016/j.ydbio.2016.03.032
|
| [3] |
S. B. Gabriel, R. Salomon, A. Pelet, M. Angrist, J. Amiel, M. Fornage, et al., Segregation at three loci explains familial and population risk in Hirschsprung disease, Nat. Genet., 31 (2002), 89–93. https://doi.org/10.1038/ng868 doi: 10.1038/ng868
|
| [4] |
E. G. Puffenberger, K. Hosoda, S. S. Washington, K. Nakao, D. deWit, M. Yanagisawa, et al., A missense mutation of the endothelin-B receptor gene in multigenic Hirschsprung's disease, Cell. 79 (1994), 1257–1266. https://doi.org/10.1016/0092-8674(94)90016-7 doi: 10.1016/0092-8674(94)90016-7
|
| [5] |
R. M. Hofstra, J. Osinga, G. Tan-Sindhunata, Y. Wu, E. J. Kamsteeg, R. P. Stulp, et al., A homozygous mutation in the endothelin-3 gene associated with a combined Waardenburg type 2 and Hirschsprung phenotype (Shah-Waardenburg syndrome), Nat. Genet., 12 (1996), 445–447. https://doi.org/10.1038/ng0496-445 doi: 10.1038/ng0496-445
|
| [6] |
R. M. Hofstra, O. Valdenaire, E. Arch, J. Osinga, H. Kroes, B. M. Löffler, et al., A loss-of-function mutation in the endothelin-converting enzyme 1 (ECE-1) associated with Hirschsprung disease, cardiac defects, and autonomic dysfunction, Am. J. Hum. Genet., 64 (1999), 304–308. https://doi.org/10.1086/302184 doi: 10.1086/302184
|
| [7] |
V. Pingault, N. Bondurand, K. Kuhlbrodt, D. E. Goerich, M. O. Préhu, A. Puliti, et al., SOX10 mutations in patients with Waardenburg-Hirschsprung disease, Nat. Genet., 18 (1998), 171–173. https://doi.org/10.1038/ng0298-171 doi: 10.1038/ng0298-171
|
| [8] |
J. Amiel, B. Laudier, T. Attié-Bitach, H. Trang, L. de Pontual, B. Gener, et al., Polyalanine expansion and frameshift mutations of the paired-like homeobox gene PHOX2B in congenital central hypoventilation syndrome, Nat. Genet., 33 (2003), 459–461. https://doi.org/10.1038/ng1130 doi: 10.1038/ng1130
|
| [9] |
R. O. Heuckeroth, Hirschsprung disease - integrating basic science and clinical medicine to improve outcomes, Nat. Rev. Gastroenterol. Hepatol., 15 (2018), 152–167. https://doi.org/10.1038/nrgastro.2017.149 doi: 10.1038/nrgastro.2017.149
|
| [10] |
S. S. Short, M. M. Durham, M. D. Rollins, Hirschsprung disease outcomes, Semin. Pediatr. Surg., 31 (2022), 151160. https://doi.org/10.1016/j.sempedsurg.2022.151160 doi: 10.1016/j.sempedsurg.2022.151160
|
| [11] |
T. Wang, X. Zhang, W. Xie, Cistanche deserticola Y. C. Ma, "Desert ginseng": a review, Am. J. Chin. Med., 40 (2012), 1123–1141. https://doi.org/10.1142/s0192415x12500838 doi: 10.1142/S0192415X12500838
|
| [12] |
J. Li, H. Yu, C. Yang, T. Ma, Y. Dai, Therapeutic Potential and Molecular Mechanisms of Echinacoside in Neurodegenerative Diseases, Front. Pharmacol., 13 (2022), 841110. https://doi.org/10.3389/fphar.2022.841110 doi: 10.3389/fphar.2022.841110
|
| [13] |
Y. Ni, J. Deng, X. Liu, Q. Li, J. Zhang, H. Bai, et al., Echinacoside reverses myocardial remodeling and improves heart function via regulating SIRT1/FOXO3a/MnSOD axis in HF rats induced by isoproterenol, J. Cell. Mol. Med., 25 (2021), 203–216. https://doi.org/10.1111/jcmm.15904 doi: 10.1111/jcmm.15904
|
| [14] |
X. Yang, Q. Yv, F. Ye, S. Chen, Z. He, W. Li, et al., Echinacoside Protects Dopaminergic Neurons Through Regulating IL-6/JAK2/STAT3 Pathway in Parkinson's Disease Model, Front. Pharmacol., 13 (2022), 848813. https://doi.org/10.3389/fphar.2022.848813 doi: 10.3389/fphar.2022.848813
|
| [15] |
Q. Song, J. Li, H. Huo, Y. Cao, Y. Wang, Y. Song, et al., Retention Time and Optimal Collision Energy Advance Structural Annotation Relied on LC-MS/MS: An Application in Metabolite Identification of an Antidementia Agent Namely Echinacoside, Anal. Chem., 91 (2019), 15040–15048. https://doi.org/10.1021/acs.analchem.9b03720 doi: 10.1021/acs.analchem.9b03720
|
| [16] |
L. Li, G. Wan, B. Han, Z. Zhang, Echinacoside alleviated LPS-induced cell apoptosis and inflammation in rat intestine epithelial cells by inhibiting the mTOR/STAT3 pathway, Biomed. Pharmacother., 104 (2018), 622–628. https://doi.org/10.1016/j.biopha.2018.05.072 doi: 10.1016/j.biopha.2018.05.072
|
| [17] |
S. Gao, T. Xu, H. Guo, Q. Deng, C. Xun, W. Liang, et al., Ameliorative effects of echinacoside against spinal cord injury via inhibiting NLRP3 inflammasome signaling pathway, Life Sci., 237 (2019), 116978. https://doi.org/10.1016/j.lfs.2019.116978 doi: 10.1016/j.lfs.2019.116978
|
| [18] |
D. M. Laughlin, F. Friedmacher, P. Puri, Total colonic aganglionosis: a systematic review and meta-analysis of long-term clinical outcome, Pediatr. Surg. Int., 28 (2012), 773–779. https://doi.org/10.1007/s00383-012-3117-3 doi: 10.1007/s00383-012-3117-3
|
| [19] |
L. S. Cheng, H. K. Graham, W. H. Pan, N. Nagy, A. Carreon-Rodriguez, A. M. Goldstein, et al., Optimizing neurogenic potential of enteric neurospheres for treatment of neurointestinal diseases, J. Surg. Res., 206 (2016), 451–459. https://doi.org/10.1016/j.jss.2016.08.035 doi: 10.1016/j.jss.2016.08.035
|
| [20] |
J. L. Mueller, A. M. Goldstein, The science of Hirschsprung disease: What we know and where we are headed, Semin. Pediatr. Surg., 31 (2022), 151157. https://doi.org/10.1016/j.sempedsurg.2022.151157 doi: 10.1016/j.sempedsurg.2022.151157
|
| [21] |
Y. Rehman, K. Bjørnland, K. J. Stensrud, I. N. Farstad, R. Emblem, Low incidence of enterocolitis and colonic mucosal inflammation in Norwegian patients with Hirschsprung's disease, Pediatr. Surg. Int., 25 (2009), 133–138. https://doi.org/10.1007/s00383-008-2300-z doi: 10.1007/s00383-008-2300-z
|
| [22] |
M. Heinrich, B. Häberle, D. von Schweinitz, M. Stehr, Re-operations for Hirschsprung's disease: long-term complications, Eur. J. Pediatr. Surg., 21 (2011), 325–330. https://doi.org/10.1055/s-0031-1284423 doi: 10.1055/s-0031-1284423
|
| [23] |
A. Gosain, A. S. Brinkman, Hirschsprung's associated enterocolitis, Curr. Opin. Pediatr., 27 (2015), 364–369. https://doi.org/10.1097/mop.0000000000000210 doi: 10.1097/MOP.0000000000000210
|
| [24] |
M. E. Ritchie, B. Phipson, D. Wu, Y. Hu, C. W. Law, W. Shi, et al., limma powers differential expression analyses for RNA-sequencing and microarray studies, Nucleic Acids Res., 43 (2015), e47. https://doi.org/10.1093/nar/gkv007 doi: 10.1093/nar/gkv007
|
| [25] |
J. S. Amberger, C. A. Bocchini, F. Schiettecatte, A. F. Scott, A. Hamosh, OMIM.org: Online Mendelian Inheritance in Man (OMIMⓇ), an online catalog of human genes and genetic disorders, Nucleic Acids Res., 43 (2015), D789–798. https://doi.org/10.1093/nar/gku1205 doi: 10.1093/nar/gku1205
|
| [26] |
J. Piñero, À. Bravo, N. Queralt-Rosinach, A. Gutiérrez-Sacristán, J. Deu-Pons, E. Centeno, et al., DisGeNET: a comprehensive platform integrating information on human disease-associated genes and variants, Nucleic Acids Res., 45 (2017), D833–d839. https://doi.org/10.1093/nar/gkw943 doi: 10.1093/nar/gkw943
|
| [27] |
J. Piñero, J. M. Ramírez-Anguita, J. Saüch-Pitarch, F. Ronzano, E. Centeno, F. Sanz, et al., The DisGeNET knowledge platform for disease genomics: 2019 update, Nucleic Acids Res., 48 (2020), D845-d855. https://doi.org/10.1093/nar/gkz1021 doi: 10.1093/nar/gkz1021
|
| [28] |
G. Stelzer, N. Rosen, I. Plaschkes, S. Zimmerman, M. Twik, S. Fishilevich, et al., The GeneCards Suite: From Gene Data Mining to Disease Genome Sequence Analyses, Curr Protoc Bioinformatics. 54 (2016), 1.30.31–31.30.33. https://doi.org/10.1002/cpbi.5 doi: 10.1002/cpbi.5
|
| [29] |
X. Liu, S. Ouyang, B. Yu, Y. Liu, K. Huang, J. Gong, et al., PharmMapper server: a web server for potential drug target identification using pharmacophore mapping approach, Nucleic Acids Res., 38 (2010), W609–614. https://doi.org/10.1093/nar/gkq300 doi: 10.1093/nar/gkq300
|
| [30] |
D. S. Wishart, Y. D. Feunang, A. C. Guo, E. J. Lo, A. Marcu, J. R. Grant, et al., DrugBank 5.0: A major update to the DrugBank database for 2018, Nucleic Acids Res., 46 (2018), D1074–d1082. https://doi.org/10.1093/nar/gkx1037 doi: 10.1093/nar/gkx1037
|
| [31] |
Z. J. Yao, J. Dong, Y. J. Che, M. F. Zhu, M. Wen, N. N. Wang, et al., TargetNet: a web service for predicting potential drug-target interaction profiling via multi-target SAR models, J. Comput. Aided Mol. Des., 30 (2016), 413–424. https://doi.org/10.1007/s10822-016-9915-2 doi: 10.1007/s10822-016-9915-2
|
| [32] |
G. Yu, L. G. Wang, Y. Han, Q. Y. He, clusterProfiler: an R package for comparing biological themes among gene clusters, OMICS. 16 (2012), 284–287. https://doi.org/10.1089/omi.2011.0118 doi: 10.1089/omi.2011.0118
|
| [33] |
M. Ashburner, C. A. Ball, J. A. Blake, D. Botstein, H. Butler, J. M. Cherry, et al., Gene ontology: Tool for the unification of biology. The Gene Ontology Consortium, Nat. Genet., 25 (2000), 25–29. https://doi.org/10.1038/75556 doi: 10.1038/75556
|
| [34] |
M. Kanehisa, S. Goto, KEGG: kyoto encyclopedia of genes and genomes, Nucleic Acids Res., 28 (2000), 27-30. https://doi.org/10.1093/nar/28.1.27 doi: 10.1093/nar/28.1.27
|
| [35] |
Y. Ru, K. J. Kechris, B. Tabakoff, P. Hoffman, R. A. Radcliffe, R. Bowler, et al., The multiMiR R package and database: integration of microRNA-target interactions along with their disease and drug associations, Nucleic Acids Res., 42 (2014), e133. https://doi.org/10.1093/nar/gku631 doi: 10.1093/nar/gku631
|
| [36] |
S. K. Burley, H. M. Berman, G. J. Kleywegt, J. L. Markley, H. Nakamura, S. Velankar, Protein Data Bank (PDB): The Single Global Macromolecular Structure Archive, Methods Mol. Biol., 1607 (2017), 627–641. https://doi.org/10.1007/978-1-4939-7000-1_26 doi: 10.1007/978-1-4939-7000-1_26
|
| [37] | Schrödinger, LLC The PyMOL Molecular Graphics System (Version 2.0). |
| [38] |
D. Santos-Martins, L. Solis-Vasquez, A. F. Tillack, M. F. Sanner, A. Koch, S. Forli, Accelerating AutoDock4 with GPUs and Gradient-Based Local Search, J. Chem. Theory Comput., 17 (2021), 1060–1073. https://doi.org/10.1021/acs.jctc.0c01006 doi: 10.1021/acs.jctc.0c01006
|
| [39] | M. F. Sanner, Python: a programming language for software integration and development, J. Mol. Graph. Model., 17 (1999), 57–61. |
| [40] |
J. Gao, B. A. Aksoy, U. Dogrusoz, G. Dresdner, B. Gross, S. O. Sumer, et al., Integrative analysis of complex cancer genomics and clinical profiles using the cBioPortal, Sci Signal., 6 (2013), pl1. https://doi.org/10.1126/scisignal.2004088 doi: 10.1126/scisignal.2004088
|
| [41] |
F. Pontén, K. Jirström, M. Uhlen, The Human Protein Atlas--a tool for pathology, J. Pathol., 216 (2008), 387–393. https://doi.org/10.1002/path.2440 doi: 10.1002/path.2440
|
| [42] |
N. E. Butler Tjaden, P. A. Trainor, The developmental etiology and pathogenesis of Hirschsprung disease, Transl. Res., 162 (2013), 1–15. https://doi.org/10.1016/j.trsl.2013.03.001 doi: 10.1016/j.trsl.2013.03.001
|
| [43] |
A. Torroglosa, L. Villalba-Benito, B. Luzón-Toro, R. M. Fernández, G. Antiñolo, S. Borrego, Epigenetic Mechanisms in Hirschsprung Disease, Int. J. Mol. Sci., 20 (2019). https://doi.org/10.3390/ijms20133123 doi: 10.3390/ijms20133123
|
| [44] |
L. Pinzi, G. Rastelli, Molecular Docking: Shifting Paradigms in Drug Discovery, Int. J. Mol. Sci., 20 (2019). https://doi.org/10.3390/ijms20184331 doi: 10.3390/ijms20184331
|
| [45] |
N. Lolak, S. Akocak, S. Bua, R. K. K. Sanku, C. T. Supuran, Discovery of new ureido benzenesulfonamides incorporating 1, 3, 5-triazine moieties as carbonic anhydrase Ⅰ, Ⅱ, Ⅸ and Ⅻ inhibitors, Bioorg. Med. Chem., 27 (2019), 1588–1594. https://doi.org/10.1016/j.bmc.2019.03.001 doi: 10.1016/j.bmc.2019.03.001
|
| [46] |
C. T. Supuran, Carbonic anhydrases: Novel therapeutic applications for inhibitors and activators, Nat. Rev. Drug Discov., 7 (2008), 168–181. https://doi.org/10.1038/nrd2467 doi: 10.1038/nrd2467
|
| [47] |
K. N. Mohan, DNMT1: Catalytic and non-catalytic roles in different biological processes, Epigenomics. 14 (2022), 629–643. https://doi.org/10.2217/epi-2022-0035 doi: 10.2217/epi-2022-0035
|
| [48] |
K. K. Wong, DNMT1 as a therapeutic target in pancreatic cancer: mechanisms and clinical implications, Cell. Oncol. (Dordr.). 43 (2020), 779–792. https://doi.org/10.1007/s13402-020-00526-4 doi: 10.1007/s13402-020-00526-4
|
| [49] |
K. K. Wong, DNMT1: A key drug target in triple-negative breast cancer, Semin. Cancer Biol., 72 (2021), 198–213. https://doi.org/10.1016/j.semcancer.2020.05.010 doi: 10.1016/j.semcancer.2020.05.010
|
| [50] |
S. C. Yang, W. Y. Wang, J. J. Zhou, L. Wu, M. J. Zhang, Q. C. Yang, et al., Inhibition of DNMT1 potentiates antitumor immunity in oral squamous cell carcinoma, Int. Immunopharmacol., 111 (2022), 109113. https://doi.org/10.1016/j.intimp.2022.109113 doi: 10.1016/j.intimp.2022.109113
|
| [51] |
E. N. Elliott, K. L. Sheaffer, J. Schug, T. S. Stappenbeck, K. H. Kaestner, Dnmt1 is essential to maintain progenitors in the perinatal intestinal epithelium, Development. 142 (2015), 2163–2172. https://doi.org/10.1242/dev.117341 doi: 10.1242/dev.117341
|
| [52] |
L. Li, X. Li, X. Wang, W. Liu, R. Wu, Aberrant expression of LINC00346 regulates cell migration and proliferation via competitively binding to miRNA-148a-3p/Dnmt1 in Hirschsprung's disease, Pediatr. Surg. Int., 38 (2022), 1273–1281. https://doi.org/10.1007/s00383-022-05144-9 doi: 10.1007/s00383-022-05144-9
|
| [53] |
A. Alkelai, L. Greenbaum, E. L. Heinzen, E. H. Baugh, A. Teitelbaum, X. Zhu, et al., New insights into tardive dyskinesia genetics: Implementation of whole-exome sequencing approach, Prog. Neuropsychopharmacol. Biol. Psychiatry. 94 (2019), 109659. https://doi.org/10.1016/j.pnpbp.2019.109659 doi: 10.1016/j.pnpbp.2019.109659
|
| [54] |
G. Liu, J. Peng, Z. Liao, J. J. Locascio, J. C. Corvol, F. Zhu, et al., Genome-wide survival study identifies a novel synaptic locus and polygenic score for cognitive progression in Parkinson's disease, Nat. Genet., 53 (2021), 787–793. https://doi.org/10.1038/s41588-021-00847-6 doi: 10.1038/s41588-021-00847-6
|
| [55] |
Y. J. Choi, C. Laclef, N. Yang, A. Andreu-Cervera, J. Lewis, X. Mao, et al., RPGRIP1L is required for stabilizing epidermal keratinocyte adhesion through regulating desmoglein endocytosis, PLoS Genet., 15 (2019), e1007914. https://doi.org/10.1371/journal.pgen.1007914 doi: 10.1371/journal.pgen.1007914
|
| [56] |
L. Wang, A. J. De Solis, Y. Goffer, K. E. Birkenbach, S. E. Engle, R. Tanis, et al., Ciliary gene RPGRIP1L is required for hypothalamic arcuate neuron development, JCI Insight., 4 (2019), https://doi.org/10.1172/jci.insight.123337 doi: 10.1172/jci.insight.123337
|
| [57] |
C. L. Scott, W. T'Jonck, L. Martens, H. Todorov, D. Sichien, B. Soen, et al., The Transcription Factor ZEB2 Is Required to Maintain the Tissue-Specific Identities of Macrophages, Immunity, 49 (2018), 312–325.e315. https://doi.org/10.1016/j.immuni.2018.07.004 doi: 10.1016/j.immuni.2018.07.004
|
| [58] |
B. De Craene, G. Berx, Regulatory networks defining EMT during cancer initiation and progression, Nat. Rev. Cancer. 13 (2013), 97–110. https://doi.org/10.1038/nrc3447 doi: 10.1038/nrc3447
|
| [59] |
L. Garavelli, P. C. Mainardi, Mowat-Wilson syndrome, Orphanet J. Rare Dis., 2 (2007), 42. https://doi.org/10.1186/1750-1172-2-42 doi: 10.1186/1750-1172-2-42
|
| [60] |
F. Gan, X. Zhou, Y. Zhou, L. Hou, X. Chen, C. Pan, et al., Nephrotoxicity instead of immunotoxicity of OTA is induced through DNMT1-dependent activation of JAK2/STAT3 signaling pathway by targeting SOCS3, Arch. Toxicol., 93 (2019), 1067–1082. https://doi.org/10.1007/s00204-019-02434-5 doi: 10.1007/s00204-019-02434-5
|
| [61] |
X. Kong, Z. Gong, L. Zhang, X. Sun, Z. Ou, B. Xu, et al., JAK2/STAT3 signaling mediates IL-6-inhibited neurogenesis of neural stem cells through DNA demethylation/methylation, Brain. Behav. Immun., 79 (2019), 159–173. https://doi.org/10.1016/j.bbi.2019.01.027 doi: 10.1016/j.bbi.2019.01.027
|
| [62] |
É. Boros, M. Csatári, C. Varga, B. Bálint, I. Nagy, Specific Gene- and MicroRNA-Expression Pattern Contributes to the Epithelial to Mesenchymal Transition in a Rat Model of Experimental Colitis, Mediat. Inflamm., 2017 (2017), 5257378. https://doi.org/10.1155/2017/5257378 doi: 10.1155/2017/5257378
|
| [63] |
A. Struchtrup, A. Wiegering, B. Stork, U. Rüther, C. Gerhardt, The ciliary protein RPGRIP1L governs autophagy independently of its proteasome-regulating function at the ciliary base in mouse embryonic fibroblasts, Autophagy, 14 (2018), 567–583. https://doi.org/10.1080/15548627.2018.1429874 doi: 10.1080/15548627.2018.1429874
|
| [64] |
J. Liu, X. Hu, L. Feng, Y. Lin, S. Liang, Z. Zhu, et al., Carbonic anhydrase Ⅸ-targeted H-APBC nanosystem combined with phototherapy facilitates the efficacy of PI3K/mTOR inhibitor and resists HIF-1α-dependent tumor hypoxia adaptation, J Nanobiotechnol., 20 (2022), 187. https://doi.org/10.1186/s12951-022-01394-w doi: 10.1186/s12951-022-01394-w
|


Figures(6) / Tables(2)

Enyang He, Yuhang Jiang, Diwei Wei, Yifan Wang, Wenjing Sun, Miao Jia, Bowen Shi, Hualei Cui. The potential effects and mechanism of echinacoside powder in the treatment of Hirschsprung's Disease[J]. Mathematical Biosciences and Engineering, 2023, 20(8): 14222-14240. doi: 10.3934/mbe.2023636


 DownLoad: