Type 2 diabetes mellitus (T2DM) is a prevalent chronic disease in the United States and healthcare resources used to manage the disease are disproportionately consumed by a small subset of users. Consequently, there is a potential to reduce the healthcare costs and to improve the health outcomes through the early detection and consistent management of high-cost users.
The objectives of this study were to characterize the pattern of medical utilization and cost of commercially-insured people with type 2 diabetes (T2DM) in Texas and to identify predictors of high-cost users.
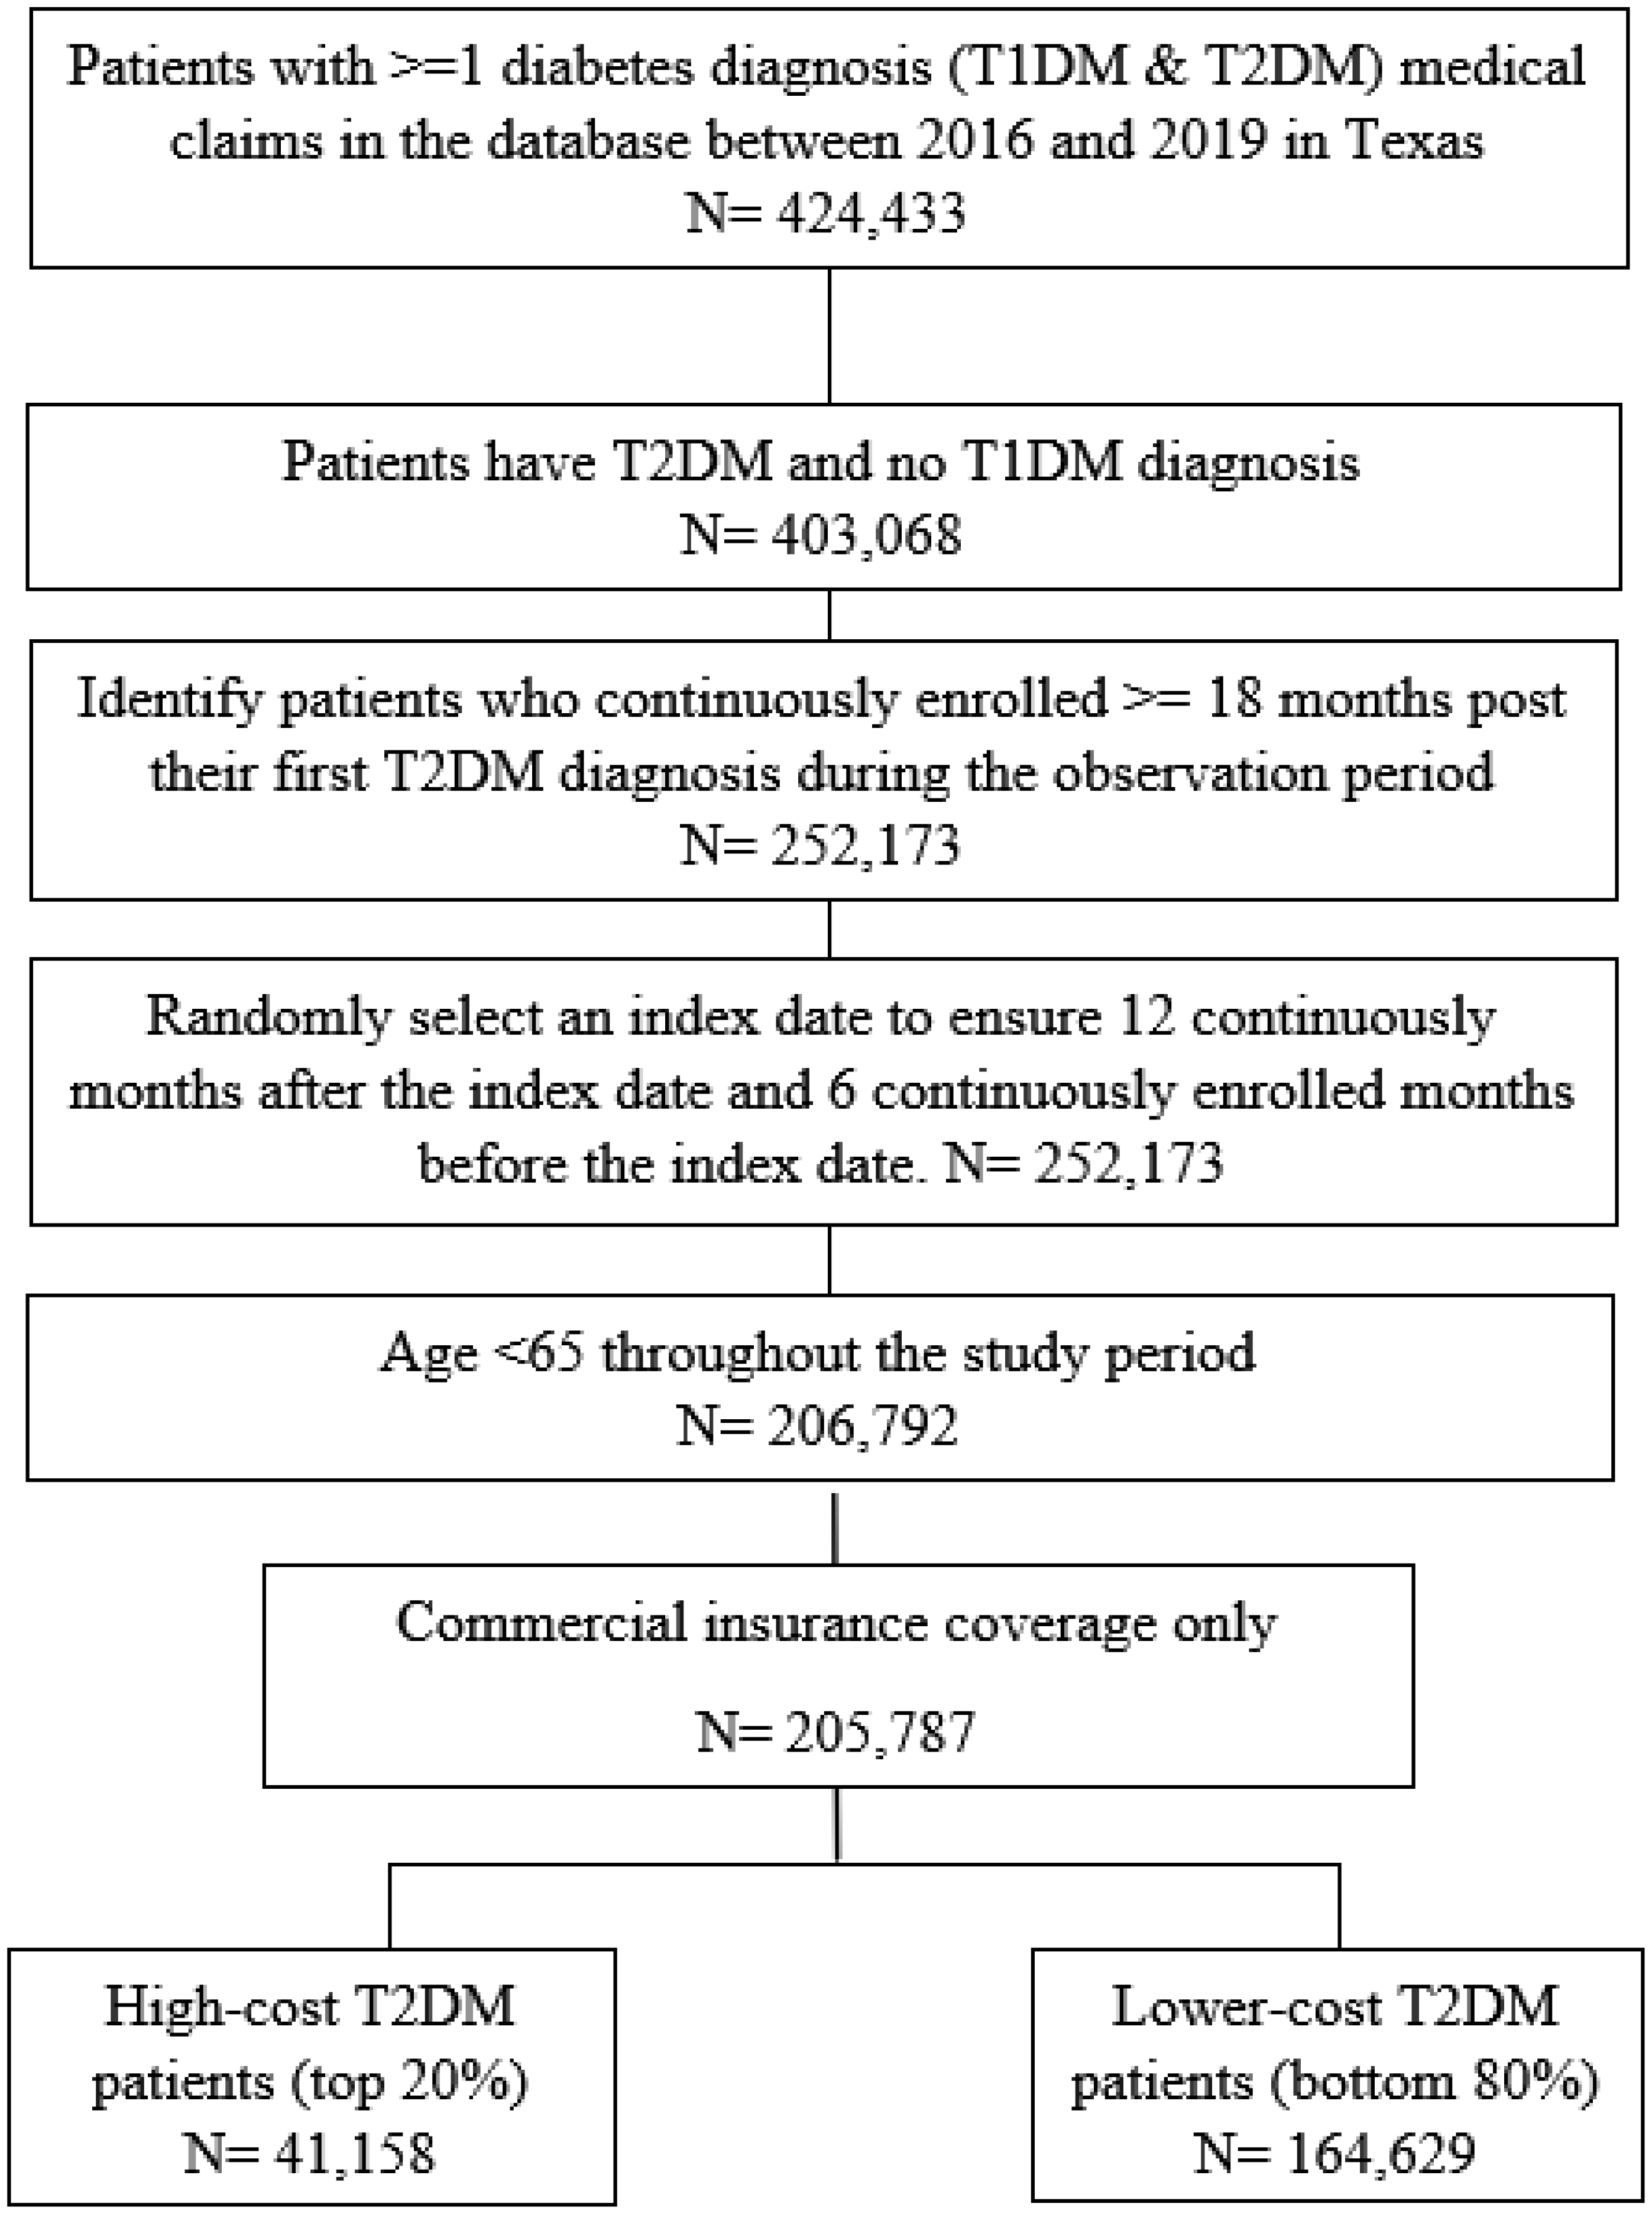
Using claims data from a large commercial insurance plan spanning the period from 2016 to 2019, the total medical costs of a randomly selected 12-month period were analyzed for eligible commercially-insured people with T2DM, and the patients were categorized into the top 20% of high-cost users and the bottom 80% of lower-cost users. Descriptive analyses were conducted to describe the baseline characteristics of the people with T2DM, the patterns of healthcare utilization, and the costs of the two types of users. Multivariate logistic regression models were estimated to identify the predictors of being a high-cost T2DM user.
The top 20% of high-cost users accounted for 83% of the total medical cost, with an average cost of $41,370 as compared to only $2064 for the bottom 80% of lower-cost users. Several chronic conditions were identified to be strong predictors of being a high-cost patient. Rural high-cost users had, on average, fewer specialist visits but more inpatient stays compared to the urban high-cost users.
Healthcare utilization and expenditures among commercially insured individuals with T2DM followed the 80–20 rule. High-cost users were strongly associated with worse health status. Residential rurality was not associated with high-cost use, though the patterns of resource utilization differed between urban and rural high-cost users.
Citation: Lixian Zhong, Yidan Huyan, Elena Andreyeva, Matthew Lee Smith, Gang Han, Keri Carpenter, Samuel D Towne, Sagar N Jani, Veronica Averhart Preston, Marcia G. Ory. Predicting high-cost, commercially-insured people with diabetes in Texas: Characteristics, medical utilization patterns, and urban-rural comparisons[J]. AIMS Public Health, 2025, 12(1): 259-274. doi: 10.3934/publichealth.2025016
Type 2 diabetes mellitus (T2DM) is a prevalent chronic disease in the United States and healthcare resources used to manage the disease are disproportionately consumed by a small subset of users. Consequently, there is a potential to reduce the healthcare costs and to improve the health outcomes through the early detection and consistent management of high-cost users.
The objectives of this study were to characterize the pattern of medical utilization and cost of commercially-insured people with type 2 diabetes (T2DM) in Texas and to identify predictors of high-cost users.
Using claims data from a large commercial insurance plan spanning the period from 2016 to 2019, the total medical costs of a randomly selected 12-month period were analyzed for eligible commercially-insured people with T2DM, and the patients were categorized into the top 20% of high-cost users and the bottom 80% of lower-cost users. Descriptive analyses were conducted to describe the baseline characteristics of the people with T2DM, the patterns of healthcare utilization, and the costs of the two types of users. Multivariate logistic regression models were estimated to identify the predictors of being a high-cost T2DM user.
The top 20% of high-cost users accounted for 83% of the total medical cost, with an average cost of $41,370 as compared to only $2064 for the bottom 80% of lower-cost users. Several chronic conditions were identified to be strong predictors of being a high-cost patient. Rural high-cost users had, on average, fewer specialist visits but more inpatient stays compared to the urban high-cost users.
Healthcare utilization and expenditures among commercially insured individuals with T2DM followed the 80–20 rule. High-cost users were strongly associated with worse health status. Residential rurality was not associated with high-cost use, though the patterns of resource utilization differed between urban and rural high-cost users.

| [1] | Hernandez-Viver A, Mitchell EM (2021) Concentration of Healthcare Expenditures and Selected Characteristics of Persons With High Expenses, United States Civilian Noninstitutionalized Population, 2018–2021. Statistical Brief #556. March 2024. Rockville, MD: Agency for Healthcare Research and Quality. Available from: https://meps.ahrq.gov/data_files/publications/st556/stat556.shtml |
| [2] | Musich S, Wang S, Hawkins K, et al. (2016) The Impact of Personalized Preventive Care on Health Care Quality, Utilization, and Expenditures. Popul Health Manag 19: 389-397. https://doi.org/10.1089/pop.2015.0171 |
| [3] | Parker ED, Lin J, Mahoney T, et al. (2023) Economic Costs of Diabetes in the U.S. in 2022. Diabetes Care 47: 26-43. https://doi.org/10.2337/dci23-0085 |
| [4] | NIHCM FoundationU.S. Health Care Spending: The Big Picture. [cited 2021 Nov 5th] (2012). Available from: https://nihcm.org/assets/articles/databrief1-bigpicturefinal.pdf |
| [5] | Meyers JL, Parasuraman S, Bell KF, et al. (2014) The high-cost, type 2 diabetes mellitus patient: an analysis of managed care administrative data. Arch Public Health 72: 6. https://doi.org/10.1186/2049-3258-72-6 |
| [6] | Guerrero-Fernández de Alba I, Orlando V, Monetti VM, et al. (2020) Comorbidity in an Older Population with Type-2 Diabetes Mellitus: Identification of the Characteristics and Healthcare Utilization of High-Cost Patients. Front Pharmacol 11: 586187. https://doi.org/10.3389/fphar.2020.586187 |
| [7] | State of Childhood ObesityDiabetes Rate by State, 2020. [cited 2021 Oct 23rd] (2020). Available from: https://stateofchildhoodobesity.org/diabetes/ |
| [8] | American Diabetes AssociationThe Burden of Diabetes in Texas. [cited 2021 Oct 22nd] (2020). Available from: http://main.diabetes.org/dorg/docs/state-fact-sheets/ADV_2020_State_Fact_sheets_TX.pdf |
| [9] | Ingram DD, Franco SJ (2014) 2013 NCHS Urban-Rural Classification Scheme for Counties. Vital Health Stat 2: 1-73. |
| [10] | Agency for Healthcare Research and Quality (AHRQ)Prevention Quality Indicators Technical Specifications. [cited 2021 Nov 15th] (2020). Available from: https://qualityindicators.ahrq.gov/Archive/PQI_TechSpec_ICD10_v2020.aspx |
| [11] | Cheng YJ, Kanaya AM, Araneta MRG, et al. (2019) Prevalence of Diabetes by Race and Ethnicity in the United States, 2011–2016. JAMA 322: 2389-2398. https://doi.org/10.1001/jama.2019.19365 |
| [12] | Morales J, Glantz N, Larez A, et al. (2020) Understanding the impact of five major determinants of health (genetics, biology, behavior, psychology, society/environment) on type 2 diabetes in U.S. Hispanic/Latino families: Mil Familias - a cohort study. BMC Endocr Disord 20: 4. https://doi.org/10.1186/s12902-019-0483-z |
| [13] | Hales CM, Carroll MD, Fryar CD, et al. (2017) Prevalence of Obesity Among Adults and Youth: United States, 2015–2016. NCHS Data Brief 288: 1-8. Available from: https://www.cdc.gov/nchs/products/databriefs/db288.htm |
| [14] | Deloitte, “The 80/20 Rule” Is it still true? And what can it tell us about Population Health in 2018 and beyond? [cited 2024 April 15th]. Available from: https://www2.deloitte.com/us/en/pages/life-sciences-and-health-care/articles/is-80-20-rule-of-health-care-still-true-population-value-based.html |
| [15] | Doran CM (2008) Economic evaluation of interventions to treat opiate dependence: a review of the evidence. Pharmacoeconomics 26: 371-393. https://doi.org/10.2165/00019053-200826050-00003 |
| [16] | Zhou X, Siegel KR, Ng BP, et al. (2020) Cost-effectiveness of Diabetes Prevention Interventions Targeting High-risk Individuals and Whole Populations: A Systematic Review. Diabetes Care 43: 1593-1616. https://doi.org/10.2337/dci20-0018 |
| [17] | Dineen-Griffin S, Garcia-Cardenas V, Williams K, et al. (2019) Helping patients help themselves: A systematic review of self-management support strategies in primary health care practice. PLoS One 14: e0220116. https://doi.org/10.1371/journal.pone.0220116 |
| [18] | Foote SM (2003) Population-Based Disease Management Under Fee-For-Service Medicare: Pilot projects could act as a catalyst for improving the health of chronically ill beneficiaries cost-effectively over time. Health Aff 22: W3-342–356. https://doi.org/10.1377/hlthaff.w3.342 |
| [19] | Garabedian LF, Ross-Degnan D, Wharam JF (2019) Provider Perspectives on Quality Payment Programs Targeting Diabetes in Primary Care Settings. Popul Health Manag 22: 248-254. https://doi.org/10.1089/pop.2018.0093 |
| [20] | Weber MB, Narayan KMV (2019) Health Insurance for Diabetes Prevention Confers Health Benefits and Breaks Even on Cost Within 2 Years. Diabetes Care 42: 1612-1614. https://doi.org/10.2337/dci19-0022 |
| [21] | Meyers DJ, Durfey SNM, Gadbois EA, et al. (2019) Early Adoption of New Supplemental Benefits by Medicare Advantage Plans. JAMA 321: 2238-2240. https://doi.org/10.1001/jama.2019.4709 |
| [22] | American Diabetes Association.Economic Costs of Diabetes in the U.S. in 2017. Diabetes Care (2017) 41: 917-928. https://doi.org/10.2337/dci18-0007 |
| [23] | Hamman RF, Wing RR, Edelstein SL, et al. (2006) Effect of weight loss with lifestyle intervention on risk of diabetes. Diabetes Care 29: 2102-2107. https://doi.org/10.2337/dc06-0560 |
| [24] | Schulze MB, Hu FB (2005) Primary prevention of diabetes: what can be done and how much can be prevented?. Annu Rev Public Health 26: 445-467. https://doi.org/10.1146/annurev.publhealth.26.021304.144532 |
| [25] | Johnston KJ, Wen H, Joynt Maddox KE (2019) Lack Of Access To Specialists Associated With Mortality And Preventable Hospitalizations Of Rural Medicare Beneficiaries. Health Aff (Millwood) 38: 1993-2002. https://doi.org/10.1377/hlthaff.2019.00838 |
| [26] | McLendon SF (2017) Interactive Video Telehealth Models to Improve Access to Diabetes Specialty Care and Education in the Rural Setting: A Systematic Review. Diabetes Spectr 30: 124-136. https://doi.org/10.2337/ds16-0004 |
 publichealth-12-01-016-s001.pdf publichealth-12-01-016-s001.pdf |
 |
Figures(1) / Tables(4)

Lixian Zhong, Yidan Huyan, Elena Andreyeva, Matthew Lee Smith, Gang Han, Keri Carpenter, Samuel D Towne, Sagar N Jani, Veronica Averhart Preston, Marcia G. Ory. Predicting high-cost, commercially-insured people with diabetes in Texas: Characteristics, medical utilization patterns, and urban-rural comparisons[J]. AIMS Public Health, 2025, 12(1): 259-274. doi: 10.3934/publichealth.2025016


 DownLoad: