The ECHO (Extensions Community Healthcare Outcomes) model of healthcare delivery has grown rapidly since its establishment and increased in popularity in recent years. This expansion has developed alongside the growing incidence of chronic diseases and the need to better manage them. The increasing uptake in ECHO has presented a requirement to assess its true value as healthcare costs are increasing globally, resulting in a growing demand by governments and policy makers to ensure chronic disease management strategies provide true value. Therefore, the aim of this review is to examine the impact that ECHO has on clinical practice and how such impacts are measured or evaluated. A narrative literature review is carried out to examine the outcomes assessed in ECHO-related studies. Three key academic databases were utilised for the literature search: Web of Science, PubMed, and Medline. Keywords relating to the review were chosen and searched for. Papers were screened using specified inclusion and exclusion criteria relating to years of publication (2000–2020), type of publication (original research, review papers and meta-analyses) and language requirements (English language only). This review found that while the ECHO model is expanding, and improving the so-called “knowledge gap” between specialists and primary care physicians, there is also a gap in the ways value is examined within ECHO. Most studies on ECHO lack an examination of patient reported health outcomes and appropriate, comparative costing methods. Current ECHO-related studies lack vital components that demonstrate the value of the model. Such components include patient reported health outcomes and detailed costing comparisons between the ECHO model and the traditional care pathway it is replacing.
Citation: Christina Kenny, Anushree Priyadarshini. “Mind the Gap” - An overview of the role of the Extensions Community Healthcare Outcomes (ECHO) model in enhancing value in health care delivery[J]. AIMS Public Health, 2023, 10(1): 94-104. doi: 10.3934/publichealth.2023008
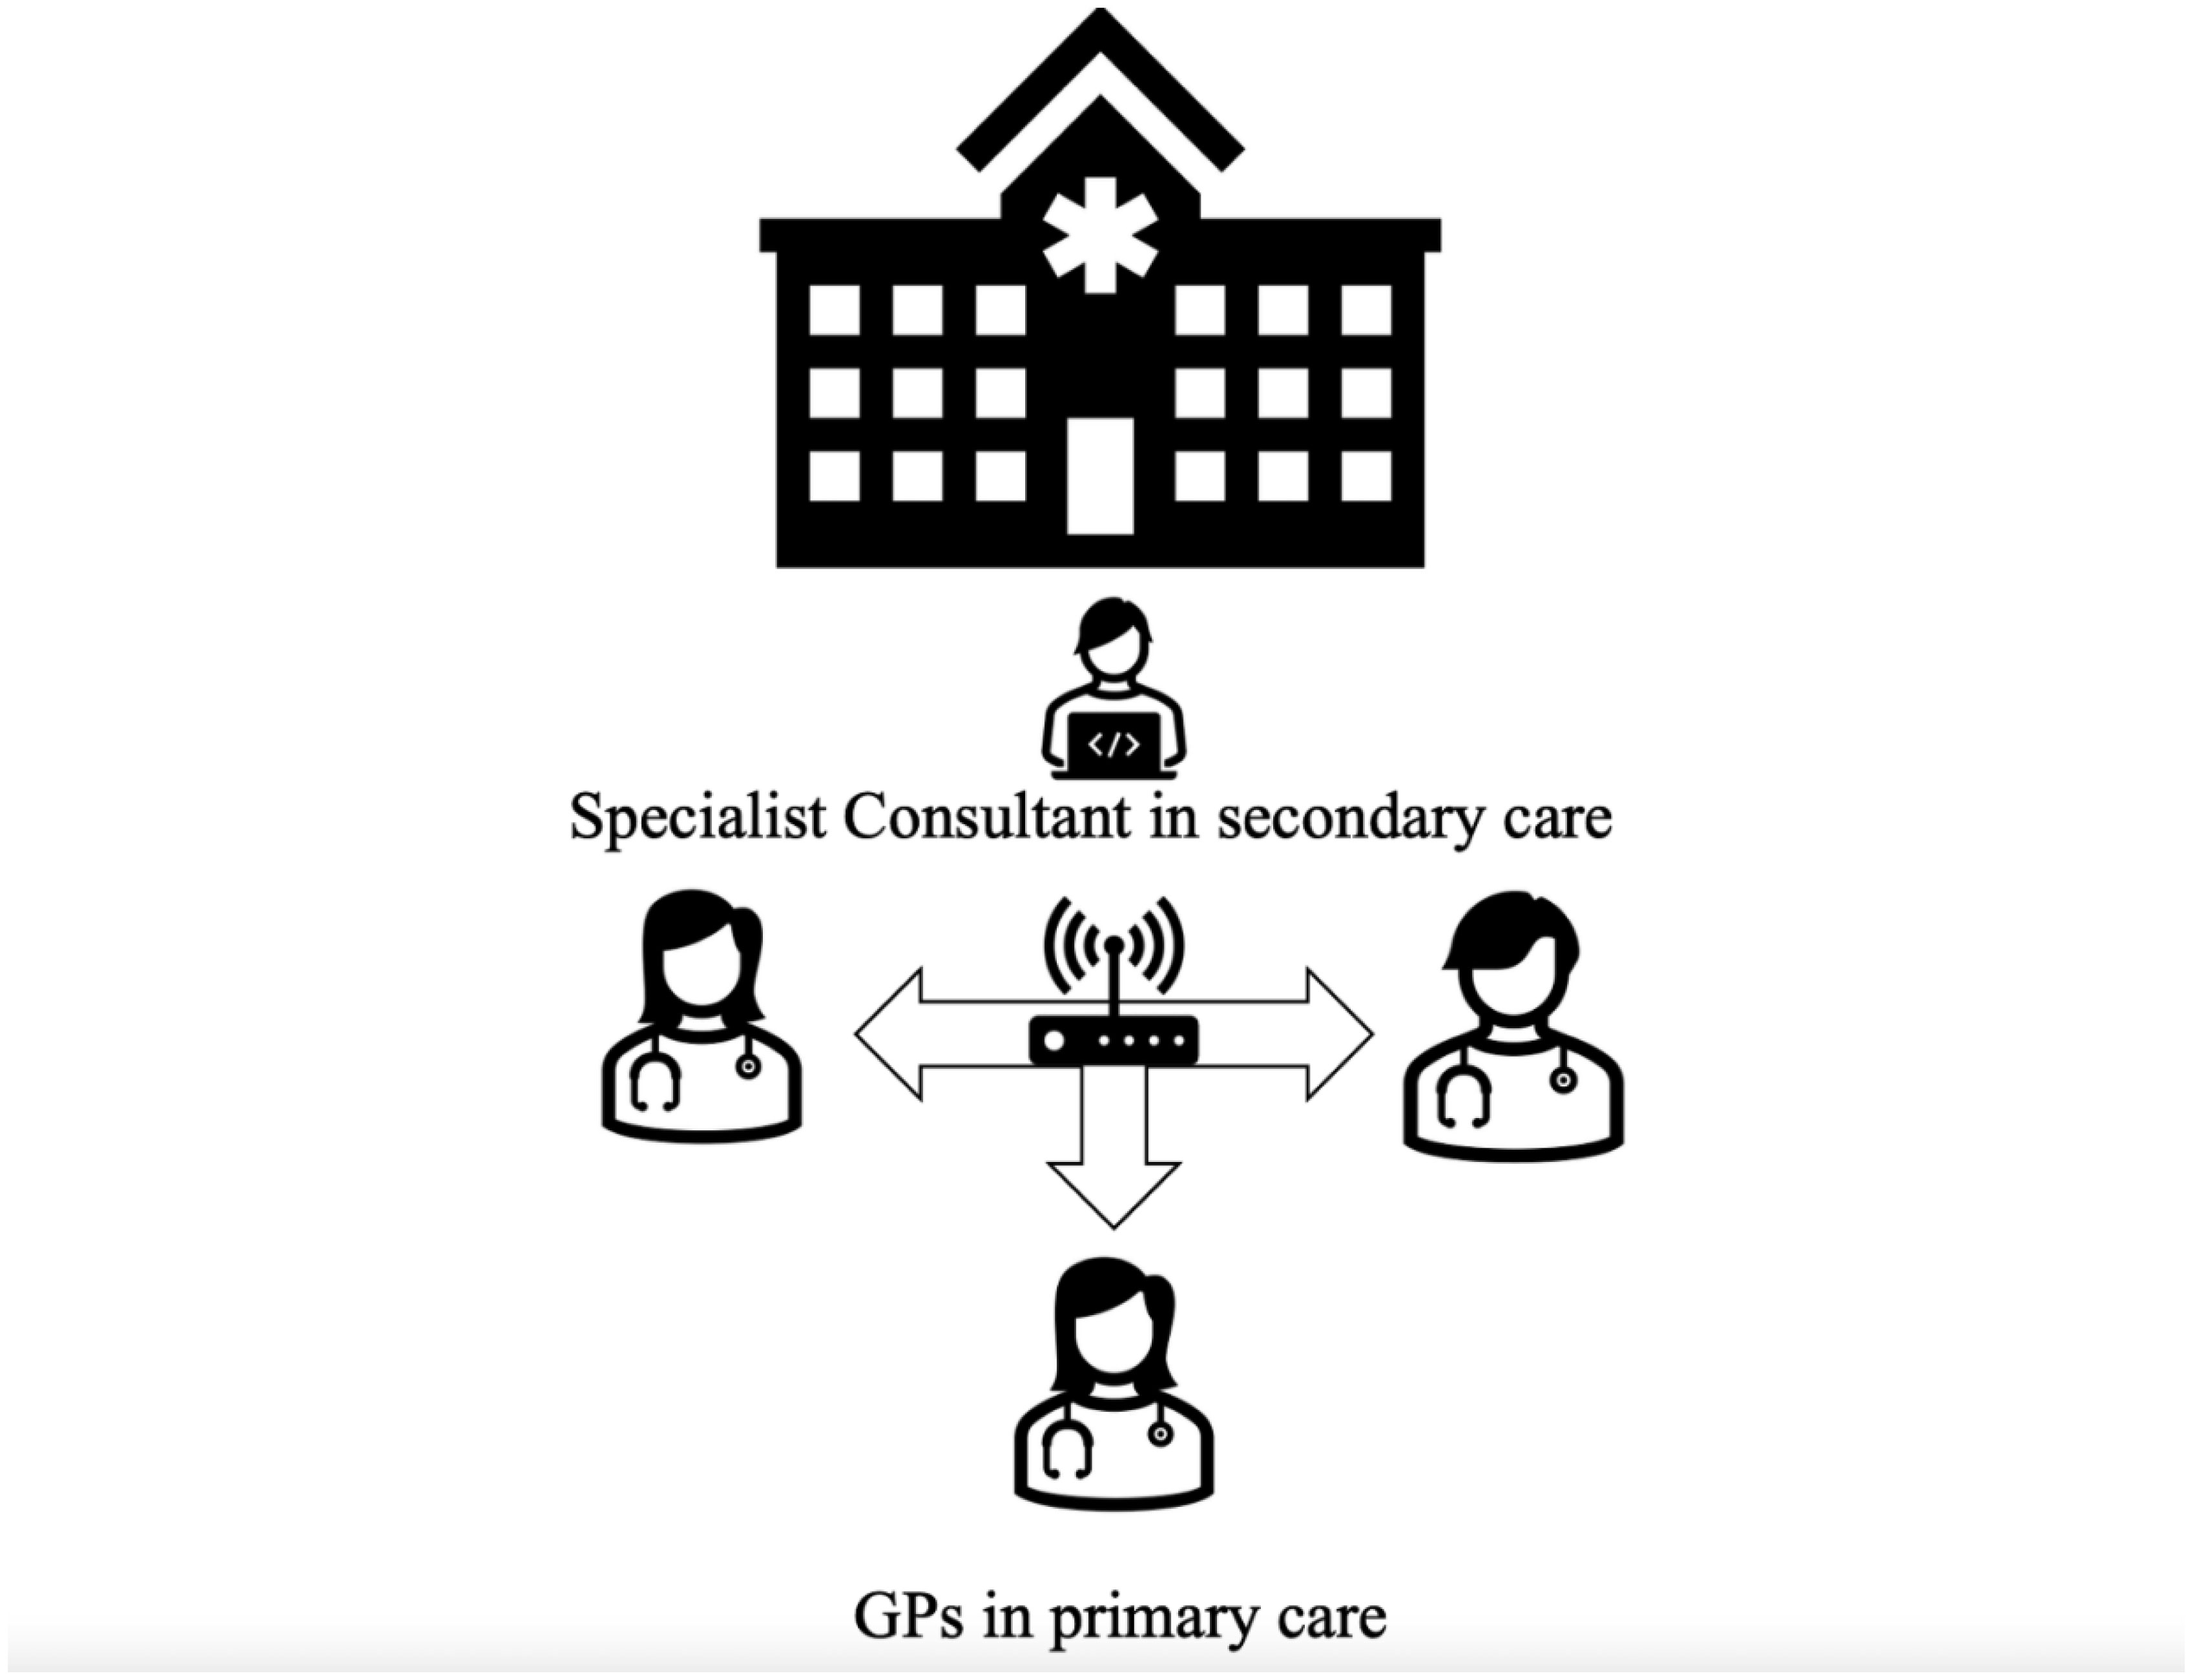
The ECHO (Extensions Community Healthcare Outcomes) model of healthcare delivery has grown rapidly since its establishment and increased in popularity in recent years. This expansion has developed alongside the growing incidence of chronic diseases and the need to better manage them. The increasing uptake in ECHO has presented a requirement to assess its true value as healthcare costs are increasing globally, resulting in a growing demand by governments and policy makers to ensure chronic disease management strategies provide true value. Therefore, the aim of this review is to examine the impact that ECHO has on clinical practice and how such impacts are measured or evaluated. A narrative literature review is carried out to examine the outcomes assessed in ECHO-related studies. Three key academic databases were utilised for the literature search: Web of Science, PubMed, and Medline. Keywords relating to the review were chosen and searched for. Papers were screened using specified inclusion and exclusion criteria relating to years of publication (2000–2020), type of publication (original research, review papers and meta-analyses) and language requirements (English language only). This review found that while the ECHO model is expanding, and improving the so-called “knowledge gap” between specialists and primary care physicians, there is also a gap in the ways value is examined within ECHO. Most studies on ECHO lack an examination of patient reported health outcomes and appropriate, comparative costing methods. Current ECHO-related studies lack vital components that demonstrate the value of the model. Such components include patient reported health outcomes and detailed costing comparisons between the ECHO model and the traditional care pathway it is replacing.

| [1] | World Health OrganisationNoncommunicable diseases (2021). Available from: https://www.who.int/news-room/fact-sheets/detail/noncommunicable-diseases. |
| [2] | Bardhan I, Chen H, Karahanna E (2020) Connecting systems, data, and people: A multidisciplinary research roadmap for chronic disease management. MIS Quart 44: 185-200. https://doi.org/10.25300/MISQ/2020/14644 |
| [3] |
Nicholson K, Makovski TT, Griffith LE, et al. (2019) Multimorbidity and comorbidity revisited: refining the concepts for international health research. J Clin Epidemiol 105: 142-146. https://doi.org/10.1016/j.jclinepi.2018.09.008 
|
| [4] |
Violan C, Foguet-Boreu Q, Flores-Mateo G, et al. (2014) Prevalence, determinants, and patterns of multimorbidity in primary care: A systematic review of observational studies. PLoS One 9: e102149. https://doi.org/10.1371/journal.pone.0102149
|
| [5] | World Health OrganizationGlobal status report on noncommunicable diseases 2010 (2010). Available from: https://apps.who.int/iris/handle/10665/44579. |
| [6] |
McMahon LF, Chopra V (2012) Health care cost and value: the way forward. JAMA 307: 671-672. https://doi.org/10.1001/jama.2012.136
|
| [7] |
McPhail SM (2016) Multimorbidity in chronic disease: impact on health care resources and costs. Risk Manag Healthc Policy 9: 143-156. https://doi.org/10.2147/RMHP.S97248
|
| [8] | Rapoport J, Jacobs P, Bell NR, et al. (2004) Refining the measurement of the economic burden of chronic diseases in Canada. Age 20: 1-643. |
| [9] | Bloom DE, Cafiero E, Jané-Llopis E, et al. The global economic burden of noncommunicable diseases (2012). Available from: https://ideas.repec.org/p/gdm/wpaper/8712.html. |
| [10] |
Starfield B, Shi L, Macinko J (2005) The Milbank quarterly. Milbank Q 83: 457-502. https://doi.org/10.1111/j.1468-0009.2005.00409.x
|
| [11] |
Moscovice I, Rosenblatt R (2000) Quality-of-care challenges for rural health. J Rural Health 16: 168-176. https://doi.org/10.1111/j.1748-0361.2000.tb00451.x
|
| [12] |
Rosenblatt RA (2004) A view from the periphery—health care in rural America. N Engl J Med 351: 1049-1051. https://doi.org/10.1056/NEJMp048073
|
| [13] |
Arora S, Geppert CM, Kalishman S, et al. (2007) Academic health center management of chronic diseases through knowledge networks: Project ECHO. Acad Med 82: 154-160. https://doi.org/10.1097/ACM.0b013e31802d8f68
|
| [14] | Centers for Disease Control and PreventionKnow More Hepatitis (2021). Available from: https://www.cdc.gov/knowmorehepatitis/index.htm. |
| [15] |
Arora S, Thornton K, Murata G, et al. (2011) Outcomes of treatment for hepatitis C virus infection by primary care providers. N Engl J Med 364: 2199-2207. https://doi.org/10.1056/NEJMoa1009370
|
| [16] |
Harkins M, Raissy H, Moseley K, et al. (2011) Project ECHO: improving asthma care in New Mexico with telehealth technology. Chest 140: 861A. https://doi.org/10.1378/chest.1107313
|
| [17] |
Lewiecki EM, Rochelle R (2019) Project ECHO: telehealth to expand capacity to deliver best practice medical care. Rheum Dis Clin North Am 45: 303-314. https://doi.org/10.1016/j.rdc.2019.01.003
|
| [18] | Sciences NH Project ECHO: Data on our work (2022). Available from: https://hsc.unm.edu/echo/partner-portal/data-marketplace/. |
| [19] |
Bennett MI, Kaasa S, Barke A, et al. (2019) The IASP classification of chronic pain for ICD-11: chronic cancer-related pain. Pain 160: 38-44. https://doi.org/10.1097/j.pain.0000000000001363
|
| [20] |
Furlan AD, Pajer KA, Gardner W, et al. (2019) Project ECHO: building capacity to manage complex conditions in rural, remote, and underserved areas. Can J Rural Med 24: 115-120. https://doi.org/10.4103/CJRM.CJRM_20_18
|
| [21] | Dowell D (2022) Draft updated CDC guideline for prescribing opioids: background, overview, and progress. CDC Stacks . |
| [22] |
Hassan S, Carlin L, Zhao J, et al. (2021) Promoting an interprofessional approach to chronic pain management in primary care using Project ECHO. J Interprof Care 35: 464-467. https://doi.org/10.1080/13561820.2020.1733502
|
| [23] |
Chaple MJ, Freese TE, Rutkowski BA, et al. (2018) Using ECHO clinics to promote capacity building in clinical supervision. Am J Prev Med 54: S275-S280. https://doi.org/10.1016/j.amepre.2018.01.015
|
| [24] |
Bikinesi L, O'Bryan G, Roscoe C, et al. (2020) Implementation and evaluation of a Project ECHO telementoring program for the Namibian HIV workforce. Hum Resour Health 18: 61. https://doi.org/10.1186/s12960-020-00503-w
|
| [25] |
Wood BR, Mann MS, Martinez-Paz N, et al. (2018) Project ECHO: telementoring to educate and support prescribing of HIV pre-exposure prophylaxis by community medical providers. Sex health 15: 601-605. https://doi.org/10.1071/SH18062
|
| [26] |
Harris JM, Fulginiti JV, Gordon PR, et al. (2008) KnowPain-50: a tool for assessing physician pain management education. Pain Med 9: 542-554. https://doi.org/10.1111/j.1526-4637.2007.00398.x
|
| [27] |
Rosenman R, Tennekoon V, Hill LG (2011) Measuring bias in self-reported data. Int J Behav Healthc Res 2: 320-332. https://doi.org/10.1504/IJBHR.2011.043414
|
| [28] | Hariprasad R, Arora S, Babu R, et al. (2018) Retention of knowledge levels of health care providers in cancer screening through telementoring. J Glob Oncol 4: 1-7. https://doi.org/10.1200/JGO.18.00048 |
| [29] |
Davis DA, Mazmanian PE, Fordis M, et al. (2006) Accuracy of physician self-assessment compared with observed measures of competence: A systematic review. JAMA 296: 1094-1102. https://doi.org/10.1001/jama.296.9.1094
|
| [30] |
Lalloo C, Osei-Twum JA, Rapoport A, et al. (2021) Pediatric project ECHO®: A virtual Community of Practice to improve palliative care knowledge and self-efficacy among Interprofessional health care providers. J Palliat Med 24: 1036-1044. https://doi.org/10.1089/jpm.2020.0496
|
| [31] | Newcomb D, Moss PW (2018) Empowering General Practitioners to manage children with ADHD using the ECHO® model. Int J Integr Care 2: 18. https://doi.org/10.5334/ijic.s1080 |
| [32] |
Zhou C, Crawford A, Serhal E, et al. (2016) The impact of project ECHO on participant and patient outcomes: A systematic review. Acad Med 91: 1439-1461. https://doi.org/10.1097/ACM.0000000000001328
|
| [33] |
Katzman JG, Qualls CR, Satterfield WA, et al. (2019) Army and navy ECHO pain telementoring improves clinician opioid prescribing for military patients: an observational cohort study. J Gen Intern Med 34: 387-395. https://doi.org/10.1007/s11606-018-4710-5
|
| [34] |
Rattay T, Dumont IP, Heinzow HS, et al. (2017) Cost-effectiveness of access expansion to treatment of hepatitis C virus infection through primary care providers. Gastroenterology 153: 1531-1543.e2. https://doi.org/10.1053/j.gastro.2017.10.016
|
| [35] |
De Witt Jansen B, Brazil K, Passmore P, et al. (2018) Evaluation of the impact of telementoring using ECHO© technology on healthcare professionals' knowledge and self-efficacy in assessing and managing pain for people with advanced dementia nearing the end of life. BMC Health Serv Res 18: 228. https://doi.org/10.1186/s12913-018-3032-y
|
| [36] |
Katzman JG, Galloway K, Olivas C, et al. (2016) Expanding health care access through education: dissemination and implementation of the ECHO model. Mil Med 181: 227-235. https://doi.org/10.7205/MILMED-D-15-00044
|
| [37] |
Xie Y, Lu L, Gao F, et al. (2021) Integration of artificial intelligence, blockchain, and wearable technology for chronic disease management: A new paradigm in smart healthcare. Curr Med Sci 41: 1123-1133. https://doi.org/10.1007/s11596-021-2485-0
|


Figures(3)

Christina Kenny, Anushree Priyadarshini. “Mind the Gap” - An overview of the role of the Extensions Community Healthcare Outcomes (ECHO) model in enhancing value in health care delivery[J]. AIMS Public Health, 2023, 10(1): 94-104. doi: 10.3934/publichealth.2023008


 DownLoad: