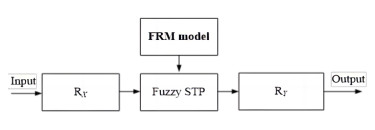
Based on fuzzy semi-tensor product (STP) algorithms and fuzzy relation matrix (FRM) models, the design of an adaptive fuzzy controller was proposed in this paper for the multivariable nonlinear systems with uncertainty. The controlled multi-input-and-multi-output (MIMO) plants were expressed and processed first by FRM models and fuzzy STP operations, and then the indirect adaptive fuzzy control laws were designed. The tracking property of the FRM models was proved for the control objective of MIMO systems. The effectiveness of the novel matrix expression was verified by simulations of the tracking control on a two-link rigid robot manipulator. Results in simulation tests show that the proposed design of adaptive FRM control is efficient for nonlinear multivariables. Therefore, the proposed indirect fuzzy adaptive controllers can be extended to general matrix expression for MIMO nonlinear systems with fuzzy STP algorithms and FRM models and online approximate unknown parameters, according to required accuracy.
Citation: Hongli Lyu, Yanan Lyu, Yongchao Gao, Heng Qian, Shan Du. MIMO fuzzy adaptive control systems based on fuzzy semi-tensor product[J]. Mathematical Modelling and Control, 2023, 3(4): 316-330. doi: 10.3934/mmc.2023026
Based on fuzzy semi-tensor product (STP) algorithms and fuzzy relation matrix (FRM) models, the design of an adaptive fuzzy controller was proposed in this paper for the multivariable nonlinear systems with uncertainty. The controlled multi-input-and-multi-output (MIMO) plants were expressed and processed first by FRM models and fuzzy STP operations, and then the indirect adaptive fuzzy control laws were designed. The tracking property of the FRM models was proved for the control objective of MIMO systems. The effectiveness of the novel matrix expression was verified by simulations of the tracking control on a two-link rigid robot manipulator. Results in simulation tests show that the proposed design of adaptive FRM control is efficient for nonlinear multivariables. Therefore, the proposed indirect fuzzy adaptive controllers can be extended to general matrix expression for MIMO nonlinear systems with fuzzy STP algorithms and FRM models and online approximate unknown parameters, according to required accuracy.

| [1] |
S. Chatterjee, A. Chatterjee, S. S. Das, Analytical performance evaluation of full-dimensional MIMO systems using realistic spatial correlation models, IEEE Trans. Veh. Technol., 67 (2018), 5597–5612. https://doi.org/10.1109/TVT.2018.2801825 doi: 10.1109/TVT.2018.2801825

|
| [2] |
D. Liu, S. Xue, B. Zhao, B. Luo, Q. Wei, Adaptive dynamic programming for control: a survey and recent advances, IEEE Trans. Syst. Man Cybern., 51 (2021), 142–160. https://doi.org/10.1109/TSMC.2020.3042876 doi: 10.1109/TSMC.2020.3042876
|
| [3] |
O. M. Omisore, S. Han, J. Xiong, H. Li, Z. Li, L. Wang, A review on flexible robotic systems for minimally invasive surgery, IEEE Trans. Syst. Man Cybern., 52 (2022), 631–644. https://doi.org/10.1109/TSMC.2020.3026174 doi: 10.1109/TSMC.2020.3026174
|
| [4] |
J. Mao, C. K. Ahn, Z. Xiang, Global stabilization for a class of switched nonlinear time-delay systems via sampled-data output-feedback control, IEEE Trans. Syst. Man Cybern., 52 (2021), 694–705. https://doi.org/10.1109/TSMC.2020.3048064 doi: 10.1109/TSMC.2020.3048064
|
| [5] | A. Isidori, Nonlinear control systems, 3 Eds., Berlin: Springer, 1995. |
| [6] | L. Wang, A course in fuzzy systems and control, USA: Prentice Hall PTR, 1997. |
| [7] |
P. Wan, Z. Zeng, Stability and stabilization of Takagi-Sugeno fuzzy second-fractional-order linear networks via nonreduced-order approach, IEEE Trans. Syst. Man Cybern., 52 (2022), 6524–6533. https://doi.org/10.1109/TSMC.2022.3147222 doi: 10.1109/TSMC.2022.3147222
|
| [8] |
B. Chen, X. Liu, S. S. Ge, C. Lin, Adaptive fuzzy control of a class of nonlinear systems by fuzzy approximation approach, IEEE Trans. Fuzzy Syst., 20 (2012), 1012–1021. https://doi.org/10.1109/TFUZZ.2012.2190048 doi: 10.1109/TFUZZ.2012.2190048
|
| [9] |
L. Liu, Y. J. Liu, D. Li, S. Tong, Z. Wang, Barrier Lyapunov function-based adaptive fuzzy FTC for switched systems and its applications to resistance-inductance-capacitance circuit system, IEEE Trans. Cybern., 50 (2020), 3491–3502. https://doi.org/10.1109/TCYB.2019.2931770 doi: 10.1109/TCYB.2019.2931770
|
| [10] |
Y. Li, K. Li, S. Tong, Finite-time adaptive fuzzy output feedback dynamic surface control for MIMO non-strict feedback systems, IEEE Trans. Fuzzy Syst., 27 (2019), 96–110. https://doi.org/10.1109/TFUZZ.2018.2868898 doi: 10.1109/TFUZZ.2018.2868898
|
| [11] |
L. Liu, W. Zhao, Y. J. Liu, S. Tong, Y. Y. Wang, Adaptive finite-time neural network control of nonlinear systems with multiple objective constraints and application to electromechanical system, IEEE Trans. Neural Networks Learn. Syst., 32 (2021), 5416–5426. https://doi.org/10.1109/TNNLS.2020.3027689 doi: 10.1109/TNNLS.2020.3027689
|
| [12] |
L. Liu, X. Li, Y. J. Liu, S. Tong, Neural network based adaptive event trigger control for a class of electromagnetic suspension systems, Control Eng. Pract., 106 (2021), 104675. https://doi.org/10.1016/j.conengprac.2020.104675 doi: 10.1016/j.conengprac.2020.104675
|
| [13] |
L. X. Wang, Stable adaptive fuzzy controllers with application to inverted pendulum tracking, IEEE Trans. Syst. Man Cybern., 26 (1996), 677–691. https://doi.org/10.1109/3477.537311 doi: 10.1109/3477.537311
|
| [14] |
H. Li, J. Wang, H. Du, H. R. Karimi, Adaptive sliding mode control for Takagi-Sugeno fuzzy systems and its applications, IEEE Trans Fuzzy Syst., 26 (2018), 531–542. https://doi.org/10.1109/TFUZZ.2017.2686357 doi: 10.1109/TFUZZ.2017.2686357
|
| [15] |
Y. H. Liu, Y. Liu, Y. F. Liu, C. Y. Su, Adaptive fuzzy control with global stability guarantees for unknown strict-feedback systems using novel integral barrier Lyapunov functions, IEEE Trans. Syst. Man Cybern., 52 (2022), 4336–4348. https://doi.org/10.1109/TSMC.2021.3094975 doi: 10.1109/TSMC.2021.3094975
|
| [16] |
D. Cheng, J. Feng, H. Lv, Solving fuzzy relational equations via semi-tensor product, IEEE Trans. Fuzzy Syst., 20 (2012), 390–396. https://doi.org/10.1109/TFUZZ.2011.2174243 doi: 10.1109/TFUZZ.2011.2174243
|
| [17] |
J. Feng, H. Lv, D. Cheng, Multiple fuzzy relation and its application to coupled fuzzy control, Asian J. Control, 15 (2013), 1313–1324. https://doi.org/10.1002/asjc.656 doi: 10.1002/asjc.656
|
| [18] | D. Cheng, H. Qi, Z. Li, Analysis and control of Boolean networks: a semi-tensor product approach, Berlin: Springer, 2011. https://doi.org/10.1007/978-0-85729-097-7 |
| [19] |
Y Zhao, Z. Li, D. Cheng, Optimal control of logical control networks, IEEE Trans. Automat. Control, 56 (2011), 1766–1776. https://doi.org/10.1109/TAC.2010.2092290 doi: 10.1109/TAC.2010.2092290
|
| [20] |
Y. Li, H. Li, W. Sun, Event-triggered control for robust set stabilization of logical control networks, Automatica, 95 (2018), 556–560. https://doi.org/10.1016/j.automatica.2018.06.030 doi: 10.1016/j.automatica.2018.06.030
|
| [21] |
J. Xia, J. Zhang, J. Feng, Z. Wang, G. Zhuang, Command filter-based adaptive fuzzy control for nonlinear systems with unknown control directions, IEEE Trans. Syst. Man Cybern., 51 (2021), 1945–1953. https://doi.org/10.1109/TSMC.2019.2911115 doi: 10.1109/TSMC.2019.2911115
|
| [22] |
A. Liu, H. Li, Stabilization of delayed Boolean control networks with state constraints: a barrier Lyapunov function method, IEEE Trans. Circuits Syst. II, 68 (2021), 2553–2557. https://doi.org/10.1109/TCSII.2021.3053081 doi: 10.1109/TCSII.2021.3053081
|
| [23] |
Y. Yu, B. Wang, J. Feng, Input observability of Boolean control networks, Neurocomputing, 333 (2019), 22–28. https://doi.org/10.1016/j.neucom.2018.12.014 doi: 10.1016/j.neucom.2018.12.014
|
| [24] |
Y. Yu, J. Feng, J. Pan, D. Cheng, Block decoupling of Boolean control networks, IEEE Trans. Automat. Control, 64 (2019), 3129–3140. https://doi.org/10.1109/tac.2018.2880411 doi: 10.1109/tac.2018.2880411
|
| [25] |
L. Wang, Y. Liu, Z. G. Wu, J. Lu, L. Yu, Stabilization and finite-time stabilization of probabilistic Boolean control networks, IEEE Trans. Syst. Man Cybern., 51 (2021), 1559–1566. https://doi.org/10.1109/TSMC.2019.2898880 doi: 10.1109/TSMC.2019.2898880
|
| [26] |
Y. Liu, B. Jiang, J. Lu, J. Cao, G. Lu, Event-triggered sliding mode control for attitude stabilization of a rigid spacecraft, IEEE Trans. Syst. Man Cybern., 50 (2020), 3290–3299. https://doi.org/10.1109/TSMC.2018.2867061 doi: 10.1109/TSMC.2018.2867061
|
| [27] | P. Duan, H. Lv, J. Feng, C. Liu, H. Li, Indoor dynamic thermal control based on fuzzy relation model, IET Control Theory Appl., 30 (2013), 215–221. |
| [28] | C. Zhang, H. Lyu, P. Duan, Y. Song, Fuzzy modeling of the semi-tensor product-based cold and hot electric installations, Archit. Electr., 34 (2015), 59–64. |
| [29] |
D. Cheng, H. Qi, Controllability and observability of Boolean control networks, Automatica, 45 (2009), 1659–1667. https://doi.org/10.1016/j.automatica.2009.03.006 doi: 10.1016/j.automatica.2009.03.006
|
| [30] |
D. Cheng, F. He, H. Qi, T. Xu, Modeling, analysis and control of networked evolutionary games, IEEE Trans. Automat. Control, 60 (2015), 2402–2415. https://doi.org/10.1109/TAC.2015.2404471 doi: 10.1109/TAC.2015.2404471
|
| [31] |
Y. Yan, D. Cheng, J. Feng, H. Li, J. Yue, Survey on applications of algebraic state space theory of logical systems to finite state machines, Sci. China Inf. Sci., 66 (2023), 111201. https://doi.org/10.1007/s11432-022-3538-4 doi: 10.1007/s11432-022-3538-4
|
| [32] |
H. Lyu, W. Wang, X. Liu, Modeling of multivariable fuzzy systems by semi-tensor product, IEEE Trans. Fuzzy Syst., 28 (2020), 228–235. https://doi.org/10.1109/TFUZZ.2019.2902820 doi: 10.1109/TFUZZ.2019.2902820
|
| [33] |
H. Lyu, W. Wang, X. Liu, Universal approximation of multivariable fuzzy systems by semitensor product, IEEE Trans. Fuzzy Syst., 28 (2020), 2972–2981. https://doi.org/10.1109/TFUZZ.2019.2946512 doi: 10.1109/TFUZZ.2019.2946512
|
| [34] |
S. Labiod, M. S. Boucherit, T. M. Guerra, Adaptive fuzzy control of a class of MIMO nonlinear systems, Fuzzy Sets Syst., 151 (2005), 59–77. https://doi.org/10.1016/j.fss.2004.10.009 doi: 10.1016/j.fss.2004.10.009
|
| [35] | J. E. Slotine, W. Li, Applied nonlinear control, Englewood Cliffs: Prentice Hall, 1991. |


Figures(6)
Hongli Lyu, Yanan Lyu, Yongchao Gao, Heng Qian, Shan Du. MIMO fuzzy adaptive control systems based on fuzzy semi-tensor product[J]. Mathematical Modelling and Control, 2023, 3(4): 316-330. doi: 10.3934/mmc.2023026


 DownLoad: