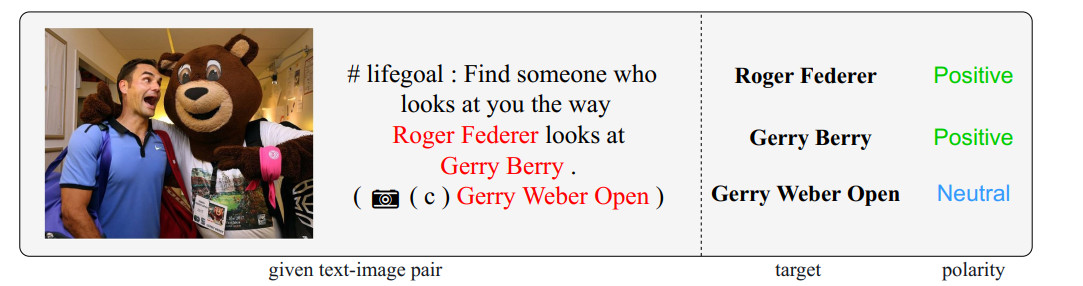
Multimodal aspect term extraction (MATE) and multimodal aspect-oriented sentiment classification (MASC) are two crucial subtasks in multimodal sentiment analysis. The use of pretrained generative models has attracted increasing attention in aspect-based sentiment analysis (ABSA). However, the inherent semantic gap between textual and visual modalities poses a challenge in transferring text-based generative pretraining models to image-text multimodal sentiment analysis tasks. To tackle this issue, this paper proposes a self-adaptive cross-modal attention fusion architecture for joint multimodal aspect-based sentiment analysis (JMABSA), which is a generative model based on an image-text selective fusion mechanism that aims to bridge the semantic gap between text and image representations and adaptively transfer a textual-based pretraining model to the multimodal JMASA task. We conducted extensive experiments on two benchmark datasets, and the experimental results show that our model significantly outperforms other state of the art approaches by a significant margin.
Citation: Ziyue Wang, Junjun Guo. Self-adaptive attention fusion for multimodal aspect-based sentiment analysis[J]. Mathematical Biosciences and Engineering, 2024, 21(1): 1305-1320. doi: 10.3934/mbe.2024056
Multimodal aspect term extraction (MATE) and multimodal aspect-oriented sentiment classification (MASC) are two crucial subtasks in multimodal sentiment analysis. The use of pretrained generative models has attracted increasing attention in aspect-based sentiment analysis (ABSA). However, the inherent semantic gap between textual and visual modalities poses a challenge in transferring text-based generative pretraining models to image-text multimodal sentiment analysis tasks. To tackle this issue, this paper proposes a self-adaptive cross-modal attention fusion architecture for joint multimodal aspect-based sentiment analysis (JMABSA), which is a generative model based on an image-text selective fusion mechanism that aims to bridge the semantic gap between text and image representations and adaptively transfer a textual-based pretraining model to the multimodal JMASA task. We conducted extensive experiments on two benchmark datasets, and the experimental results show that our model significantly outperforms other state of the art approaches by a significant margin.

| [1] |
L. Zhu, M. Xu, Y. Bao, Y. Xu, X. Kong, Deep learning for aspect-based sentiment analysis: A review, PeerJ Comput. Sci., 8 (2022), e1004. https://doi.org/10.7717/peerj-cs.1044 doi: 10.7717/peerj-cs.1044

|
| [2] |
L. Zhu, Z. Zhu, C. Zhang, Y. Xu, X. Kong, Multimodal sentiment analysis based on fusion methods: A survey, Inf. Fusion, 95 (2023), 306–325. https://doi.org/10.1016/j.inffus.2023.02.028 doi: 10.1016/j.inffus.2023.02.028
|
| [3] | J. Yu, J. Jiang, Adapting BERT for target-oriented multimodal sentiment classification, IJCAI, (2019), 5408–5414. https://doi.org/10.24963/ijcai.2019/751 |
| [4] | Z. Khan, Y. Fu, Exploiting BERT for multimodal target sentiment classification through input space translation, in Proceedings of the 29th ACM International Conference on Multimedia, (2021), 3034–3042. https://doi.org/10.1145/3474085.3475692 |
| [5] |
J. Yu, K. Chen, R. Xia, Hierarchical interactive multimodal transformer for aspect-based multimodal sentiment analysis, IEEE Trans. Affective Comput., 14 (2021), 1966–1978. https://doi.org/10.1109/TAFFC.2022.3171091 doi: 10.1109/TAFFC.2022.3171091
|
| [6] | L. Yan, J. Yu, R. Xia, Vision-language pre-training for multimodal aspect-based sentiment analysis, preprint, arXiv: 2204.07955. |
| [7] | H. Xu, B. Liu, L. Shu, P. S. Yu, Double embeddings and CNN-based sequence labeling for aspect extraction, preprint, arXiv: 1805.04601. |
| [8] | P. Liu, S. Joty, H. Meng, Fine-grained opinion mining with recurrent neural networks and word embeddings, in Proceedings of the 2015 Conference on Empirical Methods in Natural Language Processing, (2015), 1433–1443. https://doi.org/10.18653/v1/D15-1168 |
| [9] | D. Ma, S. Li, F. Wu, X. Xie, H. Wang, Exploring sequence-to-sequence learning in aspect term extraction, in Proceedings of the 57th Annual Meeting of The Association for Computational Linguistics, (2019), 3538–3547. https://doi.org/10.18653/v1/P19-1344 |
| [10] | J. Yu, K. Chen, R. Xia, Conditional augmentation for aspect term extraction via masked sequence-to-sequence generation, preprint, arXiv: 2004.14769. |
| [11] | C. Brun, D. N. Popa, C. Roux, XRCE: Hybrid classification for aspect-based sentiment analysis, in Proceedings of the 8th International Workshop on Semantic Evaluation (SemEval 2014), (2021), 838–842. https://doi.org/10.3115/v1/S14-2149 |
| [12] | M. Pontiki, D. Galanis, H. Papageorgiou, I. Androutsopoulos, S. Manandhar, M. AL-Smadi, et al., Semeval-2016 task 5: Aspect based sentiment analysis, in Proceedings of the 10th International Workshop on Semantic Evaluation (SemEval-2016), (2016), 19–30. https://doi.org/10.18653/v1/S16-1002 |
| [13] | H. T. Nguyen, M. Le Nguyen, Effective attention networks for aspect-level sentiment classification, in 2018 10th International Conference on Knowledge and Systems Engineering (KSE), IEEE, (2018), 25–30. https://doi.org/10.1109/KSE.2018.8573324 |
| [14] | J. Cheng, S. Zhao, J. Zhang, I. King, X. Zhang, H.Wang, Aspect-level sentiment classification with heat (hierarchical attention) network, in Proceedings of the 15th Conference of the European Chapter of the Association for Computational Linguistics, (2017), 97–106. https://doi.org/10.1145/3132847.3133037 |
| [15] | J. Liu, Y. Zhang, Attention modeling for targeted sentiment, in Proceedings of the 2017 ACM on Conference on Information and Knowledge Management, 2 (2017), 572–577. |
| [16] | Y. Tay, L. A. Tuan, S. C. Hui, Learning to attend via word-aspect associative fusion for aspect-based sentiment analysis, in Proceedings of the AAAI Conference on Artificial Intelligence, 32 (2018). https://doi.org/10.1609/aaai.v32i1.12049 |
| [17] | Y. Wang, M. Huang, X. Zhu, L. Zhao, Attention-based LSTM for aspect-level sentiment classification, in Proceedings of the 2016 Conference on Empirical Methods in Natural Language Processing, (2016), 606–615. |
| [18] | X. Li, L. Bing, W. Lam, B. Shi, Transformation networks for target-oriented sentiment classification, preprint, arXiv: 1805.01086. |
| [19] | W. Xue, T. Li, Aspect based sentiment analysis with gated convolutional networks, preprint, arXiv: 1805.07043. |
| [20] | C. Chen, Z. Teng, Y. Zhang, Inducing target-specific latent structures for aspect sentiment classification, in Proceedings of the 2020 Conference on Empirical Methods in Natural Language Processing (EMNLP), (2020), 5596–5607. https://doi.org/10.18653/v1/2020.emnlp-main.451 |
| [21] | K. Wang, W. Shen, Y. Yang, X. Quan, R. Wang, Relational graph attention network for aspect-based sentiment analysis, preprint, arXiv: 2004.12362. https://doi.org/10.48550/arXiv.2004.12362 |
| [22] | M. Zhang, T. Qian, Convolution over hierarchical syntactic and lexical graphs for aspect level sentiment analysis, in Proceedings of the 2020 Conference on Empirical Methods in Natural Language Processing (EMNLP), (2020), 3540–3549. https://doi.org/10.18653/v1/2020.emnlp-main.286 |
| [23] | H. Tang, D. Ji, C. Li, Q. Zhou, Dependency graph enhanced dual-transformer structure for aspect-based sentiment classification, in Proceedings of the 58th Annual Meeting of The Association for Computational Linguistics, (2020), 6578–6588. https://doi.org/10.18653/v1/2020.acl-main.588 |
| [24] | B. Huang, K. M. Carley, Syntax-aware aspect level sentiment classification with graph attention networks, preprint, arXiv: 1909.02606. https://doi.org/10.48550/arXiv.1909.02606 |
| [25] | J. Devlin, M. W. Chang, K. Lee, K. Toutanova, Bert: Pre-training of deep bidirectional transformers for language understanding, in Proceedings ofthe 2019 Conference of the North American Chapter ofthe Association for Computational Linguistics: Human Language Technologies, 1 (2019), 4171–4186. https://doi.org/10.18653/v1/N19-1423 |
| [26] | R. Li, H. Chen, F. Feng, Z. Ma, X. Wang, E. Hovy, Dual graph convolutional networks for aspect-based sentiment analysis, in Proceedings of the 59th Annual Meeting ofthe Association for Computational Linguistics and the 11th International Joint Conference on Natural Language Processing, 1 (2021), 6319–6329. https://doi.org/10.18653/v1/2021.acl-long.494 |
| [27] | M. Mitchell, J. Aguilar, T. Wilson, B. Van Durme, Open domain targeted sentiment, in Proceedings of the 2013 conference on empirical methods in natural language processing, (2013), 1643–1654. |
| [28] | M. Zhang, Y. Zhang, D. T. Vo, Neural networks for open domain targeted sentiment, in Proceedings of the 2015 Conference on Empirical Methods in Natural Language Processing, (2015), 612–621. https://doi.org/10.18653/v1/D15-1073 |
| [29] | M. Hu, Y. Peng, Z. Huang, D. Li, Y. Lv, Open-domain targeted sentiment analysis via span-based extraction and classification, preprint, arXiv: 1906.03820. |
| [30] | H. Yan, J. Dai, X. Qiu, Z. Zhang, A unified generative framework for aspect-based sentiment analysis, preprint, arXiv: 2106.04300. |
| [31] | N. Xu, W. Mao, G. Cheng, Multi-interactive memory network for aspect based multimodal sentiment analysis, in Proceedings of the AAAI Conference on Artificial Intelligence, 33 (2019), 371–378. https://doi.org/10.1609/aaai.v33i01.3301371 |
| [32] |
D. Gu, J. Wang, S. Cai, C. Yang, Z. Song, H. Zhao, et al., Targeted aspect-based multimodal sentiment analysis: An attention capsule extraction and multi-head fusion network, IEEE Access, 9 (2021), 157329–157336. https://doi.org/10.1109/ACCESS.2021.3126782 doi: 10.1109/ACCESS.2021.3126782
|
| [33] |
J. Yu, J. Jiang, R. Xia, Entity-sensitive attention and fusion network for entity-level multimodal sentiment classification, IEEE/ACM Trans. Audio Speech Language Process., 28 (2019), 429–439. https://doi.org/10.1109/TASLP.2019.2957872 doi: 10.1109/TASLP.2019.2957872
|
| [34] |
Z. Zhang, Z. Wang, X. Li, N. Liu, B. Guo, Z. Yu, ModalNet: An aspect-level sentiment classification model by exploring multimodal data with fusion discriminant attentional network, World Wide Web, 24 (2021), 1957–1974. https://doi.org/10.1007/s11280-021-00955-7 doi: 10.1007/s11280-021-00955-7
|
| [35] | X. Ju, D. Zhang, R. Xiao, J. Li, S. Li, M. Zhang, et al., Joint multi-modal aspect-sentiment analysis with auxiliary cross-modal relation detection, in Proceedings of the 2021 Conference on Empirical Methods in Natural Language Processing, (2021), 4395–4405. https://doi.org/10.18653/v1/2021.emnlp-main.360 |
| [36] | M. Lewis, Y. Liu, N. Goyal, M. Ghazvininejad, A. Mohamed, O. Levy, L. Zettlemoyer, Bart: Denoising sequence-to-sequence pre-training for natural language generation, translation, and comprehension, preprint, arXiv: 1910.13461. |
| [37] | P. Anderson, X. He, C. Buehler, D. Teney, M. Johnson, S. Gould, et al., Bottom-up and top-down attention for image captioning and visual question answering, in Proceedings of the IEEE Conference on Computer Vision and Pattern Recognition, (2018), 6077–6086. |
| [38] | A. Vaswani, N. Shazeer, N. Parmar, J. Uszkoreit, L. Jones, A. N. Gomez, I. Polosukhin, Attention is all you need, Adv. Neural Inf. Process. Syst., 30 (2017). |
| [39] | J. L. Ba, J. R. Kiros, G. E. Hinton, Layer normalization, preprint, arXiv: 1607.06450. |
| [40] | Y. H. H. Tsai, S. Bai, P. P. Liang, J. Z. Kolter, L. P. Morency, R. Salakhutdinov, Attention is all you need, in Proceedings of the conference Association for Computational Linguistics. Meeting, 2019 (2019), 6558–6569. https://doi.org/10.18653/v1/p19-1656 |
| [41] | J. Chen, Z. Yang, D. Yang, Mixtext: Linguistically-informed interpolation of hidden space for semi-supervised text classification, preprint, arXiv: 2004.12239. |
| [42] | Y. H. H. Tsai, S. Bai, P. P. Liang, J. Z. Kolter, L. P. Morency, R. Salakhutdinov, Km-bart: Knowledge enhanced multimodal bart for visual commonsense generation, preprint, arXiv: 2101.00419. |
| [43] | G. Chen, Y. Tian, Y. Song, Joint aspect extraction and sentiment analysis with directional graph convolutional networks, in Proceedings of the 28th International Conference on Computational Linguistics, (2020), 272–279. https://doi.org/10.18653/v1/2020.coling-main.24 |
| [44] | J. Yu, J. Jiang, L. Yang, R. Xia, Improving multimodal named entity recognition via entity span detection with unified multimodal transformer, Assoc. Comput. Linguist., (2020), 272–279. |
| [45] | H. Wu, S. Cheng, J. Wang, S. Li, L. Chi, Association for Computational Linguistics, in Natural Language Processing and Chinese Computing: 9th CCF International Conference, (2020), 145–156. |
| [46] | L. Sun, J. Wang, K. Zhang, Y. Su, F. Weng, RpBERT: A text-image relation propagation-based BERT model for multimodal NER, in Proceedings of the AAAI Conference on Artificial Intelligence, 35 (2021), 13860–13868. https://doi.org/10.1609/aaai.v35i15.17633 |
| [47] |
L. Yang, J. C. Na, J. Yu, Cross-modal multitask transformer for end-to-end multimodal aspect-based sentiment analysis, Inf. Process. Manage., 59 (2022), 103038. https://doi.org/10.1016/j.ipm.2022.103038 doi: 10.1016/j.ipm.2022.103038
|

Figures(2) / Tables(7)

Ziyue Wang, Junjun Guo. Self-adaptive attention fusion for multimodal aspect-based sentiment analysis[J]. Mathematical Biosciences and Engineering, 2024, 21(1): 1305-1320. doi: 10.3934/mbe.2024056


 DownLoad: