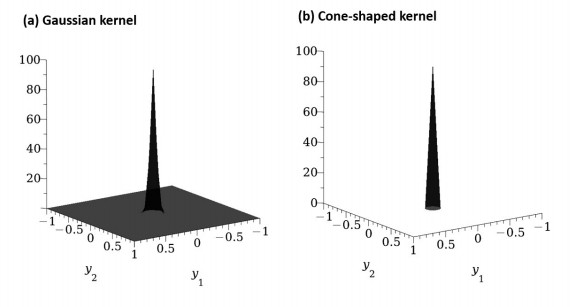
The movement of cells during (normal and abnormal) wound healing is the result of biomechanical interactions that combine cell responses with growth factors as well as cell-cell and cell-matrix interactions (adhesion and remodelling). It is known that cells can communicate and interact locally and non-locally with other cells inside the tissues through mechanical forces that act locally and at a distance, as well as through long non-conventional cell protrusions. In this study, we consider a non-local partial differential equation model for the interactions between fibroblasts, macrophages and the extracellular matrix (ECM) via a growth factor (TGF-$ \beta $) in the context of wound healing. For the non-local interactions, we consider two types of kernels (i.e., a Gaussian kernel and a cone-shaped kernel), two types of cell-ECM adhesion functions (i.e., adhesion only to higher-density ECM vs. adhesion to higher-/lower-density ECM) and two types of cell proliferation terms (i.e., with and without decay due to overcrowding). We investigate numerically the dynamics of this non-local model, as well as the dynamics of the localised versions of this model (i.e., those obtained when the cell perception radius decreases to 0). The results suggest the following: (ⅰ) local models explain normal wound healing and non-local models could also explain abnormal wound healing (although the results are parameter-dependent); (ⅱ) the models can explain two types of wound healing, i.e., by primary intention, when the wound margins come together from the side, and by secondary intention when the wound heals from the bottom up.
Citation: O. E. Adebayo, S. Urcun, G. Rolin, S. P. A. Bordas, D. Trucu, R. Eftimie. Mathematical investigation of normal and abnormal wound healing dynamics: local and non-local models[J]. Mathematical Biosciences and Engineering, 2023, 20(9): 17446-17498. doi: 10.3934/mbe.2023776
The movement of cells during (normal and abnormal) wound healing is the result of biomechanical interactions that combine cell responses with growth factors as well as cell-cell and cell-matrix interactions (adhesion and remodelling). It is known that cells can communicate and interact locally and non-locally with other cells inside the tissues through mechanical forces that act locally and at a distance, as well as through long non-conventional cell protrusions. In this study, we consider a non-local partial differential equation model for the interactions between fibroblasts, macrophages and the extracellular matrix (ECM) via a growth factor (TGF-$ \beta $) in the context of wound healing. For the non-local interactions, we consider two types of kernels (i.e., a Gaussian kernel and a cone-shaped kernel), two types of cell-ECM adhesion functions (i.e., adhesion only to higher-density ECM vs. adhesion to higher-/lower-density ECM) and two types of cell proliferation terms (i.e., with and without decay due to overcrowding). We investigate numerically the dynamics of this non-local model, as well as the dynamics of the localised versions of this model (i.e., those obtained when the cell perception radius decreases to 0). The results suggest the following: (ⅰ) local models explain normal wound healing and non-local models could also explain abnormal wound healing (although the results are parameter-dependent); (ⅱ) the models can explain two types of wound healing, i.e., by primary intention, when the wound margins come together from the side, and by secondary intention when the wound heals from the bottom up.

| [1] |
R. F. Diegelmann, R. F. Evans, Wound healing: an overview of acute, fibrotic and delayed healing, Front. Biosci., 9 (2004), 283–289. https://doi.org/10.2741/1184 doi: 10.2741/1184

|
| [2] |
D. Zuo, Y. He, S. Avril, H. Yang, K. Hackl, A thermodynamic framework for unified continuum models for the healing of damaged soft biological tissue, J. Mech. Phys. Solids, 158 (2022), 104662. https://doi.org/10.1016/j.jmps.2021.104662 doi: 10.1016/j.jmps.2021.104662
|
| [3] |
S. Enoch, D. J. Leaper, Basic science of wound healing, Surgery, 23 (2005), 37–42. https://doi.org/10.1383/surg.23.2.37.60352 doi: 10.1383/surg.23.2.37.60352
|
| [4] | G. Gurtner, V. W. Wong, Wound Healing: Normal and Abnormal, Philadelphia, PA, (2014), 13–19. |
| [5] |
G. C. Limandjaja, L. J. van den Broek, T. Waaijman, M. Breetveld, S. Monstrey, R. J. Scheper, et al., Reconstructed human keloid models show heterogeneity within keloid scars, Arch. Dermatol. Res., 310 (2018), 815–826. https://doi.org/10.1007/s00403-018-1873-1 doi: 10.1007/s00403-018-1873-1
|
| [6] |
G. C. Limandjaja, F. B. Niessen, R. J. Scheper, S. Gibbs, Hypertrophic scars and keloids: Overview of the evidence and practical guide for differentiating between these abnormal scars, Exp. Dermatol., 30 (2021), 146–161. https://doi.org/10.1111/exd.14121 doi: 10.1111/exd.14121
|
| [7] |
S. GibbsPakyari, S. GibbsFarrokhi, M. K. Maharlooei, A. Ghahary, Critical role of transforming growth factor beta in different phases of wound healing, Adv. Wound Care, 2 (2013), 215–224. https://doi.org/10.1089/wound.2012.0406 doi: 10.1089/wound.2012.0406
|
| [8] |
S. Sanjabi, L. A. Zenewicz, M. Kamanaka, R. A. Flavell, Anti-inflammatory and pro-inflammatory roles of TGF-$\beta$, IL-10, and IL-22 in immunity and autoimmunity, Curr. Opin. Pharmacol., 250 (2009), 447–453. https://doi.org/10.1016/j.coph.2009.04.008 doi: 10.1016/j.coph.2009.04.008
|
| [9] |
E. Comellas, T. C. Gasser, T. C. Bellomo, S. Oller, A homeostatic-driven turnover remodelling constitutive model for healing in soft tissues, J. R. Soc. Interface, 13 (2016), 20151081. https://doi.org/10.1098/rsif.2015.1081 doi: 10.1098/rsif.2015.1081
|
| [10] |
M. Pakyari, A. Farrokhi, M. K. Maharlooei, A. Ghahary, Critical role of transforming growth factor beta in different phases of wound healing, Adv. Wound Care, 2 (2013), 215–224. https://doi.org/10.1089/wound.2012.0406 doi: 10.1089/wound.2012.0406
|
| [11] |
J. A. Flegg, J. A. Menon, P. K. Maini, D. L. S. McElwain, On the mathematical modeling of wound healing angiogenesis in skin as a reaction-transport process, Front. Physiol., 6 (2015), 1–17. https://doi.org/10.3389/fphys.2015.00262 doi: 10.3389/fphys.2015.00262
|
| [12] | R. Eftimie, G. Rolin, O. Adebayo, S. Urcun, F. Chouly, S. P. A. Bordas, Modelling keloid dynamics: a brief review and new mathematical perspectives, Submitted, 2023. |
| [13] |
J. A. Sherratt, J. D. Murray, Models of epidermal wound healing, Proc. R. Soc. London, Ser. B, 241 (1990), 29–36. https://doi.org/10.1098/rspb.1990.0061 doi: 10.1098/rspb.1990.0061
|
| [14] |
G. J. Pettet, H. M. Byrne, D. L. S. McElwain, J. Norbury, A model of wound-healing angiogenesis in soft tissue, Math. Biosci., 136 (1996), 35–63. https://doi.org/10.1016/0025-5564(96)00044-2 doi: 10.1016/0025-5564(96)00044-2
|
| [15] |
G. Pettet, M. A. J. Chaplain, D. L. S. McElwain, H. M. Byrne, On the role of angiogenesis in wound healing, Proc. R. Soc. London, Ser. B, 263 (1996), 1487–1493. https://doi.org/10.1098/rspb.1996.0217 doi: 10.1098/rspb.1996.0217
|
| [16] |
E. A. Gaffney, K. Pugh, P. K. Maini, F. Arnold, Investigating a simple model of cutaneous wound healing angiogenesis, J. Math. Biol., 45 (2002), 337–374. https://doi.org/10.1007/s002850200161 doi: 10.1007/s002850200161
|
| [17] |
R. C. Schugart, A. Friedman, R. Zhao, C. K. Sen, Wound angiogenesis as a function of tissue oxygen tension: A mathematical model, Proc. Natl. Acad. Sci., 105 (2008), 26–28. https://doi.org/10.1073/pnas.0711642105 doi: 10.1073/pnas.0711642105
|
| [18] |
M. Byrne, M. A. J. Chaplain, D. L. Evans, I. Hopkinson, Mathematical modelling of angiogenesis in wound healing:comparison of theory and experiment, J. Theor. Med., 2 (2000), 175–197. https://doi.org/10.1080/10273660008833045 doi: 10.1080/10273660008833045
|
| [19] |
J. A. Flegg, H. M. Byrne, D. L. S. McElwain, Mathematical model of hyperbaric oxygen therapy applied to chronic diabetic wounds, Bull. Math. Biol., 72 (2010), 1867–1891. https://doi.org/10.1007/s11538-010-9514-7 doi: 10.1007/s11538-010-9514-7
|
| [20] |
B. D. Cumming, D. L. S. McElwain, Z. Upton, A mathematical model of wound healing and subsequent scarring, J. R. Soc. Interface, 7 (2010), 19–34. https://doi.org/10.1098/rsif.2008.0536 doi: 10.1098/rsif.2008.0536
|
| [21] |
D. Zuo, S. Avril, H. Yang, S. J. Mousavi, K. Hackl, Y. He, 3D numerical simulation of soft tissue wound healing using constrained-mixture anisotropic hyperelasticity and gradient-enhanced damage mechanics, J. R. Soc. Interface, 17 (2020), 20190708. https://doi.org/10.1098/rsif.2019.0708 doi: 10.1098/rsif.2019.0708
|
| [22] |
Y. Kim, M. A. Stolarska, H. G. Othmer, A hybrid model for tumor spheroid growth in vitro I: Theoretical development and early results, Math. Models Methods Appl. Sci., 17 (2007), 1773–1798. https://doi.org/10.1142/S0218202507002479 doi: 10.1142/S0218202507002479
|
| [23] |
S. Caviglia, E. A. Ober, Non-conventional protrusions: the diversity of cell interactions at short and long distance, Curr. Opin. Cell Biol., 54 (2018), 106–113. https://doi.org/10.1016/j.ceb.2018.05.013 doi: 10.1016/j.ceb.2018.05.013
|
| [24] |
D. S. Eom, Airinemes: thin cellular protrusions mediate long-distance signalling guided by macrophages, Open Biol., 10 (2020), 200039. https://doi.org/10.1098/rsob.200039 doi: 10.1098/rsob.200039
|
| [25] |
C. Metzner, F. Hörsch, C. Mark, T. Czerwinski, A. Winterl, C. Voskens, Detecting long-lange interactions between migrating cells, Sci. Rep., 11 (2021), 15031. https://doi.org/10.1038/s41598-021-94458-0 doi: 10.1038/s41598-021-94458-0
|
| [26] |
S. I. Despa, F. Despa, Diffusion model for growth factors–-cell receptors interaction, Biosystems, 44 (1997), 59–68. https://doi.org/10.1016/S0303-2647(97)00047-6 doi: 10.1016/S0303-2647(97)00047-6
|
| [27] |
F. Sefat, M. C. Denyer, M. Youseffi, Effects of different transforming growth factor beta-$\beta$ isomers on wound closure of bone cell monolayers, Cytokine, 69 (2014), 75–86. https://doi.org/10.1016/j.cyto.2014.05.010 doi: 10.1016/j.cyto.2014.05.010
|
| [28] |
J. P. Andrews, J. Marttala, E. Macarak, J. Rosenbloom, J. Uitto, Keloids: The paradigm of skin fibrosis–-pathomechanisms and treatment, Matrix Biol., 51 (2016), 37–46. https://doi.org/10.1016/j.matbio.2016.01.013 doi: 10.1016/j.matbio.2016.01.013
|
| [29] |
P. Dicker, P. Pohjanpelto, P. Pettican, E. Rozengurt, Similarities between fibroblast-derived growth factor and platelet-derived growth factor, Exp. Cell Res., 135 (1981), 221–227. https://doi.org/10.1016/0014-4827(81)90314-1 doi: 10.1016/0014-4827(81)90314-1
|
| [30] |
P. Sroobant, M. D. Waterfield, E. Rozengurt, Purification of fibroblast-derived growth factor, Methods Enzymol., 147 (1987), 40–47. https://doi.org/10.1016/0076-6879(87)47097-3 doi: 10.1016/0076-6879(87)47097-3
|
| [31] |
A. Viola, F. Munari, R. Sánchez-Rodríguez, T. Scolaro, A. Castegna, The metabolic signature of macrophage responses, Front. Immunol., 10 (2019), 1–16. https://doi.org/10.3389/fimmu.2019.00001 doi: 10.3389/fimmu.2019.00001
|
| [32] |
S. Huda, B. Weigelin, K. Wolf, K. V. Tretiakov, K. Polev, G. Wilk, et al., Lévy-like movement patterns of metastatic cancer cells revealed in microfabricated systems and implicated in vivo, Nat. Commun., 9 (2018), 4539. https://doi.org/10.1038/s41467-018-06563-w doi: 10.1038/s41467-018-06563-w
|
| [33] |
R. J. Petrie, A. D. Doyle, K. M. Yamada, Random versus directionally persistent cell migration, Nat. Rev. Mol. Cell Biol., 10 (2009), 538–549. https://doi.org/10.1038/nrm2729 doi: 10.1038/nrm2729
|
| [34] |
M. V. Plikus, X. Wang, S. Sinha, E. Forte, S. M. Thompson, E. L. Herzog, et al., Fibroblasts: origins, definitions, and functions in health and disease, Cell, 184 (2021), 3852–3872. https://doi.org/10.1016/j.cell.2021.06.024 doi: 10.1016/j.cell.2021.06.024
|
| [35] |
W. Jin, E. T. Shah, C. J. Penington, S. W. McCue, P. K. Maini, M. J. Simpson, et al., Logistic proliferation of cells in scratch assays is delayed, Bull. Math. Biol., 79 (2017), 1028–1050. https://doi.org/10.1007/s11538-017-0267-4 doi: 10.1007/s11538-017-0267-4
|
| [36] |
S. Suveges, R. Eftimie, D. Trucu, Directionality of macrophages movement in tumour invasion: A multiscale moving-boundary approach, Bull. Math. Biol., 82 (2020), 148. https://doi.org/10.1007/s11538-020-00819-7 doi: 10.1007/s11538-020-00819-7
|
| [37] |
G. C. Limandjaja, F. B. Niessen, R. J. Scheper, S. Gibbs, The keloid disorder: Heterogeneity, histopathology, mechanisms and models, Front. Cell Dev. Biol., 8 (2020), 360. https://doi.org/10.3389/fcell.2020.00360 doi: 10.3389/fcell.2020.00360
|
| [38] |
B. Stix, T. Kähne, K. Sletten, J. Raynes, A. Roessner, C. Röacken, Proteolysis of aa amyloid fibril proteins by matrix metalloproteinases -1, -2, and -3, Am. J. Pathol., 159 (2001), 561–570. https://doi.org/10.1016/S0002-9440(10)61727-0 doi: 10.1016/S0002-9440(10)61727-0
|
| [39] |
M. C. Liao, W. E. V. Nostrand, Degradation of soluble and fibrillar amyloid $\beta$-protein by matrix metalloproteinase (mt1-mmp) in vitro, Biochemistry, 49 (2010), 1127–1136. https://doi.org/10.1021/bi901994d doi: 10.1021/bi901994d
|
| [40] |
D. Madsen, T. Bugge, The soure of matrix-degrading enzymes in human cancer: problems of research reproducibility and possible solutions, J. Cell Biol., 209 (2015), 195–198. https://doi.org/10.1083/jcb.201501034 doi: 10.1083/jcb.201501034
|
| [41] | M. Aristorena, E. Gallardo-Vara, M. Vicen, M. de Las Casas-Engel, L. Ojeda-Fernandez, C. Nieto, et al., MMP-12, secreted by pro-inflammatory macrophages, targets endoglin in human macrophages and endothelial cells, Int. J. Mol. Sci., 20 (2019), 3107. https://doi.org/10.3390/ijms20123107 |
| [42] |
W. C. Huang, G. B. Sala-Newby, A. Susana, J. L. Johnson, A. C. Newby, Classical macrophage activation up-regulates several matrix metalloproteinases through mitogen activated protein kinases and nuclear factor-kb, PLoS One, 7 (2012), 1–14. https://doi.org/10.1371/journal.pone.0042507 doi: 10.1371/journal.pone.0042507
|
| [43] |
P. Vitorino, T. Meyer, Modular control of endothelial sheet migration, Genes Dev., 22 (2008), 3268–3281. https://doi.org/10.1101/gad.1725808 doi: 10.1101/gad.1725808
|
| [44] |
L. E. Tracy, R. A. Minasian, E. J. Caterson, Extracellular matrix and dermal fibroblast function in the healing wound, Adv. Wound Care, 5 (2016), 119–136. https://doi.org/10.1089/wound.2014.0561 doi: 10.1089/wound.2014.0561
|
| [45] |
A. Alsisi, R. Eftimie, D. Trucu, Non-local multiscale approach for the impact of go or grow hypothesis on tumour-viruses interactions, Math. Biosci. Eng., 18 (2021), 5252–5284. https://doi.org/10.3934/mbe.2021267 doi: 10.3934/mbe.2021267
|
| [46] |
A. Alsisi, R. Eftimie, D. Trucu, Non-local multiscale approaches for tumour-oncolytic viruses interactions, Math. Appl. Sci. Eng., 1 (2020), 249–273. https://doi.org/10.5206/mase/10773 doi: 10.5206/mase/10773
|
| [47] |
Y. Koyama, K. Norose-Toyoda, S. Hirano, M. Kobayashi, M. Ebihara, I. Someki, et al., Type Ⅰ collagen is a non-adhesive extracellular matrix for macrophages, Arch. Histol. Cytol., 63 (2000), 71–79. https://doi.org/10.1679/aohc.63.71 doi: 10.1679/aohc.63.71
|
| [48] |
J. Y. Hsieh, M. T. Keating, T. D. Smith, V. S. Meli, E. L. Botvinick, W. F. Liu, Matrix crosslinking enhances macrophage adhesion, migration, and inflammatory activation, APL Bioeng., 3 (2019), 016103. https://doi.org/10.1063/1.5067301 doi: 10.1063/1.5067301
|
| [49] |
G. F. Weber, M. A. Bjerke, D. W. DeSimone, Integrins and cadherins join forces to form adhesive networks, J. Cell Sci., 124 (2011), 1183–1193. https://doi.org/10.1242/jcs.064618 doi: 10.1242/jcs.064618
|
| [50] |
J. M. Teddy, J. M. Kulesa, In vivo evidence for short- and long-range cell communication in cranial neural crest cells, Development (Cambridge, England), 131 (2004), 6141–6151. https://doi.org/10.1242/dev.01534 doi: 10.1242/dev.01534
|
| [51] |
A. Gerisch, A. Chaplain, Mathematical modelling of cancer cell invasion of tissue: local and non-local models and the effect of adhesion, J. Theor. Biol., 250 (2008), 684–704. https://doi.org/10.1016/j.jtbi.2007.10.026 doi: 10.1016/j.jtbi.2007.10.026
|
| [52] | T. J. R. Huges, The Finite Element Method: Linear Static and Dynamic Finite Element Analysis, Prentice Hall, Englewood Cliffs, New Jersey 07632, 1987. |
| [53] |
P. Domschke, D, Trucu, A, Gerisch, M. Chaplain, Mathematical modelling of cancer invasion: implications of cell adhesion variability for tumour infiltrative growth patterns, J. Theor. Biol., 361 (2014), 41–60. https://doi.org/10.1016/j.jtbi.2014.07.010 doi: 10.1016/j.jtbi.2014.07.010
|
| [54] |
R. Shuttleworth, R. Trucu, Multiscale modelling of fibres dynamics and cell adhesion within moving boundary cancer invasion, Bull. Math. Biol., 81 (2019), 2176–2219. https://doi.org/10.1007/s11538-019-00598-w doi: 10.1007/s11538-019-00598-w
|
| [55] |
S. Luo, M. Benathan, W. Raffoul, R. G. Panizzon, D. V. Egloff, Abnormal balance between proliferation and apoptotic cell death in fibroblasts derived from keloid lesions, Plast. Reconstr. Surg., 107 (2001), 87–96. https://doi.org/10.1023/A:1011941121102 doi: 10.1023/A:1011941121102
|
| [56] |
S. Chhabra, N. Chhabra, A. Kaur, N. Gupta, Wound healing concepts in clinical practice of OMFS, J. Maxillofac. Oral Surg., 250 (2017), 403–423. https://doi.org/10.1007/s12663-016-0880-z doi: 10.1007/s12663-016-0880-z
|
| [57] |
G. Peyret, R. Mueller, J. d'Alessandro, J. Begnaud, P. Marcq, R. M. Mège, et al., Sustained oscillations of epithelial cell sheets, Biophys. J., 117 (2019), 464–478. https://doi.org/10.1016/j.bpj.2019.06.013 doi: 10.1016/j.bpj.2019.06.013
|
| [58] |
R. B. Diller, A. J. Tabor, Role of the extracellular matrix (ecm) in wound healing: A review, Biomimetics, 7 (2022), 87. https://doi.org/10.3390/biomimetics7030087 doi: 10.3390/biomimetics7030087
|
| [59] |
J. Larouche, S. Sheoran, K. Maruyama, M. M. Martino, Immune regulation of skin wound healing: mechanisms and novel therapeutic targets, Adv. Wound Care, 7 (2018), 209–231. https://doi.org/10.1089/wound.2017.0761 doi: 10.1089/wound.2017.0761
|
| [60] |
J. Pang, M. Maienschein-Cline, M. Koh, Monocyte/macrophage heterogeneity during skin wound healing in mice, J. Immunol., 209 (2022), 1999–2011. https://doi.org/10.4049/jimmunol.2200365 doi: 10.4049/jimmunol.2200365
|
| [61] |
H. E. Talbott, S. Mascharak, M. Griffin, D. C. Wan, M. T. Longaker, Wound healing, fibroblast heterogeneity, and fibrosis, Cell Stem Cell, 29 (2022), 1161–1180. https://doi.org/10.1016/j.stem.2022.07.006 doi: 10.1016/j.stem.2022.07.006
|
| [62] |
M. Alwuthaynani, R. Eftimie, D. Trucu, Inverse problem approaches for mutation laws in heterogeneous tumours with local and nonlocal dynamics, Math. Biosci. Eng., 19 (2022), 3720–3747. https://doi.org/10.3934/mbe.2022171 doi: 10.3934/mbe.2022171
|
| [63] | J. van Kan, A. Segal, F. Vermolen, Numerical Methods in Scientific Computing, Delft Academic Press, Mekelweg 4 2628 CD Delft, Netherlands, 2014. |
| [64] | H. P. Langtangen, A FEniCS tutorial, in Automated Solution of Differential Equations by the Finite Element Method, The FEniCS Book (eds. A. Logg, K. A. Mardal, G. N. Wells), Springer, Berlin Heidelberg, (2012), 1–73. https://doi.org/10.1007/978-3-642-23099-8_1 |


Figures(20) / Tables(1)

O. E. Adebayo, S. Urcun, G. Rolin, S. P. A. Bordas, D. Trucu, R. Eftimie. Mathematical investigation of normal and abnormal wound healing dynamics: local and non-local models[J]. Mathematical Biosciences and Engineering, 2023, 20(9): 17446-17498. doi: 10.3934/mbe.2023776


 DownLoad: