Multivariate statistical monitoring methods are proven to be effective for the dynamic tobacco strip manufacturing process. However, the traditional methods are not sensitive enough to small faults and the practical tobacco processing monitoring requires further root cause of quality issues. In this regard, this study proposed a unified framework of detection-identification-tracing. This approach developed a dissimilarity canonical variable analysis (CVA), namely, it integrated the dissimilarity analysis concept into CVA, enabling the description of incipient relationship among the process variables and quality variables. We also adopted the reconstruction-based contribution to separate the potential abnormal variable and form the candidate set. The transfer entropy method was used to identify the causal relationship between variables and establish the matrix and topology diagram of causal relationships for root cause diagnosis. We applied this unified framework to the practical operation data of tobacco strip processing from a tobacco factory. The results showed that, compared with traditional contribution plot of anomaly detection, the proposed approach cannot only accurately separate abnormal variables but also locate the position of the root cause. The dissimilarity CVA proposed in this study outperformed traditional CVA in terms of sensitiveness to faults. This method would provide theoretical support for the reliable abnormal detection and diagnosis in the tobacco production process.
Citation: Linchao Yang, Ying Liu, Guanglu Yang, Shi-Tong Peng. Dynamic monitoring and anomaly tracing of the quality in tobacco strip processing based on improved canonical variable analysis and transfer entropy[J]. Mathematical Biosciences and Engineering, 2023, 20(8): 15309-15325. doi: 10.3934/mbe.2023684
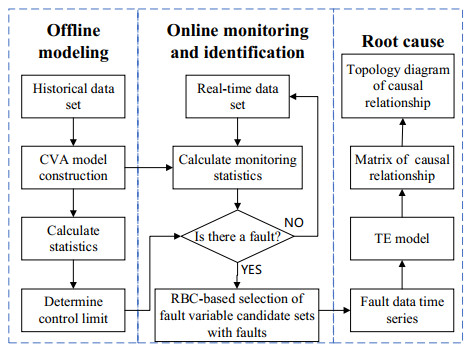
Multivariate statistical monitoring methods are proven to be effective for the dynamic tobacco strip manufacturing process. However, the traditional methods are not sensitive enough to small faults and the practical tobacco processing monitoring requires further root cause of quality issues. In this regard, this study proposed a unified framework of detection-identification-tracing. This approach developed a dissimilarity canonical variable analysis (CVA), namely, it integrated the dissimilarity analysis concept into CVA, enabling the description of incipient relationship among the process variables and quality variables. We also adopted the reconstruction-based contribution to separate the potential abnormal variable and form the candidate set. The transfer entropy method was used to identify the causal relationship between variables and establish the matrix and topology diagram of causal relationships for root cause diagnosis. We applied this unified framework to the practical operation data of tobacco strip processing from a tobacco factory. The results showed that, compared with traditional contribution plot of anomaly detection, the proposed approach cannot only accurately separate abnormal variables but also locate the position of the root cause. The dissimilarity CVA proposed in this study outperformed traditional CVA in terms of sensitiveness to faults. This method would provide theoretical support for the reliable abnormal detection and diagnosis in the tobacco production process.

| [1] |
J. Yi, C. Lu, G. Li, A literature review on latest developments of Harmony Search and its applications to intelligent manufacturing, Math. Biosci. Eng., 16 (2019), 2086–2117. https://doi.org/10.3934/mbe.2019102 doi: 10.3934/mbe.2019102

|
| [2] |
J. A. C. Bokhorst, W. Knol, J. Slomp, T. Bortolotti, Assessing to what extent smart manufacturing builds on lean principles, Int. J. Prod. Econ., 253 (2022), 108599. https://doi.org/10.1016/j.ijpe.2022.108599 doi: 10.1016/j.ijpe.2022.108599
|
| [3] |
X. Shen, Y. Zhang, Y. Tang, Y. Qin, N. Liu, Z. Yi, A study on the impact of digital tobacco logistics on tobacco supply chain performance: taking the tobacco industry in Guangxi as an example, Ind. Manag. Data Syst., 122 (2022), 1416–1452. https://doi.org/10.1108/IMDS-05-2021-0270 doi: 10.1108/IMDS-05-2021-0270
|
| [4] |
G. W. Vogl, B. A. Weiss, M. Helu, A review of diagnostic and prognostic capabilities and best practices for manufacturing, J. Intell. Manuf., 30 (2019), 79–95. https://doi.org/10.1007/s10845-016-1228-8 doi: 10.1007/s10845-016-1228-8
|
| [5] |
Q. Wang, X. Li, Z. Zhang, B. Tang, Carbon emissions reduction in tobacco primary processing line: A case study in China, J. Clean. Prod., 175 (2018), 18–28. https://doi.org/10.1016/j.jclepro.2017.11.055 doi: 10.1016/j.jclepro.2017.11.055
|
| [6] |
M. Zhu, K. Wu, Y. Zhou, Z. Wang, J. Qiao, Y. Wang, et al., Prediction of cooling moisture content after cut tobacco drying process based on a particle swarm optimization-extreme learning machine algorithm, Math. Biosci. Eng., 18 (2021), 2496–2507. https://doi.org/10.3934/mbe.2021127 doi: 10.3934/mbe.2021127
|
| [7] |
C. Zou, P. Qiu, Multivariate statistical process control using LASSO, J. Am. Stat. Assoc., 104 (2009), 1586–1596. https://doi.org/10.1198/jasa.2009.tm08128 doi: 10.1198/jasa.2009.tm08128
|
| [8] | J. Oakland, R. Oakland, Statistical Process Control (7th Edition), Routledge, New York, 2019. https://doi.org/10.4324/9781315160511 |
| [9] |
K. H. Liland, U. G. Indahl, J. Skogholt, P. Mishra, The canonical partial least squares approach to analysing multiway datasets—N-CPLS, J. Chemom., 36 (2022), 1–14. https://doi.org/10.1002/cem.3432 doi: 10.1002/cem.3432
|
| [10] |
J. Camacho, A. Pérez-Villegas, P. Garciá-Teodoro, G. MacIá-Fernández, PCA-based multivariate statistical network monitoring for anomaly detection, Comput. Secur., 59 (2016), 118–137. https://doi.org/10.1016/j.cose.2016.02.008 doi: 10.1016/j.cose.2016.02.008
|
| [11] | P. Qiu, Introduction to Statistical Process Control, CRC Press, Boca Raton, 2014. |
| [12] |
J. Qian, Z. Song, Y. Yao, Z. Zhu, X. Zhang, A review on autoencoder based representation learning for fault detection and diagnosis in industrial processes, Chemom. Intell. Lab. Syst., 231 (2022), 104711. https://doi.org/10.1016/j.chemolab.2022.104711 doi: 10.1016/j.chemolab.2022.104711
|
| [13] |
X. Wang, P. Wang, X. Gao, Y. Qi, On-line quality prediction of batch processes using a new kernel multiway partial least squares method, Chemom. Intell. Lab. Syst., 158 (2016), 138–145. https://doi.org/10.1016/j.chemolab.2016.06.017 doi: 10.1016/j.chemolab.2016.06.017
|
| [14] |
Q. Jiang, X. Yan, H. Yi, F. Gao, Data-driven batch-end quality modeling and monitoring based on optimized sparse partial least squares, IEEE Trans. Ind. Electron., 67 (2020), 4098–4107. https://doi.org/10.1109/TIE.2019.2922941 doi: 10.1109/TIE.2019.2922941
|
| [15] |
W. Zhou, Z. Zheng, W. Xie, A control-chart-based queueing approach for service facility maintenance with energy-delay tradeoff, Eur. J. Oper. Res., 261 (2017), 613–625. https://doi.org/10.1016/j.ejor.2017.03.026 doi: 10.1016/j.ejor.2017.03.026
|
| [16] |
C. Zou, W. Jiang, F. Tsung, A LASSO-based diagnostic framework for multivariate statistical process control, Technometrics, 53 (2011), 297–309. https://doi.org/10.1198/TECH.2011.10034 doi: 10.1198/TECH.2011.10034
|
| [17] |
C. Zhao, C. F. Lui, S. Du, D. Wang, Y. Shao, An earth mover's distance based multivariate generalized likelihood ratio control chart for effective monitoring of 3D point cloud surface, Comput. Ind. Eng., 175 (2023), 108911. https://doi.org/https://doi.org/10.1016/j.cie.2022.108911 doi: 10.1016/j.cie.2022.108911
|
| [18] |
M. Dixon, Industrial forecasting with exponentially smoothed recurrent neural networks, Technometrics, 64 (2022), 114–124. https://doi.org/10.1080/00401706.2021.1921035 doi: 10.1080/00401706.2021.1921035
|
| [19] |
Y. Wang, M. Perry, D. Whitlock, J. W. Sutherland, Detecting anomalies in time series data from a manufacturing system using recurrent neural networks, J. Manuf. Syst., 62 (2022), 823–834. https://doi.org/10.1016/j.jmsy.2020.12.007 doi: 10.1016/j.jmsy.2020.12.007
|
| [20] |
J. A. Westerhuis, S. P. Gurden, A. K. Smilde, Generalized contribution plots in multivariate statistical process monitoring, Chemom. Intell. Lab. Syst., 51 (2000), 95–114. https://doi.org/10.1016/S0169-7439(00)00062-9. doi: 10.1016/S0169-7439(00)00062-9
|
| [21] |
C. Zhao, F. Gao, A sparse dissimilarity analysis algorithm for incipient fault isolation with no priori fault information, Control Eng. Pract., 65 (2017), 70–82. https://doi.org/10.1016/j.conengprac.2017.05.005 doi: 10.1016/j.conengprac.2017.05.005
|
| [22] |
L. Feng, C. Zhao, Y. Sun, Dual attention-based encoder-decoder: A customized sequence-to-sequence learning for soft sensor development, IEEE Trans. Neural Networks Learn. Syst., 32 (2021), 3306–3317. https://doi.org/10.1109/TNNLS.2020.3015929 doi: 10.1109/TNNLS.2020.3015929
|
| [23] |
Y. Wang, C. Zhao, Probabilistic fault diagnosis method based on the combination of nest-loop fisher discriminant analysis and analysis of relative changes, Control Eng. Pract., 68 (2017), 32–45. https://doi.org/10.1016/j.conengprac.2017.07.009 doi: 10.1016/j.conengprac.2017.07.009
|
| [24] |
L. Feng, C. Zhao, B. Huang, Adversarial smoothing tri-regression for robust semi-supervised industrial soft sensor, J. Process Control, 108 (2021), 86–97. https://doi.org/10.1016/j.jprocont.2021.11.001 doi: 10.1016/j.jprocont.2021.11.001
|
| [25] |
Y. Shao, S. Du, H. Tang, An extended bi-dimensional empirical wavelet transform based filtering approach for engineering surface separation using high definition metrology, Measurement, 178 (2021), 109259. https://doi.org/10.1016/j.measurement.2021.109259 doi: 10.1016/j.measurement.2021.109259
|
| [26] |
Y. Shao, F. Xu, J. Chen, J. Lu, S. Du, Engineering surface topography analysis using an extended discrete modal decomposition, J. Manuf. Process., 90 (2023), 367–390. https://doi.org/10.1016/j.jmapro.2023.02.005 doi: 10.1016/j.jmapro.2023.02.005
|
| [27] |
B. C. Juricek, D. E. Seborg, W. E. Larimore, Fault detection using canonical variate analysis, Ind. Eng. Chem. Res., 43 (2004), 458–474. https://doi.org/10.1021/ie0301684 doi: 10.1021/ie0301684
|
| [28] |
P. E. P. Odiowei, Y. Cao, Nonlinear dynamic process monitoring using canonical variate analysis and kernel density estimations, IEEE Trans. Ind. Inf., 6 (2010), 36–45. https://doi.org/10.1109/TⅡ.2009.2032654. doi: 10.1109/TII.2009.2032654
|
| [29] |
M. Fuentes-García, G. Maciá-Fernández, J. Camacho, Evaluation of diagnosis methods in PCA-based multivariate statistical process control, Chemom. Intell. Lab. Syst., 172 (2018), 194–210. https://doi.org/10.1016/j.chemolab.2017.12.008 doi: 10.1016/j.chemolab.2017.12.008
|
| [30] |
P. Duan, F. Yang, T. Chen, S. L. Shah, Direct causality detection via the transfer entropy approach, IEEE Trans. Control Syst. Technol., 21 (2013), 2052–2066. https://doi.org/10.1109/TCST.2012.2233476 doi: 10.1109/TCST.2012.2233476
|
| [31] |
B. Jiang, D. Huang, X. Zhu, Canonical variate analysis-based contributions for fault identification, J. Process Control, 26 (2015), 17–25. https://doi.org/10.1016/j.jprocont.2014.12.001 doi: 10.1016/j.jprocont.2014.12.001
|
| [32] |
M. Kano, S. Hasebe, I. Hashimoto, H. Ohno, Process monitoring based on dissimilarity of time series data, Kagaku Kogaku Ronbunshu, 25 (1999), 1004–1009. https://doi.org/10.1252/kakoronbunshu.25.1004 doi: 10.1252/kakoronbunshu.25.1004
|
| [33] |
R. Silini, C. Masoller, Fast and effective pseudo transfer entropy for bivariate data-driven causal inference, Sci. Rep., 11 (2021), 1–13. https://doi.org/10.1038/s41598-021-87818-3 doi: 10.1038/s41598-020-79139-8
|
| [34] |
C. Yuan, P. Yuan, J. Li, Y. Dong, P. Li, The study on the relationship between the cut tobacco drier equipment parameters and the tobacco leaf silk quality, Stat. Appl., 4 (2015), 176–186. https://doi.org/10.12677/SA.2015.43020 doi: 10.12677/SA.2015.43020
|
| [35] |
J. Zheng, C. Zhao, Online monitoring of performance variations and process dynamic anomalies with performance-relevant full decomposition of slow feature analysis, J. Process Control, 80 (2019), 89–102. https://doi.org/10.1016/j.jprocont.2019.05.004 doi: 10.1016/j.jprocont.2019.05.004
|


Figures(8) / Tables(4)

Linchao Yang, Ying Liu, Guanglu Yang, Shi-Tong Peng. Dynamic monitoring and anomaly tracing of the quality in tobacco strip processing based on improved canonical variable analysis and transfer entropy[J]. Mathematical Biosciences and Engineering, 2023, 20(8): 15309-15325. doi: 10.3934/mbe.2023684


 DownLoad: