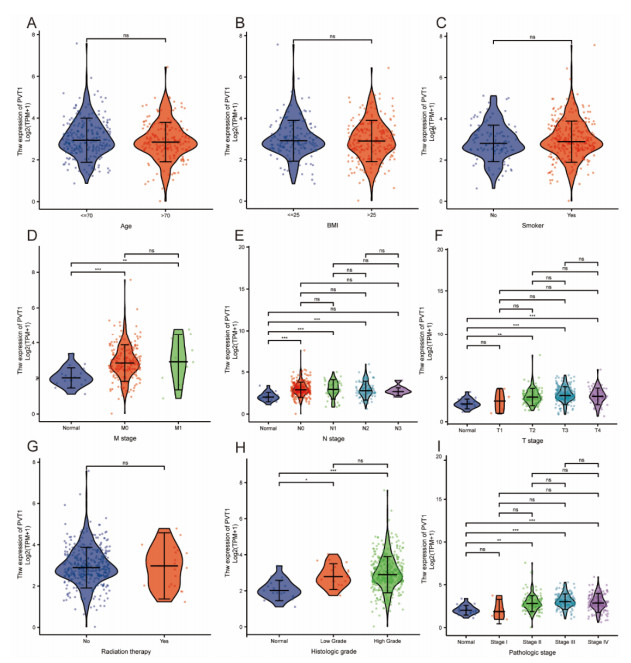
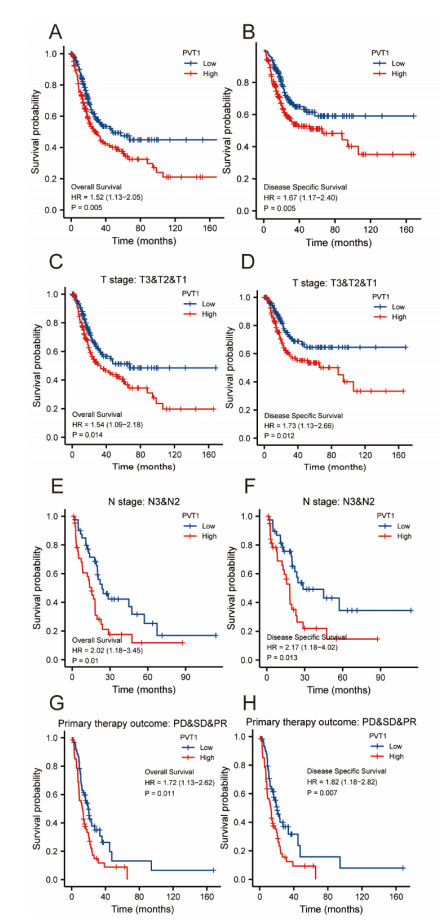
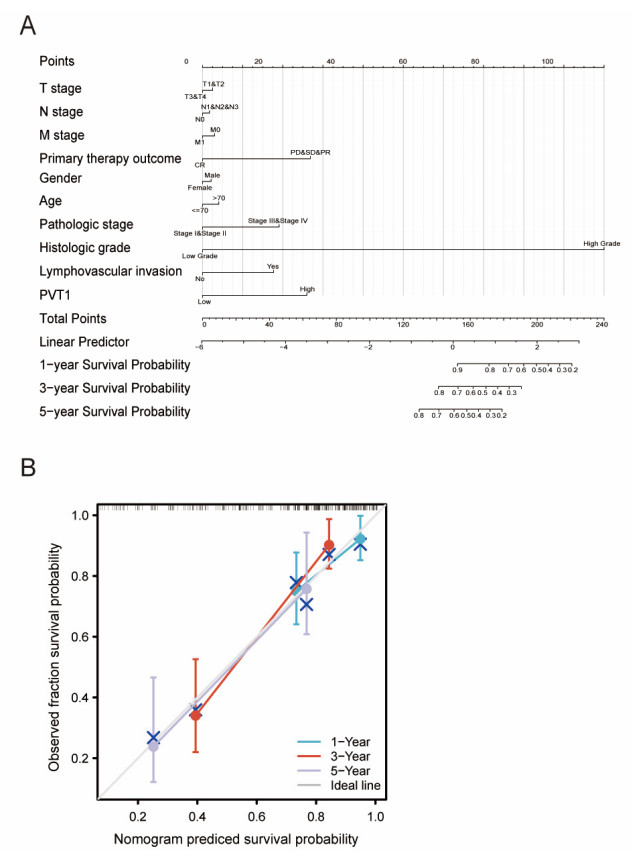
Plasmacytoma variant translocation 1 (PVT1) is involved in multiple signaling pathways and plays an important regulatory role in a variety of malignant tumors. However, its role in the prognosis and immune invasion of bladder urothelial carcinoma (BLCA) remains unclear. This study investigated the expression of PVT1 in tumor tissue and its relationship with immune invasion, and determined its prognostic role in patients with BLCA. Patients were identified from the cancer genome atlas (TCGA). The enrichment pathway and function of PVT1 were explained by gene ontology (GO) term analysis, gene set enrichment analysis (GSEA) and single-sample gene set enrichment analysis (ssGSEA), and the degree of immune cell infiltration was quantified. Kaplan–Meier analysis and Cox regression were used to analyze the correlation between PVT1 and survival rate. PVT1-high BLCA patients had a lower 10-year disease-specific survival (DSS P < 0.05) and overall survival (OS P < 0.05). Multivariate Cox regression analysis showed that PVT1 (high vs. low) (P = 0.004) was an independent prognostic factor. A nomogram was used to predict the effect of PVT1 on the prognosis. PVT1 plays an important role in the progression and prognosis of BLCA and can be used as a medium biomarker to predict survival after cystectomy.
Citation: Peiyuan Li, Gangjie Qiao, Jian Lu, Wenbin Ji, Chao Gao, Feng Qi. PVT1 is a prognostic marker associated with immune invasion of bladder urothelial carcinoma[J]. Mathematical Biosciences and Engineering, 2022, 19(1): 169-190. doi: 10.3934/mbe.2022009
Plasmacytoma variant translocation 1 (PVT1) is involved in multiple signaling pathways and plays an important regulatory role in a variety of malignant tumors. However, its role in the prognosis and immune invasion of bladder urothelial carcinoma (BLCA) remains unclear. This study investigated the expression of PVT1 in tumor tissue and its relationship with immune invasion, and determined its prognostic role in patients with BLCA. Patients were identified from the cancer genome atlas (TCGA). The enrichment pathway and function of PVT1 were explained by gene ontology (GO) term analysis, gene set enrichment analysis (GSEA) and single-sample gene set enrichment analysis (ssGSEA), and the degree of immune cell infiltration was quantified. Kaplan–Meier analysis and Cox regression were used to analyze the correlation between PVT1 and survival rate. PVT1-high BLCA patients had a lower 10-year disease-specific survival (DSS P < 0.05) and overall survival (OS P < 0.05). Multivariate Cox regression analysis showed that PVT1 (high vs. low) (P = 0.004) was an independent prognostic factor. A nomogram was used to predict the effect of PVT1 on the prognosis. PVT1 plays an important role in the progression and prognosis of BLCA and can be used as a medium biomarker to predict survival after cystectomy.

| [1] | L. A. Torre, F. Bray, R. L. Siegel, J. Ferlay, J. Lortet-Tieulent, A. Jemal, Global cancer statistics, 2012, CA Cancer J. Clin., 65 (2015), 87-108. doi: 10.3322/caac.21262. |
| [2] |
W. J. Kim, S. C. Bae, Molecular biomarkers in urothelial bladder cancer, Cancer Sci., 99 (2008), 646-652. doi: 10.1111/j.1349-7006.2008.00735.x. doi: 10.1111/j.1349-7006.2008.00735.x

|
| [3] | R. L. Siegel, K. D. Miller, A. Jemal, Cancer statistics, 2016, CA Cancer J. Clin., 66 (2016), 7-30. doi: 10.3322/caac.21332. |
| [4] | D. Tolomeo, A. Agostini, G. Visci, D. Traversa, C. T. Storlazzi, PVT1: A long non-coding RNA recurrently involved in neoplasia-associated fusion transcripts, Gene, 779 (2021), 145497. doi: 10.1016/j.gene.2021.145497. |
| [5] | Y. Y. Tseng, B. S. Moriarity, W. Gong, R. Akiyama, A. Tiwari, H. Kawakami, et al., PVT1 dependence in cancer with MYC copy-number increase, Nature, 512 (2014), 82-86. doi: 10.1038/nature13311. |
| [6] | Y. Kikuchi, S. Tokita, T. Hirama, V. Kochin, M. Nakatsugawa, T. Shinkawa, et al., CD8+ T-cell immune surveillance against a tumor antigen encoded by the oncogenic long non-coding RNA, PVT1, Cancer Immunol. Res., 9 (2021), 1342-1353. doi: 10.1158/2326-6066.CIR-20-0964. |
| [7] | E. Tesfaye, E. Martinez-Terroba, J. Bendor, L. Winkler, C. Olivero, K. Chen, et al., The p53 transcriptional response across tumor types reveals core and senescence-specific signatures modulated by long noncoding RNAs, Proc. Natl. Acad. Sci. USA, 118 (2021). doi: 10.1073/pnas.2025539118. |
| [8] | K. Shigeyasu, S. Toden, T. Ozawa, T. Matsuyama, T. Nagasaka, T. Ishikawa, et al., The PVT1 lncRNA is a novel epigenetic enhancer of MYC, and a promising risk-stratification biomarker in colorectal cancer, Mol. Cancer, 19 (2020), 155. doi: 10.1186/s12943-020-01277-4. |
| [9] |
Z. Liu, H. Zhang, LncRNA plasmacytoma variant translocation 1 is an oncogene in bladder urothelial carcinoma, Mol. Cancer, 8 (2017), 64273-64282. doi: 10.18632/oncotarget.19604. doi: 10.18632/oncotarget.19604
|
| [10] |
Y. Wang, J. Zhou, Z. Wang, P. Wang, S. Li, Upregulation of SOX2 activated LncRNA PVT1 expression promotes breast cancer cell growth and invasion, Biochem. Bioph. Res. Commun., 493 (2017), 429-436. doi: 10.1016/j.bbrc.2017.09.005. doi: 10.1016/j.bbrc.2017.09.005
|
| [11] | M. Iden, S. Fye, K. Li, T. Chowdhury, R. Ramchandran, J. S. Rader, The lncRNA PVT1 contributes to the cervical cancer phenotype and associates with poor patient prognosis, PLoS One, 11 (2016), e0156274. doi: 10.1371/journal.pone.0156274. |
| [12] | X. Yu, J. Zhao, Y. He, Long non-coding RNA PVT1 functions as an oncogene in human colon cancer through miR-30d-5p/RUNX2 axis, J BUON, 23 (2018), 48-54. |
| [13] | Y. R. Yang, S. Z. Zang, C. L. Zhong, Y. X. Li, S. S. Zhao, X. J. Feng, Increased expression of the lncRNA PVT1 promotes tumorigenesis in non-small cell lung cancer, Int. J. Clin. Exp. Pathol, 7 (2014), 6929-6935. |
| [14] | Y. Wu, W. Gu, X. Han, Z. Jin, LncRNA PVT1 promotes the progression of ovarian cancer by activating TGF-beta pathway via miR-148a-3p/AGO1 axis, J. Cell Mol. Med., (2021). doi: 10.1111/jcmm.16700. |
| [15] |
J. Yang, C. Li, A. Mudd, X. Gu, LncRNA PVT1 predicts prognosis and regulates tumor growth in prostate cancer, Biosci. Biotech. Bioch., 81 (2017), 2301-2306. doi: 10.1080/09168451.2017.1387048. doi: 10.1080/09168451.2017.1387048
|
| [16] | M. Izadifard, H. Pashaiefar, M. Yaghmaie, M. Montazeri, M. Sadraie, M. Momeny, et al., Expression analysis of PVT1, CCDC26, and CCAT1 long noncoding RNAs in acute myeloid leukemia patients, Genet. Test. Mol. Bioma., 22 (2018), 593-598. doi: 10.1089/gtmb.2018.0143. |
| [17] | A. Abbate, D. Tolomeo, I. Cifola, M. Severgnini, A. Turchiano, B. Augello, et al., MYC-containing amplicons in acute myeloid leukemia: genomic structures, evolution, and transcriptional consequences, Leukemia, 32 (2018), 2152-2166. doi: 10.1038/s41375-018-0033-0. |
| [18] |
N. Yazdi, M. Houshmand, A. Atashi, A. Kazemi, A. A. Najmedini, M. N. Zarif, Long noncoding RNA PVT1: potential oncogene in the development of acute lymphoblastic leukemia, Turk. J. Biol., 42 (2018), 405-413. doi: 10.3906/biy-1801-46. doi: 10.3906/biy-1801-46
|
| [19] | H. Handa, K. Honma, T. Oda, N. Kobayashi, Y. Kuroda, K. Kimura-Masuda, et al., Long Noncoding RNA PVT1 Is Regulated by Bromodomain Protein BRD4 in Multiple Myeloma and Is Associated with Disease Progression, Int. J. Mol. Sci., 21 (2020). doi: 10.3390/ijms21197121. |
| [20] | A. C. Panda, I. Grammatikakis, K. M. Kim, S. De, J. L. Martindale, R. Munk, et al., Identification of senescence-associated circular RNAs (SAC-RNAs) reveals senescence suppressor CircPVT1, Nucleic Acids Res., 45 (2017), 4021-4035. doi: 10.1093/nar/gkw1201. |
| [21] | L. Wan, M. Sun, G. J. Liu, C. C. Wei, E. B. Zhang, R. Kong, et al., Long noncoding RNA PVT1 promotes non-small cell lung cancer cell proliferation through epigenetically regulating lats2 expression, Mol. Cancer Ther., 15 (2016), 1082-1094. doi: 10.1158/1535-7163.MCT-15-0707. |
| [22] | C. Zeng, X. Yu, J. Lai, L. Yang, S. Chen, Y. Li, Overexpression of the long non-coding RNA PVT1 is correlated with leukemic cell proliferation in acute promyelocytic leukemia, J. Hematol. Oncol., 8 (2015), 126. doi: 10.1186/s13045-015-0223-4. |
| [23] |
D. Guo, Y. Wang, K. Ren, X. Han, Knockdown of LncRNA PVT1 inhibits tumorigenesis in non-small-cell lung cancer by regulating miR-497 expression, Exp. Cell Res., 362 (2018), 172-179. doi: 10.1016/j.yexcr.2017.11.014. doi: 10.1016/j.yexcr.2017.11.014
|
| [24] | G. Ping, W. Xiong, L. Zhang, Y. Li, Y. Zhang, Y. Zhao, Silencing long noncoding RNA PVT1 inhibits tumorigenesis and cisplatin resistance of colorectal cancer, Am. J. Transl. Res., 10 (2018), 138-149. |
| [25] | X. Z. Wu, H. P. Cui, H. J. Lv, L. Feng, Knockdown of lncRNA PVT1 inhibits retinoblastoma progression by sponging miR-488-3p, Biomed. Pharmacother., 112 (2019), 108627. doi: 10.1016/j.biopha.2019.108627. |
| [26] | Y. Cai, J. Wan, Competing endogenous RNA regulations in neurodegenerative disorders: current challenges and emerging insights, Front. Mol. Neurosci., 11 (2018), 370. doi: 10.3389/fnmol.2018.00370. |
| [27] |
X. Qi, D. H. Zhang, N. Wu, J. H. Xiao, X. Wang, W. Ma, ceRNA in cancer: possible functions and clinical implications, J. Med. Genet., 52 (2015), 710-718. doi: 10.1136/jmedgenet-2015-103334. doi: 10.1136/jmedgenet-2015-103334
|
| [28] | M. Chen, R. Zhang, L. Lu, J. Du, C. Chen, K. Ding, et al., LncRNA PVT1 accelerates malignant phenotypes of bladder cancer cells by modulating miR-194-5p/BCLAF1 axis as a ceRNA, Aging (Albany NY), 12 (2020), 22291-22312. doi: 10.18632/aging.202203. |
| [29] | C. Yu, L. Liu, W. Long, Z. Feng, J. Chen, L. Chao, et al., LncRNA PVT1 regulates VEGFC through inhibiting miR-128 in bladder cancer cells, J. Cell Physiol., 234 (2019), 1346-1353. doi: 10.1002/jcp.26929. |
| [30] |
V. Karantza, Keratins in health and cancer: more than mere epithelial cell markers, Oncogene, 30 (2011), 127-138. doi: 10.1038/onc.2010.456. doi: 10.1038/onc.2010.456
|
| [31] | P. A. Coulombe, M. B. O mary, 'Hard' and 'soft' principles defining the structure, function and regulation of keratin intermediate filaments, Curr. Opin. Cell Biol., 14 (2002), 110-122. |
| [32] |
R. Moll, M. Divo, L. Langbein, The human keratins: biology and pathology, Histochem. Cell Biol., 129 (2008), 705-733. doi: 10.1007/s00418-008-0435-6. doi: 10.1007/s00418-008-0435-6
|
| [33] |
J. I. Epstein, An update of the Gleason grading system, J. Urol., 183 (2010), 433-440. doi: 10.1016/j.juro.2009.10.046. doi: 10.1016/j.juro.2009.10.046
|
| [34] | S. Liu, R. M. Cadaneanu, B. Zhang, L. Huo, K. Lai, X. Li, et al., Keratin 13 Is Enriched in Prostate Tubule-Initiating Cells and May Identify Primary Prostate Tumors that Metastasize to the Bone, PLoS One, 11 (2016), e0163232. doi: 10.1371/journal.pone.0163232. |
| [35] | S. Bundela, A. Sharma, P. S. Bisen, Potential therapeutic targets for oral cancer: ADM, TP53, EGFR, LYN, CTLA4, SKIL, CTGF, CD70, PLoS One, 9 (2014), e102610. doi: 10.1371/journal.pone.0102610. |
| [36] | J. A. Sharp, S. L. Mailer, P. C. Thomson, C. Lefevre, K. R. Nicholas, Identification and transcript analysis of a novel wallaby (Macropus eugenii) basal-like breast cancer cell line, Mol. Cancer, 7 (2008), 1. doi: 10.1186/1476-4598-7-1. |
| [37] | L. Lima, M. Neves, M. I. Oliveira, L. Dieguez, R. Freitas, R. Azevedo, et al., Sialyl-Tn identifies muscle-invasive bladder cancer basal and luminal subtypes facing decreased survival, being expressed by circulating tumor cells and metastases, Urol. Oncol., 35 (2017), 675 e1-675 e8. doi: 10.1016/j.urolonc.2017.08.012. |
| [38] | M. Eckstein, R. M. Wirtz, M. Gross-Weege, J. Breyer, W. Otto, R. Stoehr, et al., mRNA-expression of KRT5 and KRT20 defines distinct prognostic subgroups of muscle-invasive urothelial bladder cancer correlating with histological variants, Int. J. Mol. Sci., 19 (2018). doi: 10.3390/ijms19113396. |
| [39] | S. W. Cho, J. Xu, R. Sun, M. R. Mumbach, A. C. Carter, Y. G. Chen, et al., Promoter of lncRNA Gene PVT1 Is a Tumor-Suppressor DNA Boundary Element, Cell, 173 (2018), 1398-1412. doi: 10.1016/j.cell.2018.03.068. |
| [40] |
Y. Wang, C. E. Kaiser, B. Frett, H. Y. Li, Targeting mutant KRAS for anticancer therapeutics: a review of novel small molecule modulators, J. Med. Chem., 56 (2013), 5219-5230. doi: 10.1021/jm3017706. doi: 10.1021/jm3017706
|
| [41] |
S. A. Kerk, T. Papagiannakopoulos, Y. M. Shah, C. A. Lyssiotis, Metabolic networks in mutant KRAS-driven tumours: tissue specificities and the microenvironment, Nat. Rev. Cancer, 21 (2021), 510-525. doi: 10.1038/s41568-021-00375-9. doi: 10.1038/s41568-021-00375-9
|
| [42] | J. Huang, Current developments of targeting the p53 signaling pathway for cancer treatment, Pharmacol. Ther., 220 (2021), 107720. doi: 10.1016/j.pharmthera.2020.107720. |
| [43] | A. Kamoun, A. de Reynies, Y. Allory, G. Sjodahl, A. G. Robertson, R. Seiler, et al., A consensus molecular classification of muscle-invasive bladder cancer, Eur. Urol., 77 (2020), 420-433. doi: 10.1016/j.eururo.2019.09.006. |
| [44] | M. Fraga, M. Yanez, M. Sherman, F. Llerena, M. Hernandez, G. Nourdin, et al., Immunomodulation of t helper cells by tumor microenvironment in oral cancer is associated with ccr8 expression and rapid membrane vitamin d signaling pathway, Front. Immunol., 12 (2021), 643298. doi: 10.3389/fimmu.2021.643298. |
| [45] | K. D. da Silva, P. C. Caldeira, A. M. Alves, A. C. U. Vasconcelos, A. P. N. Gomes, M. C. F. de Aguiar, et al., High CD3(+) lymphocytes, low CD66b(+) neutrophils, and scarce tumor budding in the invasive front of lip squamous cell carcinomas, Arch. Oral. Biol., 104 (2019), 46-51. doi: 10.1016/j.archoralbio.2019.05.027. |
| [46] | O. Stasikowska-Kanicka, M. Wagrowska-Danilewicz, M. Danilewicz, Immunohistochemical analysis of foxp3(+), CD4(+), CD8(+) cell infiltrates and PD-L1 in oral squamous cell carcinoma, Pathol. Oncol. Res., 24 (2018), 497-505. doi: 10.1007/s12253-017-0270-y. |
| [47] | Y. Wei, B. Han, W. Dai, S. Guo, C. Zhang, L. Zhao, et al., Exposure to ozone impacted Th1/Th2 imbalance of CD(4+) T cells and apoptosis of ASMCs underlying asthmatic progression by activating lncRNA PVT1-miR-15a-5p/miR-29c-3p signaling, Aging (Albany NY), 12 (2020), 25229-25255. doi: 10.18632/aging.104124. |
| [48] |
O. Demaria, E. Vivier, Immuno-oncology beyond TILs: Unleashing TILCs, Cancer Cell, 37 (2020), 428-430. doi: 10.1016/j.ccell.2020.03.021. doi: 10.1016/j.ccell.2020.03.021
|
| [49] | J. Fu, H. Shi, B. Wang, T. Zhan, Y. Shao, L. Ye, et al., LncRNA PVT1 links Myc to glycolytic metabolism upon CD4(+) T cell activation and Sjogren's syndrome-like autoimmune response, J. Autoimmun., 107 (2020), 102358. doi: 10.1016/j.jaut.2019.102358. |
| [50] | J. Vivian, A. A. Rao, F. A. Nothaft, C. Ketchum, J. Armstrong, A. Novak, et al., Toil enables reproducible, open source, big biomedical data analyses, Nat. Biotechnol., 35 (2017), 314-316. doi: 10.1038/nbt.3772. |
| [51] | S. Hanzelmann, R. Castelo, J. Guinney, GSVA: gene set variation analysis for microarray and RNA-seq data, BMC Bioinformatics, 14 (2013), 7. doi: 10.1186/1471-2105-14-7. |
| [52] | G. Bindea, B. Mlecnik, M. Tosolini, A. Kirilovsky, M. Waldner, A. C. Obenauf, et al., Spatiotemporal dynamics of intratumoral immune cells reveal the immune landscape in human cancer, Immunity, 39 (2013), 782-795. doi: 10.1016/j.immuni.2013.10.003. |
| [53] | J. Liu, T. Lichtenberg, K. A. Hoadley, L. M. Poisson, A. J. Lazar, A. D. Cherniack, et al., An integrated TCGA pan-cancer clinical data resource to drive high-quality survival outcome analytics, Cell, 173 (2018), 400-416. doi: 10.1016/j.cell.2018.02.052. |
Figures(7) / Tables(3)

Peiyuan Li, Gangjie Qiao, Jian Lu, Wenbin Ji, Chao Gao, Feng Qi. PVT1 is a prognostic marker associated with immune invasion of bladder urothelial carcinoma[J]. Mathematical Biosciences and Engineering, 2022, 19(1): 169-190. doi: 10.3934/mbe.2022009


 DownLoad: