Citation: Dongfu Tong, Yongli Cai, Bingxian Wang, Weiming Wang. Bifurcation structure of nonconstant positive steady states for a diffusive predator-prey model[J]. Mathematical Biosciences and Engineering, 2019, 16(5): 3988-4006. doi: 10.3934/mbe.2019197

| [1] | J. Jang, W.-M. Ni and M. Tang, Global bifurcation and structure of Turing patterns in the 1-D Lengyel-Epstein model, J. Dyn. Diff. Equa., 2 (2004), 297–320. |
| [2] | A. M. Turing, The chemical basis of morphogenesis, Philos. T. R. SOC. B, 237 (1852), 37–72. |
| [3] | N. F. Britton, Essential Mathematical Biology, Springer, New York, 2003. |
| [4] | L. A. Segel and J. L. Jackson, Dissipative structure: an explanation and an ecological example, J. Theor. Biol., 37 (1972), 545–559. |
| [5] | D. Alonso, F. Bartumeus and J. Catalan, Mutual interference between predators can give rise to Turing spatial patterns, Ecology, 83 (2002), 28–34. |
| [6] | W.-M. Wang, L. Zhang, H. Wang, et al., Pattern formation of a predator-prey system with Ivlev-type functional response, Ecol. Model., 221 (2008), 131–140. |
| [7] | C. Neuhauser, Mathematical challenges in spatial ecology, Notices AMS, 48 (2001), 1304–1314. |
| [8] | A. Okubo and S. A. Levin, Diffusion and Ecological Problems: Modern Perspectives, Springer, New York, 2001. |
| [9] | A. B. Medvinsky, S. V. Petrovskii, I. A. Tikhonova, et al., Spatiotemporal complexity of plankton and fish dynamics. SIAM Rev., 44 (2002), 311–370. |
| [10] | J. D. Murray, Mathematical biology. II: Spatial models and biomedical applications, Springer, New York, 2003. |
| [11] | P. Y. H. Pang and M. Wang, Qualitative analysis of a ratio-dependent predator-prey system with diffusion, Proc. R. Soc. Edinb., 133 (2003), 919–942. |
| [12] | K. Kuto and Y. Yamada. Multiple coexistence states for a prey-predator system with crossdi ffusion, J. Differ. Equations, 197 (2004), 315–348. |
| [13] | K. Kuto, Stability of steady-state solutions to a prey-predator system with cross-diffusion, J. Differ. Equations, 197 (2004), 293–314. |
| [14] | X. Zeng and Z. Liu, Non-constant positive steady states of a prey-predator system with cross-diffusions, J. Math. Anal. Appl., 332 (2007), 989–1009. |
| [15] | R. Peng and J. Shi, Non-existence of non-constant positive steady states of two Holling type-II predator-prey systems: Strong interaction case, J. Differ. Equations, 247 (2009), 866–886. |
| [16] | F. Yi, J. Wei and J. Shi, Bifurcation and spatiotemporal patterns in a homogeneous diffusive predator-prey system, J. Differ. Equations, 246 (2009), 1944–1977. |
| [17] | H. Shi,W.-T. Li and G. Lin. Positive steady states of a diffusive predator-prey system with modified Holling-Tanner functional response, Nonl. Anal. Real, 11 (2010), 3711–3721. |
| [18] | Y. Cai, M. Banerjee, Y. Kang, et al., Spatiotemporal complexity in a predator-prey model with weak Allee effects, Math. Biosci. Eng., 11 (2014), 1247–1274. |
| [19] | S. Li, J. Wu and Y. Dong, Turing patterns in a reaction-diffusion model with the Degn-Harrison reaction scheme, J. Differ. Equations, 259 (2015), 1990–2029. |
| [20] | H. Shi and S. Ruan. Spatial, temporal and spatiotemporal patterns of diffusive predator-prey models with mutual interference, IMA J. Appl. Math., 80 (2015), 1534–1568. |
| [21] | Y. Cai and W.-M. Wang, Fish-hook bifurcation branch in a spatial heterogeneous epidemic model with cross-diffusion, Nonl. Anal. Real, 30 (2016), 99–125. |
| [22] | T. Kuniya and J.Wang, Global dynamics of an SIR epidemic model with nonlocal diffusion, Nonl. Anal. Real, 43 (2018), 262–282. |
| [23] | J.Wang, J.Wang and T. Kuniya, Analysis of an age-structured multi-group heroin epidemic model.Appl. Math. Comp., 347 (2019), 78–100. |
| [24] | Y. Cai, Z. Ding, B. Yang, et al., Transmission dynamics of Zika virus with spatial structure–A case study in Rio de Janeiro, Brazil. Phys. A, 514 (2019), 729–740. |
| [25] | Y. Cai, K. Wang and W.M. Wang, Global transmission dynamics of a Zika virus model, Appl. Math. Lett., 92 (2019), 190–195. |
| [26] | Y. Cai, X. Lian, Z. Peng, et al., Spatiotemporal transmission dynamics for influenza disease in a heterogenous environment, Nonl. Anal. Real., 46 (2019), 178–194. |
| [27] | Y. Cai, Z. Gui, X. Zhang, et al., Bifurcations and pattern formation in a predator-prey model,. Inter. J. Bifur. Chaos, 28 (2018), 1850140. |
| [28] | H. Zhang, Y. Cai, S. Fu, et al., Impact of the fear effect in a prey-predator model incorporating a prey refuge, Appl. Math. Comp., 356 (2019), 328–337. |
| [29] | X. Cao, Y. Song and T. Zhang. Hopf bifurcation and delay-induced Turing instability in a diffusive Iac Operon model, Inter. J. Bifur. Chaos, 26 (2016), 1650167. |
| [30] | J. Jiang, Y. Song and P. Yu, Delay-induced Triple-Zero bifurcation in a delayed Leslie-type predator-prey model with additive Allee effect, Inter. J. Bifur. Chaos, 26 (2016), 1650117. |
| [31] | Y. Song, H. Jiang, Q. Liu, et al., Spatiotemporal dynamics of the diffusive Mussel-Algae model near Turing-Hopf bifurcation. SIAM J. Appl. Dyn. Sys., 16 (2017), 2030–2062. |
| [32] | Y. Song and X. Tang, Stability, steady-state bifurcations, and Turing patterns in a predator-prey model with herd behavior and prey-taxis, Stud. Appl. Math., 139 (2017), 371–404. |
| [33] | S. Wu and Y. Song, Stability and spatiotemporal dynamics in a diffusive predator Cprey model with nonlocal prey competition, Nonl. Anal. Real, 48 (2019), 12–39. |
| [34] | S.-B. Hsu and T.-W. Huang, Global stability for a class of predator-prey systems, SIAM J. Appl. Math., 55 (1995), 763–783. |
| [35] | Y. Lou and W.-M. Ni. Diffusion, self-diffusion and cross-diffusion, J. Differ. Equations, 131 (1996), 79–131. |
| [36] | W.-M. Ni and M. Tang, Turing patterns in the Lengyel-Epstein system for the CIMA reaction, T. Am. Math. Soc., 357 (2005), 3953–3969. |
| [37] | P. H. Rabinowitz, Some global results for nonlinear eigenvalue problems, J. Func. Anal., 7 (1971), 487–513. |
| [38] | Y. Nishiura, Global structure of bifurcating solutions of some reaction-diffusion systems, SIAM J. Math. Anal., 13 (1982), 555–593. |
| [39] | I. Takagi, Point-condensation for a reaction-diffusion system, J. Differ. Equations, 61 (1986), 208–249. |
| [40] | A.Chertock, A. Kurganov, X. Wang, et al., On a chemotaxis model with saturated chemotactic flux, Kinet. Relat. Models, 5 (2012), 51–95. |
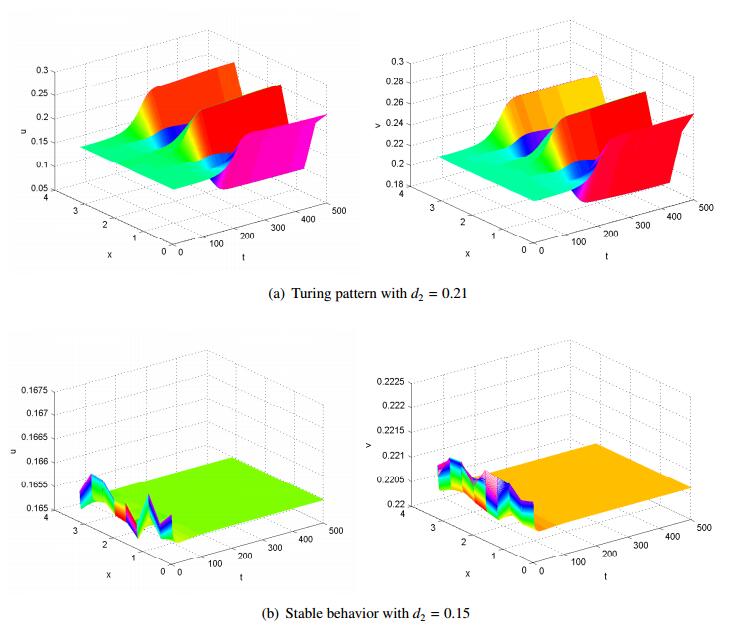
Figures(1)

Dongfu Tong, Yongli Cai, Bingxian Wang, Weiming Wang. Bifurcation structure of nonconstant positive steady states for a diffusive predator-prey model[J]. Mathematical Biosciences and Engineering, 2019, 16(5): 3988-4006. doi: 10.3934/mbe.2019197


 DownLoad: