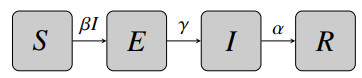
Identifiability of a mathematical model plays a crucial role in the parameterization of the model. In this study, we established the structural identifiability of a susceptible-exposed-infected-recovered (SEIR) model given different combinations of input data and investigated practical identifiability with respect to different observable data, data frequency, and noise distributions. The practical identifiability was explored by both Monte Carlo simulations and a correlation matrix approach. Our results showed that practical identifiability benefits from higher data frequency and data from the peak of an outbreak. The incidence data gave the best practical identifiability results compared to prevalence and cumulative data. In addition, we compared and distinguished the practical identifiability by Monte Carlo simulations and a correlation matrix approach, providing insights into when to use which method for other applications.
Citation: Omar Saucedo, Amanda Laubmeier, Tingting Tang, Benjamin Levy, Lale Asik, Tim Pollington, Olivia Prosper Feldman. Comparative analysis of practical identifiability methods for an SEIR model[J]. AIMS Mathematics, 2024, 9(9): 24722-24761. doi: 10.3934/math.20241204
Identifiability of a mathematical model plays a crucial role in the parameterization of the model. In this study, we established the structural identifiability of a susceptible-exposed-infected-recovered (SEIR) model given different combinations of input data and investigated practical identifiability with respect to different observable data, data frequency, and noise distributions. The practical identifiability was explored by both Monte Carlo simulations and a correlation matrix approach. Our results showed that practical identifiability benefits from higher data frequency and data from the peak of an outbreak. The incidence data gave the best practical identifiability results compared to prevalence and cumulative data. In addition, we compared and distinguished the practical identifiability by Monte Carlo simulations and a correlation matrix approach, providing insights into when to use which method for other applications.

| [1] |
M. Y. Li, H. L. Smith, L. Wang, Global dynamics of an SEIR epidemic model with vertical transmission, SIAM J. Appl. Math., 62 (2001), 58–69. https://doi.org/10.1137/S0036139999359860 doi: 10.1137/S0036139999359860

|
| [2] |
S. Gao, Y. Liu, J. J. Nieto, H. Andrade, Seasonality and mixed vaccination strategy in an epidemic model with vertical transmission, Math. Comput. Simul., 81 (2011), 1855–1868. https://doi.org/10.1016/j.matcom.2010.10.032 doi: 10.1016/j.matcom.2010.10.032
|
| [3] |
A. d'Onofrio, Stability properties of pulse vaccination strategy in SEIR epidemic model, Math. Biosci., 179 (2002), 57–72. https://doi.org/10.1016/S0025-5564(02)00095-0 doi: 10.1016/S0025-5564(02)00095-0
|
| [4] |
P. Yan, S. Liu, Seir epidemic model with delay, ANZIAM J., 48 (2006), 119–134. https://doi.org/10.1017/S144618110000345X doi: 10.1017/S144618110000345X
|
| [5] |
G. Li, Z. Jin, Global stability of a SEIR epidemic model with infectious force in latent, infected and immune period, Chaos Solitons Fract., 25 (2005), 1177–1184. https://doi.org/10.1016/j.chaos.2004.11.062 doi: 10.1016/j.chaos.2004.11.062
|
| [6] |
J. Liu, Bifurcation analysis for a delayed SEIR epidemic model with saturated incidence and saturated treatment function, J. Biol. Dynam., 13 (2019), 461–480. https://doi.org/10.1080/17513758.2019.1631965 doi: 10.1080/17513758.2019.1631965
|
| [7] |
R. Engbert, M. M. Rabe, R. Kliegl, S. Reich, Sequential data assimilation of the stochastic SEIR epidemic model for regional COVID-19 dynamics, Bull. Math. Biol., 83 (2021), 1. https://doi.org/10.1007/s11538-020-00834-8 doi: 10.1007/s11538-020-00834-8
|
| [8] |
D. Efimov, R. Ushirobira, On an interval prediction of COVID-19 development based on a SEIR epidemic model, Ann. Rev. Control, 51 (2021), 477–487. https://doi.org/10.1016/j.arcontrol.2021.01.006 doi: 10.1016/j.arcontrol.2021.01.006
|
| [9] |
N. W. Ruktanonchai, J. Floyd, S. Lai, C. W. Ruktanonchai, A. Sadilek, P. Rente-Lourenco, et al., Assessing the impact of coordinated COVID-19 exit strategies across Europe, Science, 369 (2020), 1465–1470. https://doi.org/10.1126/science.abc5096 doi: 10.1126/science.abc5096
|
| [10] |
I. Borisov, E. Metelkin, Confidence intervals by constrained optimization-an algorithm and software package for practical identifiability analysis in systems biology, PLOS Comput. Biol., 16 (2020), e1008495. https://doi.org/10.1371/journal.pcbi.1008495 doi: 10.1371/journal.pcbi.1008495
|
| [11] |
R. Bellman, K. J. Åström, On structural identifiability, Math. Biosci., 7 (1970), 329–339. https://doi.org/10.1016/0025-5564(70)90132-X doi: 10.1016/0025-5564(70)90132-X
|
| [12] |
C. Cobelli, J. J. DiStefano 3rd, Parameter and structural identifiability concepts and ambiguities: a critical review and analysis, Amer. J. Physiol.-Reg. Integr. Compar. Physiol., 239 (1980), R7–R24. https://doi.org/10.1152/ajpregu.1980.239.1.R7 doi: 10.1152/ajpregu.1980.239.1.R7
|
| [13] | E. Walter, L. Pronzato, Identification of Parametric Models: From Experimental Data, Berlin: Springer Verlag, 1997. |
| [14] | A. Martynenko, A. Bück, Intelligent Control in Drying, New York: CRC Press, 2018. |
| [15] |
F. G. Wieland, A. L. Hauber, M. Rosenblatt, C. Tönsing, J. Timmer, On structural and practical identifiability, Current Opinion Syst. Biol, 25 (2021), 60–69. https://doi.org/10.1016/j.coisb.2021.03.005 doi: 10.1016/j.coisb.2021.03.005
|
| [16] |
H. Miao, X. Xia, A. S. Perelson, H. Wu, On identifiability of nonlinear ODE models and applications in viral dynamics, SIAM Rev., 53 (2011), 3–39. https://doi.org/10.1137/090757009 doi: 10.1137/090757009
|
| [17] |
N. Tuncer, T. T. Le, Structural and practical identifiability analysis of outbreak models, Math. Biosci., 299 (2018), 1–18. https://doi.org/10.1016/j.mbs.2018.02.004 doi: 10.1016/j.mbs.2018.02.004
|
| [18] |
M. Rodriguez-Fernandez, P. Mendes, J. R. Banga, A hybrid approach for efficient and robust parameter estimation in biochemical pathways, Biosystems, 83 (2006), 248–265. https://doi.org/10.1016/j.biosystems.2005.06.016 doi: 10.1016/j.biosystems.2005.06.016
|
| [19] |
M. Rodriguez-Fernandez, J. A. Egea, J. R. Banga, Novel metaheuristic for parameter estimation in nonlinear dynamic biological systems, BMC Bioinformatics, 7 (2006), 483. https://doi.org/10.1186/1471-2105-7-483 doi: 10.1186/1471-2105-7-483
|
| [20] | H. T. Banks, S. Hu, W. C. Thompson, Modeling and Inverse Problems in the Presence of Uncertainty. New York: CRC Press, 2014. |
| [21] |
D. Venzon, S. Moolgavkar, A method for computing profile‐likelihood‐based confidence intervals, J. Royal Stat. Soc.: Ser. C (Applied Statistics), 37 (1988), 87–94. https://doi.org/10.2307/2347496 doi: 10.2307/2347496
|
| [22] | J. A. Jacquez, T. Perry, Parameter estimation: local identifiability of parameters, Amer. J. Physiol.-Endocrinol. Metabol., 258 (1990), E727–E736. |
| [23] |
A. Raue, C. Kreutz, T. Maiwald, J. Bachmann, M. Schilling, U. Klingmüller, et al., Structural and practical identifiability analysis of partially observed dynamical models by exploiting the profile likelihood, Bioinformatics, 25 (2009), 1923–1929. https://doi.org/10.1093/bioinformatics/btp358 doi: 10.1093/bioinformatics/btp358
|
| [24] |
M. C. Eisenberg, M. A. Hayashi, Determining identifiable parameter combinations using subset profiling, Math. Biosci., 256 (2014), 116–126. https://doi.org/10.1016/j.mbs.2014.08.008 doi: 10.1016/j.mbs.2014.08.008
|
| [25] |
Y. H. Kao, M. C. Eisenberg, Practical unidentifiability of a simple vector-borne disease modeli: implications for parameter estimation and intervention assessment, Epidemics, 25 (2018), 89–100. https://doi.org/10.1016/j.epidem.2018.05.010 doi: 10.1016/j.epidem.2018.05.010
|
| [26] | S. Baron, Medical Microbiology, 4 Eds., Galveston (TX): University of Texas Medical Branch at Galveston, 1996. |
| [27] |
M. Lipsitch, T. Cohen, B. Cooper, J. M. Robins, S. Ma, L. James, et al., Transmission dynamics and control of severe acute respiratory syndrome, Science, 300 (2003), 1966–1970. https://doi.org/10.1126/science.1086616 doi: 10.1126/science.1086616
|
| [28] |
S. Riley, C. A. Donnelly, N. M. Ferguson, Robust parameter estimation techniques for stochastic within-host macroparasite models, J. Theoret. Biol., 225 (2003), 419–430. https://doi.org/10.1016/S0022-5193(03)00266-2 doi: 10.1016/S0022-5193(03)00266-2
|
| [29] |
C. Fraser, C. A. Donnelly, S. Cauchemez, W. P. Hanage, M. D. Van Kerkhove, T. D. Hollingsworth, et al., Pandemic potential of a strain of influenza A (H1N1): early findings, Science, 324 (2009), 1557–1561. https://doi.org/10.1126/science.1176062 doi: 10.1126/science.1176062
|
| [30] |
A. R. Tuite, J. Tien, M. Eisenberg, D. J. Earn, J. Ma, D. N. Fisman, Cholera epidemic in Haiti, 2010: using a transmission model to explain spatial spread of disease and identify optimal control interventions, Ann. Int. Medic., 154 (2011), 593–601. https://doi.org/10.7326/0003-4819-154-9-201105030-00334 doi: 10.7326/0003-4819-154-9-201105030-00334
|
| [31] |
G. Chowell, H. Nishiura, Transmission dynamics and control of Ebola virus disease (EVD): a review, BMC Med., 12 (2014), 196. https://doi.org/10.1186/s12916-014-0196-0 doi: 10.1186/s12916-014-0196-0
|
| [32] | D. Fisman, E. Khoo, A. Tuite, Early epidemic dynamics of the West African 2014 Ebola outbreak: estimates derived with a simple two-parameter model, PLoS Currents, 2014. https://doi.org/10.1371/2Fcurrents.outbreaks.89c0d3783f36958d96ebbae97348d571 |
| [33] | F. Brauer, P. Van den Driessche, J. Wu, L. J. Allen, Mathematical Epidemiology, Berlin: Springer, 2008. |
| [34] |
L. Denis-Vidal, G. Joly-Blanchard, C. Noiret, Some effective approaches to check the identifiability of uncontrolled nonlinear systems, Math. Comput. Simul., 57 (2001), 35–44. https://doi.org/10.1016/S0378-4754(01)00274-9 doi: 10.1016/S0378-4754(01)00274-9
|
| [35] | E. Walter, I. Braems, L. Jaulin, M. Kieffer, Guaranteed numerical computation as an alternative to computer algebra for testing models for identifiability, In: Numerical Software with Result Verification. Lecture Notes in Computer Science, Berlin: Springer, 2004. |
| [36] |
S. Vajda, K. R. Godfrey, H. Rabitz, Similarity transformation approach to identifiability analysis of nonlinear compartmental models, Math. Biosci., 93 (1989), 217–248. https://doi.org/10.1016/0025-5564(89)90024-2 doi: 10.1016/0025-5564(89)90024-2
|
| [37] |
N. D. Evans, M. J. Chapman, M. J. Chappell, K. R. Godfrey, Identifiability of uncontrolled nonlinear rational systems, Automatica, 38 (2002), 1799–1805. https://doi.org/10.1016/S0005-1098(02)00094-8 doi: 10.1016/S0005-1098(02)00094-8
|
| [38] |
J. W. Yates, N. D. Evans, M. J. Chappell, Structural identifiability analysis via symmetries of differential equations, Automatica, 45 (2009), 2585–2591. https://doi.org/10.1016/j.automatica.2009.07.009 doi: 10.1016/j.automatica.2009.07.009
|
| [39] |
H. Pohjanpalo, System identifiability based on the power series expansion of the solution, Math. Biosci., 41 (1978), 21–33. https://doi.org/10.1016/0025-5564(78)90063-9 doi: 10.1016/0025-5564(78)90063-9
|
| [40] |
G. Bellu, M. P. Saccomani, S. Audoly, L. D'Angiò, DAISY: a new software tool to test global identifiability of biological and physiological systems, Comput. Meth. Programs Biomed, 88 (2007), 52–61. https://doi.org/10.1016/j.cmpb.2007.07.002 doi: 10.1016/j.cmpb.2007.07.002
|
| [41] |
L. Ljung, T. Glad, On global identifiability for arbitrary model parametrizations, Automatica, 30 (1994), 265–276. https://doi.org/10.1016/0005-1098(94)90029-9 doi: 10.1016/0005-1098(94)90029-9
|
| [42] | E. Walter, Y. Lecourtier, Unidentifiable compartmental models: what to do? Math. Biosci., 56 (1981), 1–25. https://doi.org/10.1016/0025-5564(81)90025-0 |
| [43] |
X. Xia, C. H. Moog, Identifiability of nonlinear systems with application to HIV/AIDS models, IEEE Trans. Automat. Control, 48 (2003), 330–336. https://doi.org/10.1109/TAC.2002.808494 doi: 10.1109/TAC.2002.808494
|
| [44] |
A. F. Villaverde, A. Barreiro, A. Papachristodoulou, Structural identifiability of dynamic systems biology models, PLoS Comput. Biol., 12 (2016), e1005153. https://doi.org/10.1371/journal.pcbi.1005153 doi: 10.1371/journal.pcbi.1005153
|
| [45] | A. Sedoglavic, A probabilistic algorithm to test local algebraic observability in polynomial time, J. Symbol. Comput., 33 (2002), 735–755. |
| [46] |
M. Anguelova, J. Karlsson, M. Jirstrand, Minimal output sets for identifiability, Math. Biosci., 239 (2012), 139–153. https://doi.org/10.1016/j.mbs.2012.04.005 doi: 10.1016/j.mbs.2012.04.005
|
| [47] |
N. Meshkat, C. E. Kuo, J. DiStefano III, On finding and using identifiable parameter combinations in nonlinear dynamic systems biology models and COMBOS: a novel web implementation, PLoS One, 9 (2014), e110261. https://doi.org/10.1371/journal.pone.0110261 doi: 10.1371/journal.pone.0110261
|
| [48] |
A. Raue, B. Steiert, M. Schelker, C. Kreutz, T. Maiwald, H. Hass, et al., Data2dynamics: a modeling environment tailored to parameter estimation in dynamical systems, Bioinformatics, 31 (2015), 3558–3560. https://doi.org/10.1093/bioinformatics/btv405 doi: 10.1093/bioinformatics/btv405
|
| [49] |
T. S. Ligon, F. Fröhlich, O. T. Chiş, J. R. Banga, E. Balsa-Canto, J. Hasenauer, GenSSI 2.0: multi-experiment structural identifiability analysis of SBML models, Bioinformatics, 34 (2018), 1421–1423. https://doi.org/10.1093/bioinformatics/btx735 doi: 10.1093/bioinformatics/btx735
|
| [50] |
H. Hong, A. Ovchinnikov, G. Pogudin, C. Yap, SIAN: software for structural identifiability analysis of ODE models, Bioinformatics, 35 (2019), 2873–2874. https://doi.org/10.1093/bioinformatics/bty1069 doi: 10.1093/bioinformatics/bty1069
|
| [51] |
R. Dong, C. Goodbrake, H. A. Harrington, G. Pogudin, Differential elimination for dynamical models via projections with applications to structural identifiability, SIAM J. Appl. Algebra Geometry, 7 (2023), 194–235. https://doi.org/10.1137/22M1469067 doi: 10.1137/22M1469067
|
| [52] |
X. Rey Barreiro, A. F. Villaverde, Benchmarking tools for a priori identifiability analysis, Bioinformatics, 39 (2023), btad065. https://doi.org/10.1093/bioinformatics/btad065 doi: 10.1093/bioinformatics/btad065
|
| [53] |
D. P. Lizarralde-Bejarano, D. Rojas-Díaz, S. Arboleda-Sánchez, M. E. Puerta-Yepes, Sensitivity, uncertainty and identifiability analyses to define a dengue transmission model with real data of an endemic municipality of Colombia, PLoS One, 15 (2020), e0229668. https://doi.org/10.1371/journal.pone.0229668 doi: 10.1371/journal.pone.0229668
|
| [54] |
H. Wu, H. Zhu, H. Miao, A. S. Perelson, Parameter identifiability and estimation of hiv/aids dynamic models, Bull. Math. Biol., 70 (2008), 785–799. https://doi.org/10.1007/s11538-007-9279-9 doi: 10.1007/s11538-007-9279-9
|
| [55] |
M. C. Eisenberg, S. L. Robertson, J. H. Tien, Identifiability and estimation of multiple transmission pathways in cholera and waterborne disease, J. Theor. Biol., 324 (2013), 84–102. https://doi.org/10.1016/j.jtbi.2012.12.021 doi: 10.1016/j.jtbi.2012.12.021
|
| [56] |
K. Roosa, G. Chowell, Assessing parameter identifiability in compartmental dynamic models using a computational approach: application to infectious disease transmission models, Theor. Biol. Med. Model., 16 (2019), 1. https://doi.org/10.1186/s12976-018-0097-6 doi: 10.1186/s12976-018-0097-6
|
| [57] | N. Metropolis, S. Ulam, The monte carlo method, J. Amer. Stat. Assoc., 44 (1949), 335–341. |
| [58] |
H. T. Banks, K. Holm, D. Robbins, Standard error computations for uncertainty quantification in inverse problems: Asymptotic theory vs. bootstrap, Math. Comput. Model., 52 (2010), 1610–1625. https://doi.org/10.1016/j.mcm.2010.06.026 doi: 10.1016/j.mcm.2010.06.026
|
| [59] |
J. A. Jacquez, P. Greif, Numerical parameter identifiability and estimability: integrating identifiability, estimability, and optimal sampling design, Math. Biosci., 77 (1985), 201–227. https://doi.org/10.1016/0025-5564(85)90098-7 doi: 10.1016/0025-5564(85)90098-7
|


Figures(13) / Tables(36)

Omar Saucedo, Amanda Laubmeier, Tingting Tang, Benjamin Levy, Lale Asik, Tim Pollington, Olivia Prosper Feldman. Comparative analysis of practical identifiability methods for an SEIR model[J]. AIMS Mathematics, 2024, 9(9): 24722-24761. doi: 10.3934/math.20241204


 DownLoad: