Loading [MathJax]/jax/output/SVG/jax.js
Research article

Geoethics and dimensions of vulnerability in Central Africa: the case study of the Democratic Republic of the Congo

  • Received: 09 August 2021 Accepted: 25 August 2021 Published: 31 August 2021
  • This article aims to analyse the dimensions of vulnerability in the complex territorial ecosystem of the Democratic Republic of the Congo, considering some substantial geoethical considerations and guidelines, usefull for the resolution of crisis situation. A thematic analysis was carried out on a gathering of secondary data and testimonies. Specifically, the paper will examine the modalities by which the mitigation process of the various vulnerabilities can be realized if implemented in synergy with some geoethical key points. This could contribute to the disaster risk reduction in DRC. Therefore, this paper will ascertain how the promotion of an environmental and ethical responsibility cannot be ignored in the future. It must be recognized that social, physical, environmental, economic, cultural, institutional vulnerabilities are interwined and interdependent. So, for their resolution, an integrated and multidisciplinary approach and the adoption of strategies shared by all the national and international stakeholders and policy makers are required.

    Citation: Francesco De Pascale. Geoethics and dimensions of vulnerability in Central Africa: the case study of the Democratic Republic of the Congo[J]. AIMS Geosciences, 2021, 7(3): 440-456. doi: 10.3934/geosci.2021025

    Related Papers:

    [1] Xiangyang Ren, Shuai Chen, Kunyuan Wang, Juan Tan . Design and application of improved sparrow search algorithm based on sine cosine and firefly perturbation. Mathematical Biosciences and Engineering, 2022, 19(11): 11422-11452. doi: 10.3934/mbe.2022533
    [2] Anlu Yuan, Tieyi Zhang, Lingcong Xiong, Zhipeng Zhang . Torque control strategy of electric racing car based on acceleration intention recognition. Mathematical Biosciences and Engineering, 2024, 21(2): 2879-2900. doi: 10.3934/mbe.2024128
    [3] Shijing Ma, Yunhe Wang, Shouwei Zhang . Modified chemical reaction optimization and its application in engineering problems. Mathematical Biosciences and Engineering, 2021, 18(6): 7143-7160. doi: 10.3934/mbe.2021354
    [4] Guowen Li, Ying Xu, Chengbin Chang, Sainan Wang, Qian Zhang, Dong An . Improved bat algorithm for roundness error evaluation problem. Mathematical Biosciences and Engineering, 2022, 19(9): 9388-9411. doi: 10.3934/mbe.2022437
    [5] Shenghan Li, Linlin Ye . Multi-level thresholding image segmentation for rubber tree secant using improved Otsu's method and snake optimizer. Mathematical Biosciences and Engineering, 2023, 20(6): 9645-9669. doi: 10.3934/mbe.2023423
    [6] Chikun Gong, Yuhang Yang, Lipeng Yuan, Jiaxin Wang . An improved ant colony algorithm for integrating global path planning and local obstacle avoidance for mobile robot in dynamic environment. Mathematical Biosciences and Engineering, 2022, 19(12): 12405-12426. doi: 10.3934/mbe.2022579
    [7] Yijie Zhang, Yuhang Cai . Adaptive dynamic self-learning grey wolf optimization algorithm for solving global optimization problems and engineering problems. Mathematical Biosciences and Engineering, 2024, 21(3): 3910-3943. doi: 10.3934/mbe.2024174
    [8] Ning Zhou, Chen Zhang, Songlin Zhang . A multi-strategy firefly algorithm based on rough data reasoning for power economic dispatch. Mathematical Biosciences and Engineering, 2022, 19(9): 8866-8891. doi: 10.3934/mbe.2022411
    [9] Junjie Liu, Hui Wang, Xue Li, Kai Chen, Chaoyu Li . Robotic arm trajectory optimization based on multiverse algorithm. Mathematical Biosciences and Engineering, 2023, 20(2): 2776-2792. doi: 10.3934/mbe.2023130
    [10] Di-Wen Kang, Li-Ping Mo, Fang-Ling Wang, Yun Ou . Adaptive harmony search algorithm utilizing differential evolution and opposition-based learning. Mathematical Biosciences and Engineering, 2021, 18(4): 4226-4246. doi: 10.3934/mbe.2021212
  • This article aims to analyse the dimensions of vulnerability in the complex territorial ecosystem of the Democratic Republic of the Congo, considering some substantial geoethical considerations and guidelines, usefull for the resolution of crisis situation. A thematic analysis was carried out on a gathering of secondary data and testimonies. Specifically, the paper will examine the modalities by which the mitigation process of the various vulnerabilities can be realized if implemented in synergy with some geoethical key points. This could contribute to the disaster risk reduction in DRC. Therefore, this paper will ascertain how the promotion of an environmental and ethical responsibility cannot be ignored in the future. It must be recognized that social, physical, environmental, economic, cultural, institutional vulnerabilities are interwined and interdependent. So, for their resolution, an integrated and multidisciplinary approach and the adoption of strategies shared by all the national and international stakeholders and policy makers are required.


    The sparrow search algorithm [1] is a new SI algorithm put forward by Xue in 2020. By observing the predation behavior and reconnaissance mechanism of sparrow populations in nature, the intelligent algorithm has the advantages of high search accuracy, fast optimization and few parameters, which has attracted more and more scholars' attention. Furthermore, as a kind of SI algorithm, the sparrow search algorithm also has some shortcomings, such as premature convergence and easy to fall into local optimization.

    For the improvement and application of the sparrow search algorithm, many scholars have done a lot of research. GAO et al. [2] put forward a multi-strategy improved evolutionary sparrow search algorithm by adding tent chaos in the initialization population phase, which sped up convergence and improved convergence precision. Additionally, the algorithm used a greedy strategy to fully utilize each individual sparrow to increase its capability to deal with the global optimal solution. Liu et al. [3] added the circle chaotic mapping into the sparrow search algorithm to improve the global search ability of the algorithm in population initialization and introduce t-distribution in the position update formula for different iteration cycles of the sparrow to facilitate the algorithm to jump out of the local optimum. Ren et al. [4] proposed a sparrow search algorithm based on sine cosine and firefly disturbance. The sine cosine algorithm with random inertia weight was added to the finder position update, and all sparrows were updated using the optimal sparrows obtained by firefly disturbance method to improve the sparrows search ability. Brezočnik et al. [5] analyzed various methods of SI algorithms in feature selection problems, provided a unified framework for SI algorithms to solve feature selection and discussed the application prospects of feature selection methods based on SI in different application fields. Zhang et al. [6] proposed a random configuration network based on the chaotic sparrow search algorithm, the chaotic sparrow search algorithm mainly uses logistic mapping, adaptive hyperparameters and variational operators to enhance the global optimization capability of the sparrow search algorithm. The accuracy of the random configuration network is affected by the allocation and selection of some network parameters. The chaotic sparrow search algorithm is used to optimize the random configuration network to provide better parameters for the network. Fan et al. [7] used the hybrid sparrow search algorithm to optimize the hyperparameters of the deep learning algorithm. The hybrid sparrow search algorithm is a hyperparameter optimization method combining the sparrow search algorithm and particle swarm optimization, which avoids the local optimal solution in the sparrow search algorithm and the search efficiency of the particle swarm optimization algorithm. Dong et al. [8] used an improved multi-objective sparrow search algorithm to distribute the capacity of distributed power generation, introduced Levy flight strategy to enhance the ability of multi-objective sparrow search algorithm to jump out of local optimum and established a multi-objective optimization model with investment cost, environmental protection and power supply quality and used the multi-objective sparrow search algorithm to optimize the solution. Zhu et al. [9] used an improved sparrow search algorithm to optimize the control of a chilled water system, disturbed the sparrow by random walk strategy to improve the global search ability of the sparrow and added Gaussian mutation in the iterative process of the algorithm to enhance the local search capability, which effectively solves the problem of large time lag and inertia of the chilled water system. Li et al. [10] proposed an improved sparrow search algorithm to solve the problem of super-parameter selection of the support vector machine (SVM) model. Through a new dynamic adaptive t- distribution mutation, the performance of the sparrow search algorithm was enhanced, and the proposed method can effectively improve the prediction accuracy.

    Although the aforementioned revised approaches have helped the algorithm's search performance to some degree, there is still much potential for advancement. In order to improve the algorithm's convergence performance and convergence accuracy simultaneously, we propose a multi-strategy improved sparrow search algorithm based on the existing research. The major contributions of this article are as follows:

    1) A multi-strategy improved sparrow search algorithm (ISSA) has been proposed, with mostly the following three points.

    a) Dynamically adjust the number of discoverers and joiners in the population, which facilitates the algorithm to make a balance between search and global search.

    b) The update the strategy of the mining phase of the honeypot optimization algorithm (HBA) is introduced to improve the location update of the joiners in SSA and enhance the global exploitation capability of the algorithm.

    c) The optimal position of the discoverer is disturbed by the disturbance operator and levy flight to increase the algorithm's capacity to depart from the local optimum.

    2) Compared with five basic algorithms on 13 benchmark functions, the effectiveness of the proposed algorithm is verified. The results demonstrate that the proposed algorithm has faster convergence speed and higher convergence accuracy in solving functional optimization problems.

    3) Applying ISSA to the pilot optimization problem in channel estimation, the bit error rate is greatly improved, indicating the superiority of the proposed algorithm in engineering applications.

    The organizational structure of the remaining parts of this article is as follows: The second section discusses the basic sparrow search algorithm, describing the population distribution and update method of the original algorithm. In the third section, an improved sparrow search algorithm (ISSA) was proposed, and three improved strategies were introduced. In the fourth section, we conducted simulation experiments on the proposed method, conducted experiments on unimodal and multimodal test functions and conducted Wilcoxon rank sum tests. The fifth section applies the proposed algorithm to channel estimation in the OFDM system, and finally, a summary is provided in the sixth section.

    The sparrow search algorithm is put forward by observing the predation behavior and reconnaissance mechanism of sparrow populations in nature. The sparrow population is divided into two categories: finders and participants, in which the finders account for 30% of the population and supply the foraging guidance for the whole sparrow population, and the remaining sparrows are participants, which search for food around the discoverers with the best fitness value. Additionally, certain sparrows were chosen at random to serve as scouts to add an early warning mechanism.

    In SSA, discoverers are sparrows with higher fitness values and they supply foraging directions and locations for the joiners. The location formula of the discoverers is as follows:

    Xt+1i={Xtiexp(iaT) R2<STXti+QLR2ST (2.1)

    t indicates the current iteration number, T is the maximum iteration number, Xti indicates the location of the i sparrow in the t iteration, a is the random number of (0, 1), Q satisfies normal distribution, L is the matrix of 1×D with all elements in it are 1 and D is the maximum dimensional value. R2 and ST represent the alert values and security values. When R2<ST, it means that the current environment is free of pouncers and the discoverer can conduct an extensive search. When R2ST, it indicates that a portion of the population has found a predator and an alert has been issued, and all sparrows need to move closer to the safety zone at this time.

    Joiners always observe the behavior of discoverers and they adjust their positions based on the information from the discoverers. The location formula of the participants is as follows:

    Xt+1i={Qexp(XworstXtii2)i>n/2Xtp+|XtiXtp|A+Lotherwise (2.2)

    where Xworst denotes the global worst location, Xtp denotes the optimal position currently occupied by the discoverer, A is a matrix of 1×D with values randomly assigned to 1 or -1 and A+=AT(AAT)1. When i>n/2, it indicates that the i sparrow with low adaptability is not getting sufficient nutrition and needs to fly to other places to forage for better food, otherwise, the joiner searches near the optimal location searched by the finder.

    During sparrow foraging, in order to avoid attacks from predators, the population randomly selects sparrows from 10-20% to scout, and when danger is detected, individuals in the population will make corresponding adjustments. The location formula of the scouts is as follows:

    Xt+1i={Xti+β|XtiXtbest| fi>fgXti+K(|XtiXtworst|(fifw)+ε) fi=fg (2.3)

    Xtbest is the current global optimum position and β is the step control variable, which satisfies the standard normal distribution, K is a random number between (-1, 1) and fgandfw are the global highest and lowest fitness values, respectively. ϵ is a constant to prevent the denominator from being 0. When fi>fg, the sparrow is at the edge of the population and is vulnerable to attack by predators, sparrows need to move to the best individual position of the population. fi=fg indicates that the sparrow in the middle of the population is aware of the danger and needs to move closer to other sparrows to reduce the risk of being pounced.

    First, the population dynamic adjustment strategy is used to control the number of sparrow population discoverers and joiners. The number of discoverers and joiners of the original sparrow search algorithm is fixed and the discoverers perform global search and the joiners perform local search. With the increase of iterations, the algorithm tends to fall into a local optimum and requires more discoverers for global search, so the population dynamic adjustment strategy is designed to balance the algorithm's global search and local search capabilities of the algorithm to avoid falling into a local optimum. Then, the joiner's position update formula in the algorithm is improved. The joiner's position update formula for conducting global search in the original algorithm is a step length multiplied by a normally distributed random number, which is determined by the current position and the global worst position, and only the global worst position is considered, while the global optimal position is ignored. In the improved position update formula, the mining phase of the honeypot optimization algorithm (HBA) is introduced, and the global optimal position and the global worst position are added to enhance the global exploration capability of the algorithm. Finally, the optimal position of the population discoverer is perturbed using the perturbation operator and levy flight strategy. In the original algorithm, the joiner always searches near the optimal position of the discoverer, the optimal position of the discoverer may be in the local optimum, at which time it is necessary to perturb the move step using the perturbation operator. Levy flight is added at the optimal position to enhance the ability of the algorithm to depart the local optimum.

    Discoverers in the sparrow population primarily undertake worldwide searches, while joiners' activity is classified into two categories. One portion of the joiners conducts local searches in the discoverer's optimal location, while the other part conducts worldwide searches. The number of discoverers and joiners in the sparrow population is fixed in the original sparrow search algorithm, and a fixed number of discoverers always undertake global searches in each iteration. The joiners then seek, depending on the direction supplied by the discoverer. Once the discoverer's ideal location falls into a local optimum, a set number of joiners do a local search at the optimal point, followed by a global search, making it difficult to exit the local optimum. Later in the algorithm iteration process, a bigger number of discoverers are necessary to conduct global searches in order to explore better sites all over the world. Moreover, a greater proportion of sparrows are required to do global searches among joiners. To balance the algorithm's ability to do global and local searches, a dynamic adjustment approach for the number of sparrow discoverers and participants has been created. The dynamic adjustment strategy is as follows:

    PD1=PD+R1(t/T)PD2=R2+R3(t/T) (3.1)

    PD1 is the proportion of improved discoverers, PD is the original discoverers' ratio, generally set at 20%, R1 is the upper limit for the set discoverer ratio column increase, which is equal to 0.1, t is the current iteration number and T is the maximum iteration number. PD2 is the comparison column of sparrows in the population for global search, R2 is the original set ratio, generally set to 0.5, R3 is the upper limit of the increased global search sparrow ratio, taken as 0.1. With the increase of the number of times, the number of discoverers and global search joiners are increasing, and the number of joiners searching near the optimal position of the discoverer is decreasing, which is conducive to the algorithm to jump out of the local optimum and increase the ability of global search.

    The honeypot optimization algorithm [11] is a new meta-heuristic intelligent algorithm proposed by Fatma A. Hashim in 2021. The HBA algorithm is mainly used to find the optimal by mimicking the honey badger foraging behavior, the algorithm model has few parameters and has a better global search capability. There are two phases in the search process, tracking around the excavation and following existing guides to find foraging honey. Thus, we mainly introduce the update strategy of the tracking around the excavation phase of HBA, and in the excavation phase, the formula for updating the position of the honeypot algorithm is as follows:

    xnew=xprey+F×β×I×xprey+F×r1×α×di×|cos(2πr2)×[1cos(2πr3)]| (3.2)

    xprey is the location of the prey and is the best location globally. β1 (Default is 6) represents the honey badger's ability to find food. di is the distance between the prey and the i th honey badger, and r1, r2 and r3 are three different random numbers between 0 and 1. F as a sign to change the search direction, the following equation is used to update:

    F={1 r40.51 else (3.3)

    I is the definition of olfactory intensity, if the odor is high, the movement will be fast and vice versa, which is given by the inverse square law. α is the time-varying search decay factor, which indicates the randomness of the search process over time. α value decreases with increasing number of iterations and is defined by equation.

    I=r5×S4πd2S=(xixi+1)2d=xpreyxiα=2×exp(ttmax) (3.4)

    In the mining phase of the honeypot optimization algorithm, the search is mainly carried out near the global optimal position, and two random steps are added. In other words, a position is randomly selected from the current and optimal positions as the update position for the next iteration. In the original sparrow search algorithm, the update formula of the participant's location for global search only takes into account the current and worst positions, leaving out the ideal position. The search strategy of the honeypot algorithm is applied to the position update formula of the joiners in SSA, and the optimal position of the discoverer is introduced into the global search update formulas, randomly select a position between the optimal and worst positions as the step size for position update in the next iteration. The improved discoverer location update formula is as follows:

    Xt+1i={Qexp(Xtp+F×β×I×(XtpXworst)i2) i>n.(1PD2)Xtp+|XtiXtp|A+L otherwise (3.5)

    Among them, n represents the number of sparrow populations. When i>n(1PD2), it indicates that the current enrollee has not found a better location, so it is necessary to expand the search interval for global search. In other cases, the participants need to use the information provided by the discoverer for local search.

    In the original algorithm, the joiner is searching at the optimal position found by the discoverer, and in the multi-peak test function, if the discoverer finds the local optimal location, then the joiner searches at the local optimal position of the algorithm. If it is difficult to depart from the local optimum, it is necessary to perturb the joiner position update formula with a small perturbation when the current sparrow's fitness value is low, and a larger perturbation when the fitness value is larger, which is also affected by the number of iterations, while adding levy flight [12] near the optimal position of the discoverer XtP to facilitate the algorithm to depart from the local optimum. The perturbation operator and levy flight are defined as follows:

    w=wmin+(wmaxwmin)×(fifgfwfg)×tTLevy(β)=αu|v|1β (3.6)

    where w is the current perturbation, wmax and wmin are the highest and lowest perturbations, respectively, which take the values of 0.5 and 1.5 here, Levy(β) is the levy flight's step size, u, v satisfy the normal distribution and α is the step scaling factor. In the experiment, levy flight requires small changes, so the value of a should not be too large. After repeated experiments, we found that the performance is best when α is set to 0.01 and β is the random number of [0, 2], when taken as 1.5. Levy flight involves performing small step size transformations over a long period of time, with occasional large step size transformations. By introducing levy flight into the optimal position in the local search formula of the joiners, the optimal position can be perturbed, resulting in a small deviation of the discoverer's optimal position with a high probability and a large deviation with a low probability. The joiners not only retain the discoverer's position information, but helps the algorithm depart from local optima. The improved algorithm updates the formula as follows:

    Xt+1i={Qexp(Xtp+F×β×I×(XtpXworse)i2) i>n.(1PD2)Levy(β)Xtp+w|XtiLevy(β)Xtp|A+L otherwise (3.7)

    n represents the number of sparrow populations. In the global search stage of the discoverer, we added the search strategy of the honeypot algorithm, expanding the search space and global search ability of the algorithm. In the local search stage, we added perturbation operators and levy flight, which can break free from the constraints of the optimal position of the discoverer and have the ability to jump out of the local optimum.

    The specific implementation steps of the ISSA algorithm are as follows:

    Step 1. Set the population size N, maximum number of iterations T, scout ratio SD, alarm value R2 and security value ST.

    Step 2. Calculate each sparrow's fitness value individually using the fitness function, then rank them, record the best position Xbest and the best fitness value fg, the worst position Xworst and the worst fitness value fw in the population.

    Step 3. Calculate the proportion of discoverers PD1 and the proportion of joiners performing a global search PD2 according to Eq (3.1).

    Step 4. The population is separated into discoverers and participants according to the ratio calculated in step 3, and the locations of discoverers and joiners are updated according to Eqs (2.1) and (3.7).

    Step 5. Update the location of the scout according to Eq (2.3).

    Step 6. Update the best position Xbest and best fitness value fg, the worst position Xworst and the worst fitness value fw.

    Step 7. When the maximum number of iterations has been achieved, the best outcome is produced and the algorithm is finished, otherwise go to step 3.

    The pseudocode of the ISSA algorithm is shown in Table 1.

    Table 1.  Pseudocode for ISSA.
    Algorithm multi-strategy improved sparrow search optimization algorithm
    Input: the population size N, maximum number of iterations T, scout ratio SD, alarm value R2 and security value ST.
    Output: global minimum fitness value fbest and the global optimal position Xbest
    1. set t = 0
    2. initialize the position vector of sparrow individuals Xti(i=1,2,...,N)
    3. calculate the fitness value of each sparrow individual based on the fitness function and sort them, recording the best position Xbest and best fitness value fg, the worst position Xworst and the worst fitness value fw
    4. while (t < T) do
        calculate the proportion of discoverers PD1 and the proportion of global searchers PD2 according to Eq (3.1)
        For i=1:NPD1 do
        update the discoverer's position Xti according to Eq (2.1) and calculate the fitness value fi
        update discoverer's optimal location Xtp
        End for
        For i=NPD1+1:N do
        update the position Xti of the enrollee according to Eq (3.7) and calculate the fitness value fi
        End for
        For i=1:N0.2 do
        update the position Xti of the scout according to Eq (2.3) and calculate the fitness value fi
        End for
        update the best position Xbest and best fitness value fg, the worst position Xworst and the worst fitness value fw
        t = t + 1
      End while
    5. return fbest, Xbest

     | Show Table
    DownLoad: CSV

    In order to test the performance of the improved sparrow algorithm (ISSA), 13 distinct standard test functions were selected for testing. To ensure the reliability of the algorithm, these functions include single-peak and multi-peak. F1F7 is the single-peak benchmark test function and F8F13 is the multi-peak benchmark test function, and the specific function information is shown in Table 2, where D represents the dimension of function, range represents the upper and lower limits of each dimension and Fmin is the theoretical optimal value of the test function.

    Table 2.  Benchmarking function.
    Function D Range Fmin
    F1(x)=ni=1x2i 30 [100,100]  0
    F2(x)=ni=1|xi|+ni=1|xi| 30 [100,100]  0
    F3(x)=ni=1(nj=1xj)2 30 [100,100]  0
    F4(x)=max{|xi|,1in}  30 [100,100]  0
    F5(x)=ni=1[100(xi+1xi)2+(xi1)2] 30 [100,100]  0
    F6(x)=ni=1(|xi+0.5|2)  30 [100,100]  0
    F7(x)=ni=1ix4i+random[0,1) 30 [100,100]  0
    F8=ni=1xisin(|xi|)  30 [500.500] 12569.5
    F9=ni=1[x2i10cos(2πxi) + 10] 30 [5.12, 5.12] 0
    F10 = - 20exp( - 0.21/nni=1x2i) - exp(1/nni=1cos(2πxi)) + 20 + e   30 [32,32] 0
    F11=1/4000ni=1x2ini=1cos(xi/i) + 1 30 [600,600]  0
    F12=π/n{10sin(πyi)+y}+ni=1u(xi,10,100,4){y=n1i=1(yi1)2[1+10sin2(πyi+1)]+(yn1)2 yi=1+(xi+1)/4u(xi,a,k,m)={k(xia)m xi>a0 a<xi<ak(xia)m xi<a  30 [50,50]   0
    F13=0.1{sin2(3πxi)+y}+ni=1u(xi5,100,4) 0 {y=ni=1(xi1)2[1+10sin2(3πxi+1)]+(xn1)2[1+sin2(2πxn]yi=1+(xi+1)/4 u(xi,a,k,m)={k(xia)m xi>a a<xi<ak(xia)m xi<a  30   [-50, 50]  0

     | Show Table
    DownLoad: CSV

    The improved algorithms in this paper were compared with the initial sparrow search algorithm (SSA) [1], gray wolf algorithm (GWO) [13], particle swarm algorithm (PSO) [14], whale algorithm (WOA) [15] and harris hawk algorithm (HHO) [16] with a population setting of 50 and an iteration number of 500, which were run in 13 basic test functions. To verify the improved accuracy and reliability of the algorithms, each algorithm was run 30 times independently to obtain the best value, the worst value, the mean value and the standard deviation. The experimental data are shown in Table 3.

    Table 3.  Statistical results of test functions.
    Function Algorithm Best Value Worst Value Mean Standard Deviation
    F1 ISSA 0 0 0 0
    SSA 0 3.1864e-167 1.0621e-168 0
    GWO 1.3421e-35 9.5061e-33 1.8382e-33 2.2221e-33
    PSO 6.2326e-01 4.0682e+00 1.9043e+00 7.8942e-01
    WOA 1.2048e-97 2.4256e-79 8.0858e-81 4.4285e-80
    HHO 3.1580e-115 1.1840e-101 4.3698e-103 2.1566e-102
    F2 ISSA 0 0 0 0
    SSA 0 8.0286e-73 2.7546e-74 1.4649e-73
    GWO 1.0171e-20 1.6197e-19 1.8382e-33 4.0183e-20
    PSO 2.1010e+00 8.8391e+00 3.7033e+00 1.5229e+00
    WOA 1.1144e-60 1.6915e-51 5.7178e-53 3.0868e-52
    HHO 1.5936e-63 5.4539e-52 3.7851e-53 1.2047e-52
    F3 ISSA 0 0 0 0
    SSA 0 3.2933e-97 1.0977e-98 6.0128e-98
    GWO 8.8323e-05 1.1289e-01 1.4057e-02 2.4901e-02
    PSO 8.3009e+02 2.3863e+03 1.5807e+03 3.6382e+02
    WOA 8.7232e+04 2.2099e+05 1.5590e+05 3.0711e+04
    HHO 6.6572e-104 7.5648e-80 2.6622e-81 1.3800e-80
    F4 ISSA 0 0 0 0
    SSA 0 3.3360e-79 1.1304e-80 6.0882e-80
    GWO 1.8481e-09 2.0828e-07 2.1830e-08 3.6978e-08
    PSO 1.5610e+00 2.1636e+00 1.8451e+00 1.5855e-01
    WOA 1.0979e+00 8.0088e+01 4.0919e+01 2.6874e+01
    HHO 6.5401e-59 9.4584e-51 6.7262e-52 1.7779e-51
    F5 ISSA 5.0702e-08 6.6256e-04 1.2085e-04 1.8009e-04
    SSA 8.0695e-09 6.9311e-04 4.3963e-05 4.6962e-05
    GWO 2.5409e+01 2.7947e+01 2.6763e+01 6.3084e-01
    PSO 2.0406e+02 2.0100e+03 6.2682e+02 3.6003e+02
    WOA 2.6745e+01 2.8735e+01 2.7510e+01 5.1895e-01
    HHO 1.4009e-05 4.0703e-02 6.4049e-03 9.0201e-03
    F6 ISSA 3.2625e-09 1.7089e-04 8.5505e-06 3.0861e-05
    SSA 8.3945e-14 7.5595e-08 3.5915e-09 8.5505e-06
    GWO 2.9951e-05 1.0066e+00 4.0874e-01 2.9877e-01
    PSO 4.7765e-01 3.4218e+00 1.6663e+00 8.5085e-01
    WOA 1.4147e-02 4.1637e-01 7.8582e-02 8.2848e-02
    HHO 5.8989e-08 4.2385e-04 5.3248e-05 9.4043e-05
    F7 ISSA 5.008e-06 2.7466e-04 7.4644e-05 7.6159e-05
    SSA 2.3711e-05 1.2953e-03 3.1855e-04 3.4020e-04
    GWO 1.9770e-04 3.3204e-03 1.1363e-03 8.0935e-04
    PSO 2.7306e+00 3.7821e+01 1.1836e+01 9.0431e+00
    WOA 3.4660e-05 7.3887e-03 2.0482e-03 2.1898e-03
    HHO 2.7638e-06 4.1441e-04 9.7169e-05 1.0390e-04
    F8 ISSA -1.2569e+04 -7.4191e+03 -1.1887e+04 1.2782e+03
    SSA -9.2134e+03 -6.5663e+03 -8.2420e+03 5.5573e+02
    GWO -7.9246e+03 -5.0894e+03 -6.4129e+03 6.0860e+02
    PSO -8.8566e+03 -3.1261e+03 -6.5984e+03 1.2449e+03
    WOA -1.2569e+04 -8.7211e+03 -1.1390e+04 1.0232e+03
    HHO -1.2569e+04 -1.2346e+04 -1.2562e+04 4.0822e+01
    F9 ISSA 0 0 0 0
    SSA 0 0 0 0
    GWO 0.0000e+00 1.1286e+01 2.6422e+00 3.4938e+00
    PSO 8.9641e+01 2.2799e+02 1.5502e+02 3.2893e+01
    WOA 0.0000e+00 1.2864e+02 4.2878e+00 2.3485e+01
    HHO 0 0 0 0
    F10 ISSA 8.8818e-16 8.8818e-16 8.8818e-16 0
    SSA 8.8818e-16 8.8818e-16 8.8818e-16 0
    GWO 3.6415e-14 5.7732e-14 4.4231e-14 5.2281e-15
    PSO 1.5364e+00 3.2912e+00 2.3790e+00 4.6682e-01
    WOA 8.8818e-16 7.9936e-15 4.5593e-15 2.1847e-15
    HHO 8.8818e-16 8.8818e-16 8.8818e-16 0.0000e+00
    F11 ISSA 0 0 0 0
    SSA 0 0 0 0
    GWO 0.0000e+00, 2.1431e-02 3.5261e-03 6.2577e-03
    PSO 4.1021e-02 1.7217e-01 8.9648e-02 3.1821e-02
    WOA 0.0000e+00 1.0747e-01 3.5825e-03 1.9622e-02
    HHO 0 0 0 0
    F12 ISSA 2.5567e-14 1.0504e-05 8.2340e-07 2.0803e-06
    SSA 7.2294e-12 1.1659e-07 1.3818e-08 2.4578e-08
    GWO 7.0921e-06 6.2996e-02 2.6369e-02 1.2897e-02
    PSO 3.8811e-03 2.2942e-01 3.3481e-02 4.6857e-02
    WOA 1.5657e-03 9.3638e-02 9.9804e-03 1.6518e-02
    HHO 1.0840e-07 1.7123e-05 3.7877e-06 4.1722e-06
    F13 ISSA 5.0710e-10 2.5597e-05 2.9599e-06 5.4241e-06
    SSA 8.9927e-10 2.0121e-06 1.9305e-07 3.8369e-07
    GWO 4.7668e-05 7.5600e-01 4.0804e-01 2.1821e-01
    PSO 2.1080e-01 7.0900e-01 4.0368e-01 1.4349e-01
    WOA 2.7551e-02 5.8833e-01 2.1351e-01 1.5308e-01
    HHO 1.2643e-09 2.2246e-04 3.6326e-05 5.1000e-05

     | Show Table
    DownLoad: CSV

    As shown in Table 3, for the single-peak test function F1F4, the proposed ISSA has a higher finding effect than SSA, GWO, PSO, WOA and HHO. All can find the theoretical optimal value with a standard deviation of 0, and the optimization effect is stable. For the F5 and F6 functions, ISSA's optimization is lower than that of SSA, but the accuracy loss is not great. For the F7 function, ISSA has little improvement, and the standard deviation and mean value are the lowest. For the F8 function, HHO achieves the best result, the optimal value and the average value are close to the theoretical optimal value, the performance of ISSA has improved significantly and the average value has been greatly enhanced compared with SSA. For the F9F11 function, ISSA, SSA and HHO have similar performance and have discovered the test function's ideal value, which means that ISSA has maintained the optimization-seeking ability of SSA and has not reduced the optimization-seeking ability of the algorithm. For the F12F13 function, SSA outperforms ISSA, which comes in second only to SSA and also achieves good optimization results. In summary, ISSA performs poorly on F5, F6, F12, F13 and achieves better performance on other test functions.

    In order to highlight the superiority of the algorithm more intuitively and to facilitate the presentation of experimental results, the first 12 test functions were selected for testing, each algorithm was independently executed 30 times and the average convergence curves of the test functions were plotted according to the fitness function value and the number of iterations. Specifically, as shown in Figure 1, it can be observed that the improved algorithm in this paper has a faster convergence speed and higher convergence accuracy on most test functions. In the F1F4 function, the improved algorithm is able to converge to 0, and ISSA has a huge improvement in both convergence speed and convergence accuracy. In F5, F6, ISSA has poorer performance compared to SSA, but there is no major loss in accuracy, and it is still more accurate than GWO, HHO, PSO and WOA. In the F7 function, ISSA has the greatest optimization finding precision among the six algorithms, and in the F8 function, ISSA has lower performance than HHO, but still higher than SSA, GWO, PSO and WOA. In F9F11, ISSA, SSA and HHO all find the theoretical optimum, but ISSA has higher convergence speed, and the convergence speed improvement is very large. In the F12 function, the convergence accuracy of ISSA is lower than that of SSA, but the difference is not large. In summary, ISSA has good performance in both single-peak and multi-peak functions.

    Figure 1.  Average convergence curve of test function.

    Due to the improvement of the original algorithm, ISSA has higher computational complexity, and the running time can indirectly reflect the complexity of the algorithm. Therefore, we have made statistics on the running time of each algorithm, in which the number of iterations is set to 500, and the population is set to 50, running for a total of 100 times. The average running time of the six algorithms obtained is in Table 4, and the time unit is seconds. It can be seen that the average running time of ISSA is longer than that of SSA and other algorithms. The running time of SSA is longer than that of GWO and PSO, because these two algorithms are traditional SI algorithms with low complexity and poor performance in optimization, so the time is short. HHO and WOA are new SI algorithms, and the calculation time of SSA is longer than WOA and shorter than HHO. ISSA is improved on the basis of SSA, adding three strategies, which increases the computational complexity and running time, but has better convergence speed and accuracy.

    Table 4.  Function run schedule.
    Function ISSA SSA GWO PSO WOA HHO
    F1 4.5601e-01 2.5262e-01 1.8739e-01 2.2744e-01 8.7704e-02 1.1250e-01
    F2 5.2522e-01 2.9624e-01 2.1472e-01 3.1399e-01 1.0855e-01 1.3769e-01
    F3 1.7906e+00 1.5361e+00 1.2834e+00 2.6802e+00 1.1424e+00 1.1655e+00
    F4 4.7572e-01 2.6550e-01 1.8347e-01 2.7232e-01 8.5454e-02 1.1064e-01
    F5 6.4553e-01 2.9481e-01 2.2528e-01 4.0675e-01 1.1273e-01 1.4183e-01
    F6 5.7290e-01 2.4893e-01 1.8573e-01 3.1503e-01 8.5637e-02 1.1233e-01
    F7 7.2310e-01 3.9009e-01 2.9794e-01 5.2787e-01 1.9761e-01 2.2544e-01
    F8 6.4317e-01 3.0312e-01 2.2628e-01 4.2769e-01 1.3433e-01 1.5224e-01
    F9 4.5420e-01 2.6201e-01 1.9559e-01 3.4739e-01 1.0720e-01 1.1922e-01
    F10 5.1214e-01 2.9018e-01 2.1408e-01 3.9707e-01 1.2929e-01 1.4188e-01
    F11 5.5401e-01 3.2185e-01 2.3612e-01 6.4961e-01 1.4446e-01 1.6124e-01
    F12 9.1667e-01 7.0514e-01 5.4576e-01 1.1828e+00 4.4232e-01 4.6976e-01
    F13 1.0942e+00 7.1022e-01 5.4974e-01 1.1907e+00 4.4634e-01 4.7318e-01

     | Show Table
    DownLoad: CSV

    To more thoroughly evaluate the effectiveness of the proposed algorithm, we introduce the Wilcoxon rank sum test [17] to test the significance of the optimal results of ISSA algorithm and other algorithms under 30 independent runs to evaluate whether there is a significant difference between the proposed ISSA and other algorithms. The original hypothesis is H0 : there is no significant difference between the two algorithms, and the alternative hypothesis is H1 : there is a significant difference between the two algorithms. When P<5%, the original hypothesis H0 is rejected and the alternative hypothesis H1 is accepted, which means that there is a significant difference between the two algorithms, and when P>5%, the original hypothesis is accepted, which implies that there is no significant difference between the two algorithms, indicating that the two algorithms are equivalent in finding the optimal results. The rank sum test results of ISSA and SSA, GWO, PSO, WOA and HHO are shown in Table 5, where N/A indicates that the two algorithms have equivalent performance and cannot be compared.

    Table 5.  Wilcoxon rank sum test P value table.
    Function SSA GWO PSO WOA HHO
    F1 5.8522e-09 1.2118e-12 1.2118e-12 1.2118e-12 1.2118e-12
    F2 5.7720e-11 1.2118e-12 1.2118e-12 1.2118e-12 1.2118e-12
    F3 1.9346e-10 1.2118e-12 1.2118e-12 1.2118e-12 1.2118e-12
    F4 1.6572e-11 1.2118e-12 1.2118e-12 1.2118e-12 1.2118e-12
    F5 1.4532e-01 3.0199e-11 3.0199e-11 3.0199e-11 1.4733e-07
    F6 8.1014e-10 3.0199e-11 3.0199e-11 3.0199e-11 1.3111e-08
    F7 6.0459e-07 3.0199e-11 3.0199e-11 1.4643e-10 8.0727e-03
    F8 1.6132e-10 3.0199e-11 3.4971e-09 8.5641e-04 3.2651e-02
    F9 N/A 1.1586e-11 1.2118e-12 1.2118e-12 N/A
    F10 N/A 9.0844e-13 1.2118e-12 1.0793e-09 N/A
    F11 N/A 2.7880e-03 1.2118e-12 1.2118e-12 N/A
    F12 4.9752e-11 3.0199e-11 3.0199e-11 3.0199e-11 2.1959e-07
    F13 3.4971e-09 3.0199e-11 3.0199e-11 3.0199e-11 1.4733e-07

     | Show Table
    DownLoad: CSV

    According to Table 3, the performance of ISSA is equivalent to that of SSA and HHO in the F9F11 function, which shows that the three algorithms can determine the best value of the test function pair in each experiment. According to the convergence curve, it is known that ISSA has faster convergence velocity and higher stability. The rest of the p-values are less than 0.05, indicating that there is a significant difference between the proposed ISSA and the other algorithms.

    Figure 2 shows the boxplot of the optimal value for each test function of six algorithms. Each algorithm runs independently 50 times in the test function, selecting F1, F3, F5 and F7 from the single-peak function and F8 and F11 from the multi-peak function. It can be seen that in F1 and F3, the ISSA algorithm has a maximum, minimum and median of 0 in the boxplot, which is much smaller than other algorithms, indicating that ISSA has strong balance ability and high robustness. In F5, the optimal value accuracy of ISSA is lower than ISSA, but much higher than other algorithms. However, its upper quartile is smaller than ISSA, and the optimal value distribution is relatively concentrated, improving the robustness of the original algorithm. In F7, the accuracy of the optimal value solved by ISSA is greater than that of SSA, and the entire boxplot of ISSA is below SSA, which also improves the robustness of the original algorithm. The search accuracy of ISSA and HHO is the same, the median and mean values of ISSA are lower than HHO and the stability of ISSA is higher. In F8, HHO has greater robustness, the accuracy of the ISSA is significantly higher than that of SSA and it is concentrated close to the theoretical ideal value with minimal variation in the optimal value, which further increases robustness. For F11, the optimal value for ISSA, SSA and HHO is 0, and each of these three algorithms has a high level of robustness. Based on the corresponding F11 convergence curve in Figure 1, it can be seen that ISSA has a faster convergence speed. In summary, ISSA not only improves search accuracy, but also has high robustness.

    Figure 2.  Boxplot for algorithm.

    Orthogonal frequency division multiplexing (OFDM) [18] is the core technology of 4G networks, as a low-complexity transmission technology, it is widely used in broadcast systems as well as wireless LAN standards and has great advantages in terms of resistance to multipath fading, narrowband interference, multiple access and signal processing. The difficulty of this system is mainly to obtain the channel state information matrix accurately so as to recover the transmitted signal at the receiver side, so channel estimation is the key to achieve this step.

    The major traditional channel estimation methods are least squares (LS) [19], minimum mean square error (MMSE) [20], maximum likelihood [21] and Bayesian channel estimation [22]. The three major orthogonal frequency division multiplexing (OFDM) channel estimation methods are non-blind channel, blind channel and semi-blind channel estimation [23]. Among them, the performance of the blind channel estimation method is better than the semi-blind channel estimation, but its complexity is quite high and there are not many practical use cases. Non-blind channel estimation is based on pilots or training sequences. In order to track channel changes in real-time and reduce errors, pilot-based channel estimation algorithms are generally used. This method has problems such as high pilot overhead and poor robustness and performs poorly in low signal-to-noise ratio situations.

    The LS algorithm is used in pilot-based channel estimation to obtain the channel at the pilot location. Then, estimate the whole channel through interpolation algorithm and finally get the signal sent by the sender. The channel estimation based on pilot focuses on the design of pilot, the traditional guide frequency design method is fixed, generally using equal interval into the pilot. This pilot arrangement order is manually set, so it is impossible to obtain a lower bit error rate. Aiming at the defects of traditional pilot design, we designed a least square method based on an improved sparrow search algorithm (ISSA-LS). The improved sparrow search algorithm is used to determine the optimal position of pilots, the fitness value is taken as the average bit error rate (BER) of each experiment and ISSA is utilized to identify the pilot arrangement order with the lowest average bit error rate.

    The experimental signal modulation method are phase shift keying modulation (PSK) and quadrature amplitude modulation (QAM), the signal-to-noise ratio is 0-30, the number of subcarriers is 52, the number of guide frequency is 12, the number of population of the improved sparrow search algorithm is taken as 30 and the number of iterations is set to 50 (Figure 3). In 4PSK signals, the LS algorithm reduces the bit error rate to 0 when the SNR (signal-to-noise ratio) is 5, while ISSA-LS already reduces it to 0 when the SNR is 3. In the 8PSK signal, when the SNR reaches 8, the LS method decreases the bit error rate to 0, but ISSA-LS already does so when the ratio is 7. The bit error rate of ISSA-LS is significantly lower than LS at both low and high signal-to-noise ratios when the transmitter uses PSK as the modulation method. The bit error rate in 16QAM signals is reduced to 0 by the LS algorithm at a SNR of 7, whereas it has already fallen to 0 by ISSA-LS at a SNR of 6. As the SNR of 64QAM signals reaches 14, the LS algorithm reduces the bit error rate to 0, whereas the ISSA-LS method has already achieved 0 at 11. The performance of ISSA-LS at low signal-to-noise ratios is comparable to that of the LS algorithm when the modulation mode of the modulation transmitter is QAM. ISSA-LS has a substantially lower bit error rate than LS at high SNR. The performance of ISSA-LS improves as the SNR increases.

    Figure 3.  Bit error rate curve after pilot optimization.

    Figure 4 shows the error bar of the bit error rate curves of ISSA-LS and LS, twenty experiments were conducted, and error bars were drawn based on the mean and standard deviation of the bit error rate at different signal-to-noise ratios. It can be seen that the bit error rate of ISSA-LS algorithm is lower than that of LS. Overall, whether it is PSK modulation or QAM modulation, the least squares method optimized by the improved sparrow search algorithm (ISSA-LS) has a lower bit error rate. The performance is superior to traditional least squares (LS) methods in both low signal-to-noise and high signal-to-noise ratios.

    Figure 4.  Error bar of bit error rate.

    In this paper, a multi-strategy improved sparrow search algorithm is proposed. First, a sparrow population dynamic adjustment strategy is added to dynamically adjust the population size of discoverers and joiners, and with the increase of iterations, more discoverers find foraging directions for the whole population, the number of joiners for global search increases, which facilitates the algorithm to depart from a local optimum. In the position formula of the finders, an update mechanism in the mining stage of the honeypot optimization algorithm is introduced. After changing the location update formula, the algorithm's global search ability increases and can search in a larger range; the update formula of the joiners is perturbed by the perturbation operator and levy flight strategy, which further improves the algorithm's capacity to depart from the local optimum. Finally, the algorithm is tested in 13 test functions to verify the superiority of the algorithm with other algorithms, and the algorithm is applied to the pilot optimization in channel estimation and achieves a lower BER. However, there are some defects in this paper. For instance, the improved algorithm does not achieve better performance on F5, F6, F12 and F13 in the pilot optimization in the channel estimation; and the performance of the improved sparrow search algorithm is equivalent to that of the least square method when the signal-to-noise ratio is low. In a future study, we will strive to use various ways to improve the algorithm and its convergence accuracy in these test functions. The enhanced algorithm will then be applied to pilot optimization to increase the channel estimate accuracy even more.

    The authors declare they have not used Artificial Intelligence (AI) tools in the creation of this article.

    This work is supported by the Tianjin Natural Science Foundation (No. 20JCYBJC00320), College Students' innovation and Entrepreneurship Project (No. 2022SKYZ313, No. 2022SKYZ390) and Innovation and Entrepreneurship Project for College Students.

    The authors declare there is no conflict of interest.


    [1] Hochschild A (2001) Gli spettri del Congo. Re Leopoldo II del Belgio e l'olocausto dimenticato, Milano, Rizzoli.
    [2] De Pascale F, Jourdan L, Kalenge NC (2018) Introduzione. La Repubblica Democratica del Congo: conflitti e problematiche socio-territoriali, Lago: Il Sileno Edizioni, Geographies of the Anthropocene book series, 10-17.
    [3] De Pascale F, Kalenge NC, Bernardo M (2018) Affrontare la sfida geoetica sulla sicurezza ambientale in aree post-conflitto: il caso-studio della Repubblica Democratica del Congo. La Repubblica Democratica del Congo: conflitti e problematiche socio-territoriali, Lago: Il Sileno Edizioni, Geographies of the Anthropocene book series, 113-128.
    [4] De Pascale F, Kalenge NC (2017) The geoethical emergency on personal and environmental security in post-conflict areas: the case study of the Democratic Republic of Congo. Firenze: Società di Studi Geografici, Memorie Geografiche, 755-762.
    [5] Oddi E, La Repubblica Democratica del Congo ad un anno dalle elezioni presidenziali, 2020. Available from: https://www.cesi-italia.org/articoli/1072/la-repubblica-democratica-del-congo-ad-un-anno-dalle-elezioni-presidenziali.
    [6] International Rescue Committee (IRC) (2008) Mortality in the Democratic Republic of Congo: An ongoing crisis, New York: IRC.
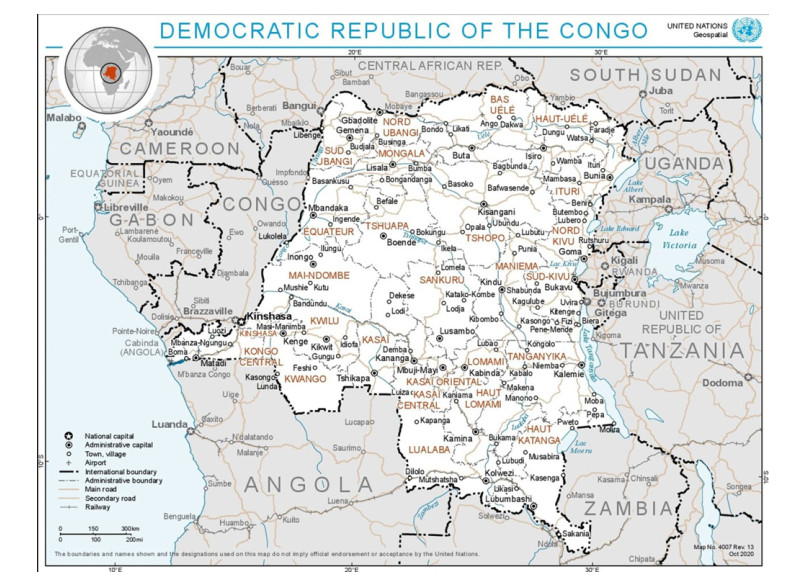
    [7] United Nations, Cartographic Section. Available from: https://www.un.org/Depts/Cartographic/map/profile/drcongo.pdf.
    [8] Birkmann J, Cardona OD, Carreno ML, et al. (2013) Framing vulnerability, risk and societal responses: the MOVE framework. Nat Hazards 67: 193-211. doi: 10.1007/s11069-013-0558-5
    [9] Birkmann J, Kienberger S, Alexander DE (2014) Assessment of Vulnerability to Natural Hazards. A European Perspective, San Diego, CA: Elsevier.
    [10] Braun V, Clarke V (2006) Using thematic analysis in psychology. Qualitative Research in Psychology 3: 77-101. doi: 10.1191/1478088706qp063oa
    [11] Kalenge NC, Bernardo M, De Pascale F (2018) Facing personal and environmental security challenges in post-conflict settings: The case-study of the Democratic Republic of the Congo. Sostenibilità e responsabilità dello sviluppo. Approfondimenti geografici, Roma: Aracne, 19-35.
    [12] Di Capua G, Bobrowsky PT, Kieffer SW, et al. (2021) Geoethics: Status and Future Perspectives, London: Geological Society, Special Publications, 8.
    [13] Peppoloni S, Di Capua G, Bobrowsky P, et al. (2017) Geoethics at the heart of all geoscience. Ann Geophys 60: 7. doi: 10.4401/ag-7473
    [14] Bohle M (2019) Exploring Geoethics. Ethical Implications, Societal Contexts, and Professional Obligations of the Geosciences, Cham: Palgrave Pivot.
    [15] De Pascale F, V Dattilo (2021) The Geoethical Semiosis of the Anthropocene: The Peircean Triad for a Reconceptualization of the Relationship between Human Beings and Environment. Ann Am Assoc Geogr 11: 647-654.
    [16] Marone E, Bohle M (2020) Geoethics for Nudging Human Practices in Times of Pandemics. Sustainability 12: 7271. doi: 10.3390/su12187271
    [17] De Ridder M, Ericsson M, Usanov A, et al. (2013) Coltan, Congo and Conflict: Polinares Case Study, Hague, The Hague Centre for Strategic Studies, HCSS Report.
    [18] Bandarin F, Il Parco dei Virunga nella Repubblica Democratica del Congo. Il Giornale dell'Arte, 2020. Available from: https://www.ilgiornaledellarte.com/articoli/il-parco-dei-virunga-nella-repubblica-democratica-del-congo-/133591.html.
    [19] United Nations Environment Programme (UNEP) (2011) The Democratic Republic of the Congo Post-Conflict Environmental Assessment: Synthesis for Policy Makers, Kenya: UNEP.
    [20] WWF, Bacino del Congo, 2021. Available from: https://www.wwf.it/dove-interveniamo/il-nostro-lavoro-nel-mondo/bacino-del-congo/.
    [21] Réjou-Méchain M, Mortier F, Bastin JF, et al. (2021) Unveiling African rainforest composition and vulnerability to global change. Nature 593: 90-94. doi: 10.1038/s41586-021-03483-6
    [22] Amnesty International, Afrewatch (2016) This is what we die for: Human rights abuses in the Democratic Republic of the Congo power the global trade in cobalt, London. Available from: https://www.amnesty.org/en/documents/afr62/3183/2016/en/.
    [23] UNICEF (2013) To school, not to the mines: Investing in primary education in the Democratic Republic of the Congo. Available from: www.UNICEF.org/education/drcongo_68298.html.
    [24] Marone F (2018) Con gli occhi dei bambini. Infanzia e diritti. La Repubblica Democratica del Congo: conflitti e problematiche socio-territoriali, Lago: Il Sileno Edizioni, Geographies of the Anthropocene book series, 176-194.
    [25] International Labour Office Conference, 104th Session (2015) Report of the Committee of Experts on the Application of Conventions and Recommendations, Geneva: ILO.
    [26] UN (2015) The 2030 Agenda for Sustainable Development: the 17 Goals. Available from: https://sdgs.un.org/goals.
    [27] Jourdan L (2018) Marginalità giovanile e proliferazione delle milizie. Rappresentazioni e riproduzione della violenza nel Nord Kivu? La Repubblica Democratica del Congo: conflitti e problematiche socio-territoriali, Lago: Il Sileno Edizioni, Geographies of the Anthropocene book series, 99-112.
    [28] Berdal M, Malone DM (2000) Greed and Grievance. Economic Agendas in Civil Wars, Boulder-London: Rienner Publishers.
    [29] Van Acker F, Vlassenroot K (2000) Youth and conflict in Kivu: 'Komona clair". The Journal of Humanitarian Assistance. Available from: http://www.jha.ac/greatlakes/b004.htm.
    [30] Bourdieu P (2013) Cose dette. Verso una sociologia riflessiva, Napoli-Salerno: Orthotes Editrice.
    [31] Jewsiewicki B (1998) Les traumatismes des affirmations identitaires, ou la malédiction de ne être rien. Cah d'É tudes Africaines 38: 627-638. doi: 10.3406/cea.1998.1819
    [32] Human Rights Watch (2002) The War Within the War: Sexual Violence against Women and Girls in Eastern Congo, U.S.: Library of Congress.
    [33] Guderzo G (2021) L'inferno dei bambini soldato in Africa. Africa Rivista. Available from: https://www.africarivista.it/linferno-dei-bambini-soldato-in-africa/188497/
    [34] UNICEF (2021) Programme Education. Every child has the right to go to school and learn. Available from: https://www.UNICEF.org/drcongo/en/what-we-do/education.
    [35] Gugg G (2021) RDC: il governo dichiara la fine dell'epidemia di Ebola nel Nord Kivu. Africa Rivista. Available from: https://www.focusonafrica.info/rdc-il-governo-dichiara-la-fine-dellepidemia-di-ebola-nel-nord-kivu/
    [36] OCHA Services, Reliefweb (2021) COVID-19 RDC-12 juillet 2021. Available from: https://reliefweb.int/report/democratic-republic-congo/covid-19-rdc-12-juillet-2021.
    [37] Hamaguchi H, Zana N (1983) Introduction to Volcanoes Nyiragongo and Nyamuragira. In: Hamaguchi H, Ed., Volcanoes Nyiragongo and Nyamuragira: Geophysical Aspects, Sendai, Japan: Tohoku University, Faculty of Science, 1-6.
    [38] Hamaguchi H, Zana N (1990) A great circle distribution of four active hotspots: evidence for deep mantle plumes. Tohoku Geophy J 33: 3-4,251-262.
    [39] Habakaramo P, Mutalegwa G, Kahuranyi J, et al. (2019) Les Volcans des Virunga à l'Est de la République Démocratique du Congo, une perception populaire: un mythe ou une réalité?. In: Gugg G, Dall'O' E, Borriello D, Eds, Disasters in popular cultures, Lago: Il Sileno Edizioni, Geographies of the Anthropocene book series, 102-117.
    [40] Rusangiza BK, Mavonga T, Subira MJ (2017) Analysis of earthquakes swarm and volcanic tremor associated with sismo-volcanic activity at volcano Nyamulagira, Virunga region. Geo Eco Trop 41: 219-232.
    [41] Gugg G (2021) RD Congo, Goma in allarme per l'eruzione del vulcano Nyiragongo. Africa Rivista. Available from: https://www.focusonafrica.info/rd-congo-goma-in-allarme-per-leruzione-del-vulcano-nyiragongo/.
    [42] De Felice F, Colaninno C (2003) Psicologia dell'Emergenza, Milano: FrancoAngeli.
    [43] Barbato R, Puliatti M, Micucci M (2006) Psicologia dell'Emergenza. Manuale di intervento sulle crisi da eventi catastrofici, Roma: Edup.
    [44] UNICEF (2021) Repubblica Democratica del Congo: l'eruzione del vulcano a Goma costringe alla fuga decine di migliaia di famiglie. Available from: https://www.UNICEF.it/media/repubblica-democratica-congo-eruzione-goma-fuga-decine-di-migliaia-di-famiglie/.
    [45] OCHA-RDC (2017) Aperçu des besoins humanitaires. Available from: http://earlyrecovery.global/sites/default/files/drc_hno_2017_1.pdf.
    [46] Kalenge NC, Lupia Palmieri A (2018) Analisi degli impatti degli spostamenti interni forzati sulle Capacità (Capability) degli sfollati congolesi. In: De Pascale F, Jourdan L, Kalenge NC, Eds, La Repubblica Democratica del Congo: conflitti e problematiche socio-territoriali, Lago: Il Sileno Edizioni, Geographies of the Anthropocene book series, 84-98.
    [47] NASA Earth Observatory, Images. Available from: https://earthobservatory.nasa.gov/images/8291/nyamuragira-and-nyiragongo.
    [48] Dattilo V (2018) La questione del mancato riconoscimento durante le guerre della Repubblica Democratica del Congo. In: De Pascale F, Jourdan L, Kalenge NC, Eds, La Repubblica Democratica del Congo: conflitti e problematiche socio-territoriali, Lago: Il Sileno Edizioni, Geographies of the Anthropocene book series, Lago, 50-66.
    [49] Jourdan L, Kalenge NC, De Pascale F (2018) Conclusioni: dove va il Congo?. In: De Pascale F, Jourdan L, Kalenge NC, Eds, La Repubblica Democratica del Congo: conflitti e problematiche socio-territoriali, Lago: Il Sileno Edizioni, Geographies of the Anthropocene book series, 212-216.
    [50] Rognoni MS (2021) Repubblica Democratica del Congo: sessant'anni di instabilità. Istituto per gli Studi di Politica Internazionale. Available from: https://www.ispionline.it/it/pubblicazione/repubblica-democratica-del-congo-sessantanni-di-instabilita-29416.
    [51] Pope Francis (2015) Lettera Enciclica sulla cura della casa comune - Laudato si', Città del Vaticano: Libreria Editrice Vaticana.
    [52] Lugeri FR, Farabollini P (2018) Discovering the Landscape by Cycling: A Geo-Touristic Experience through Italian Badlands. Geosciences 8: 291. doi: 10.3390/geosciences8080291
    [53] Lewis J, Kelman I (2012) The Good, The Bad and The Ugly: Disaster Risk Reduction (DRR) Versus Disaster Risk Creation (DRC). PLoS Curr 21.
    [54] Le Pivain T (2021) DRC makes strides in adaptation planning and validates a first National Adaptation Plan. PreventionWeb. Available from: https://www.preventionweb.net/news/drc-makes-strides-adaptation-planning-and-validates-first-national-adaptation-plan.
    [55] Greiner AL, Dematteis G, Lanza C (2016) Geografia umana. Un approccio visuale (seconda edizione), Novara: De Agostini Scuola.
  • This article has been cited by:

    1. Qinghua Li, Hu Shi, Wanting Zhao, Chunlu Ma, Enhanced Dung Beetle Optimization Algorithm for Practical Engineering Optimization, 2024, 12, 2227-7390, 1084, 10.3390/math12071084
    2. Kun Li, Hao Wu, Xinming Liu, Jianing Xu, Ying Han, Intelligent Diagnosis of Rolling Bearing Based on ICEEMDAN-WTD of Noise Reduction and Multi-Strategy Fusion Optimization SCNs, 2024, 12, 2169-3536, 36908, 10.1109/ACCESS.2024.3373554
    3. Ya‐Kun Zhang, Jian‐Bo Tong, Ze‐Lei Chang, Jing Yan, Xiao‐Yu Xing, Yu‐Lu Yang, Zhan Xue, QSAR Modeling of Pyridone Derivatives as α‐amylase Inhibitors Using Chemical Descriptors and Machine Learning, 2025, 10, 2365-6549, 10.1002/slct.202404214
    4. Fengtao Wei, Yue Feng, Xin Shi, Kai Hou, Improved sparrow search algorithm with adaptive multi-strategy hierarchical mechanism for global optimization and engineering problems, 2025, 28, 1386-7857, 10.1007/s10586-024-04883-9
  • Reader Comments
  • © 2021 the Author(s), licensee AIMS Press. This is an open access article distributed under the terms of the Creative Commons Attribution License (http://creativecommons.org/licenses/by/4.0)
通讯作者: 陈斌, bchen63@163.com
  • 1. 

    沈阳化工大学材料科学与工程学院 沈阳 110142

  1. 本站搜索
  2. 百度学术搜索
  3. 万方数据库搜索
  4. CNKI搜索

Metrics

Article views(3096) PDF downloads(95) Cited by(0)

Figures and Tables

Figures(3)

Other Articles By Authors

/

DownLoad:  Full-Size Img  PowerPoint
Return
Return

Catalog