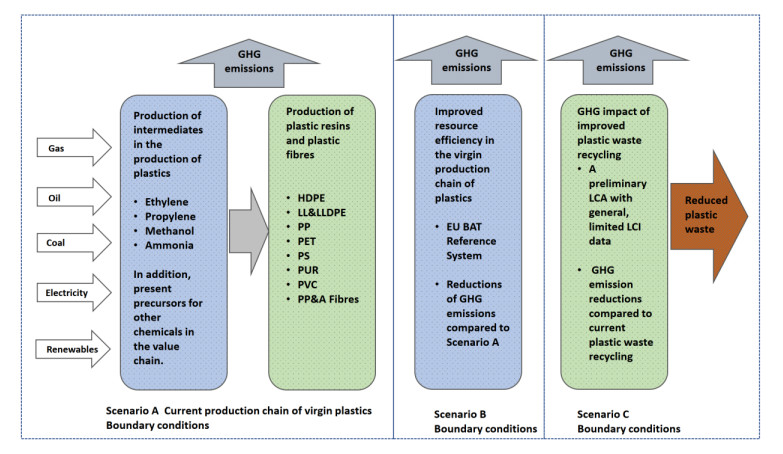
This study focuses on the possibilities to abate greenhouse gas emissions in the value chain of plastics with special emphasis on efficiency improvements in the virgin plastics production and to recycle or reuse/regenerate plastics from waste streams. The study is restricted to the plastics and their intermediates produced in annual quantities over 20 million tons (Mt) on global scale. The chemicals and polymers considered include intermediate feedstocks ammonia, methanol, ethene and propene, polyolefins polyethylene and polypropylene, and other included polymers are polyester, polyamide and acrylic fibres, polyvinylchloride, polyethylene terephthalate, polyurethane resin and polystyrene. Improved efficiency in the virgin plastic value chain has the potential to reduce global greenhouse gas (GHG) emissions by 531 Mt CO2eq/y, provided that all of the current global production is upgraded to meet the European Union's best benchmarked facilities. These improvements would mean a 15.4% reduction of all global chemical sector emissions. The evaluation of probability for all global production facilities to reach the EU benchmarked values is excluded as unclear. Increasing the global recycling rate of plastics from the current 18% to 42% would reduce global greenhouse gas emissions by 142.3 Mt CO2eq /a, provided that the segregation of recyclable materials is improved, and that incineration is not increased. These downstream improvements would mean a 4% reduction of all global chemical sector emissions and reduce the accumulation of plastics not only on land but also in the oceans.
Citation: R. Kajaste, P. Oinas. Plastics value chain - Abatement of greenhouse gas emissions[J]. AIMS Environmental Science, 2021, 8(4): 371-392. doi: 10.3934/environsci.2021024
This study focuses on the possibilities to abate greenhouse gas emissions in the value chain of plastics with special emphasis on efficiency improvements in the virgin plastics production and to recycle or reuse/regenerate plastics from waste streams. The study is restricted to the plastics and their intermediates produced in annual quantities over 20 million tons (Mt) on global scale. The chemicals and polymers considered include intermediate feedstocks ammonia, methanol, ethene and propene, polyolefins polyethylene and polypropylene, and other included polymers are polyester, polyamide and acrylic fibres, polyvinylchloride, polyethylene terephthalate, polyurethane resin and polystyrene. Improved efficiency in the virgin plastic value chain has the potential to reduce global greenhouse gas (GHG) emissions by 531 Mt CO2eq/y, provided that all of the current global production is upgraded to meet the European Union's best benchmarked facilities. These improvements would mean a 15.4% reduction of all global chemical sector emissions. The evaluation of probability for all global production facilities to reach the EU benchmarked values is excluded as unclear. Increasing the global recycling rate of plastics from the current 18% to 42% would reduce global greenhouse gas emissions by 142.3 Mt CO2eq /a, provided that the segregation of recyclable materials is improved, and that incineration is not increased. These downstream improvements would mean a 4% reduction of all global chemical sector emissions and reduce the accumulation of plastics not only on land but also in the oceans.

| [1] |
Broeren MLM, Saygin D, Patel MK (2014) Forecasting global developments in the basic chemical industry for environmental policy analysis. Energy Policy 64: 273-287. doi: 10.1016/j.enpol.2013.09.025

|
| [2] |
Jambeck JR, Geyer R, Wilcox C, et al. (2015) Plastic waste inputs from land into the ocean. Science 347: 768-771. doi: 10.1126/science.1260352
|
| [3] | Ryberg MW, Hauschild, MZ, Wang F, et al. (2019) Global environmental losses of plastics across their value chains. J Res Con Rec 151: 1-10. |
| [4] | Kaza S, Yao L, Bhada-Tata P, et al. Washington. What a Waste 2.0: A Global Snapshot of Solid Waste Management to 2050. The World Bank, Washington. |
| [5] | WWF (2019) Solving Plastic Pollution Through Accountability. A WWF Report, Gland, Switzerland. |
| [6] | Ciel (2019) Plastic&Climate the hidden costs of a plastic planet. available from www.ciel.org/plasticandclimate. |
| [7] |
Cox KD, Covernton GA, Davies HL, et al. (2019) Human Consumption of Microplastics. Environ Sci Technol 53: 7068-7074. doi: 10.1021/acs.est.9b01517
|
| [8] | EMF (2020) Ellen Macarthur Foundation, The Global Commitment 2020 Progress Report. Available from www.ellenmacarthurfoundation.org. |
| [9] |
Di J, Reck BK, Miatto A, et al. (2021) United States plastics: Large flows, short lifetimes, and negligible recycling. Resour Conserv Recyc 167: 105440 doi: 10.1016/j.resconrec.2021.105440
|
| [10] | IEA (2017) Energy Technology Perspectives 2017. Catalysing Energy Technology Transformations. IEA/OECD, Paris. |
| [11] | IEA, ICCA, Dechema (2013) Technology Roadmap: Energy and GHG Reductions in the Chemical Industry via Catalytic Processes. OECD/IEA, Paris. |
| [12] |
Al-Salem SM, Antelava A, Constantinou A, et al. (2017) A review on thermal and catalytic pyrolysis of plastic solid waste (PSW). J Env Manag 197: 177-198. doi: 10.1016/j.jenvman.2017.03.084
|
| [13] |
Faussone GC (2018) Transportation fuel from plastic: Two cases of study. Waste Manage 73: 416-423. doi: 10.1016/j.wasman.2017.11.027
|
| [14] |
Jeswani H, Krüger C, Russ M, et al. (2019) Life cycle environmental impacts of chemical recycling via pyrolysis of mixed plastic waste in comparison with mechanical recycling and energy recovery. Sci Total Environ 769: 144483. doi: 10.1016/j.scitotenv.2020.144483
|
| [15] |
Solis M, Silveira S (2020) Technologies for chemical recycling of household plastics - A technical review and TRL assessment. Waste Manage 105: 128-138. doi: 10.1016/j.wasman.2020.01.038
|
| [16] | BGC (2019) Boston Consulting Group, Rubel H, Jung U, Follette C, et al. Circular Solution To Plastic Waste, July 2019. |
| [17] |
Faraca G, Martinez-Sanchezb V, Astrup TF (2019) Environmental life cycle cost assessment: Recycling of hard plastic waste collected at Danish recycling centres. Resour Conserv Recyc 143: 299-309. doi: 10.1016/j.resconrec.2019.01.014
|
| [18] |
Mohammadi M, Jämsä-Jounela SL, Harjunkoski I (2019) Sustainable Supply Chain Network Design for the Optimal Utilization of Municipal Solid Waste. AIChE J 65: 1-19. doi: 10.1002/aic.16464
|
| [19] |
Burnley S, Coleman T (2018) The environmental and financial benefits of recovering plastics from residual municipal waste before energy recovery. Waste Manag 79: 79-86. doi: 10.1016/j.wasman.2018.07.034
|
| [20] |
Foster G (2019) Low-Carbon Futures for Bioethylene in the United States. Energies 12: 1958. doi: 10.3390/en12101958
|
| [21] |
Rorrer NA, Nicholson S, Carpenter A, et al. (2019) Combining Reclaimed PET with Bio-based Monomers Enables Plastics Upcycling. Joule 3: 1006-1027. doi: 10.1016/j.joule.2019.01.018
|
| [22] |
Semba T, Sakai S, Sakanishi T, et al. (2018) Greenhouse gas emissions of 100% bio-derived polyethylene terephthalate on its life cycle compared with petroleum-derived polyethylene terephthalate. J Clean Prod 195: 932-938. doi: 10.1016/j.jclepro.2018.05.069
|
| [23] |
Valderrama MAM, van Putten RJ, Gruter GJM (2019) The potential of oxalic - and glycolic acid based polyesters (review). Towards CO2 as a feedstock (Carbon Capture and Utilization - CCU). European Polym J 119: 445-468. doi: 10.1016/j.eurpolymj.2019.07.036
|
| [24] |
Tonini D, Schrijvers D, Nessi S, et al. (2021) Carbon footprint of plastic from biomass and recycled feedstock: methodological insights. Int J Life Cyc Assmt 26: 221-237. doi: 10.1007/s11367-020-01853-2
|
| [25] |
Benavides PT, Dunn JB, Han J, et al. (2018) Exploring Comparative Energy and Environmental Benefits of Virgin, Recycled, and Bio-Derived PET Bottles. ACS Sust Chem Eng 6: 9725−9733. doi: 10.1021/acssuschemeng.8b00750
|
| [26] |
Chen L, Pelton REO, Smith TM (2016) Comparative life cycle assessment of fossil and bio-based polyethylene terephthalate (PET) bottles. J Clean Prod 137: 667-676. doi: 10.1016/j.jclepro.2016.07.094
|
| [27] |
Blank LM, Narancic T, Mampel J, et al. (2020) Biotechnological upcycling of plastic waste and other non-conventional feedstocks in a circular economy. Curr Opin Biotechnol 62: 212-219. doi: 10.1016/j.copbio.2019.11.011
|
| [28] |
Walker S, Rothman R (2020) Life cycle assessment of bio-based and fossil-based plastic: A review. J Clean Prod 261: 121158. doi: 10.1016/j.jclepro.2020.121158
|
| [29] |
Nicholson SR, Rorrer NA, Carpenter AC, et al. (2021) Manufacturing energy and greenhouse gas emissions associated with plastics consumption. Joule 5: 673-686. doi: 10.1016/j.joule.2020.12.027
|
| [30] | European Bioplastics (2018) Bioplastics-Facts and Figures. European Bioplastics, Berlin. Plastic - the facts 2019 available from https://plasticseurope.org. |
| [31] | USGS (2017) U.S. Mineral Commodity Summaries. U.S. Geological Survey Publication. Jan 2017: 119. |
| [32] | IHS (2016b) Urea-chemical-economics-handbook. https://ihsmarkit.com/products (accessed 24.6.2019). |
| [33] | ECI (2016) http://www.essentialchemicalindustry.org/chemicals/ammonia.html (accessed 16.10.2018). |
| [34] |
Räuchle K, Plass L, Wernicke HJ, et al. (2016) Methanol for renewable energy storage and utilization. Energ Technol 4: 193-200. doi: 10.1002/ente.201500322
|
| [35] | IHS (2016c) Methanol, Marc Alvarado, February 2016. Available from: http://www.methanol.org/wpcontent/uploads/2016/07/Marc-Alvarado-Global-Methanol-February-2016-IMPCA-for-uploadto-website.pdf. |
| [36] | IHS (2017) Ethylene-chemical-economics-handbook. https://ihsmarkit.com/products (accessed 16.10.2018). |
| [37] | IHS (2016a) Propylene-chemical-economics-handbook. https://ihsmarkit.com/products (accessed 24.6.2019). |
| [38] |
Geyer R, Jambeck JR, Law KL (2017) Production, use, and fate of all plastics ever made. Sci Adv 3: e1700782. doi: 10.1126/sciadv.1700782
|
| [39] |
Levi P G, Cullen J M (2018) Mapping Global Flows of Chemicals: From Fossil Fuel Feedstocks to Chemical Products. Environ Sci Technol 52: 1725−1734. doi: 10.1021/acs.est.7b04573
|
| [40] | ISO (2006a) Environmental Management-Life Cycle Assessment-Principles and Framework. ISO 14040: 2006. ISO/IEC. |
| [41] | ISO (2006b) Environmental Management-Life Cycle Assessment-Requirements and Guidelines. ISO 14044: 2006. ISO/IEC. |
| [42] | Tallentire C W, Steubing B (2020) The environmental benefits of improving pack- aging waste collection in Europe. Waste Manage 103: 426-436. https://doi.org/10.1016/j.wasman.2019.12.045. |
| [43] | UNEP (2018) The Emissions Gap Report 2018. United Nations Environment Programme, Nairobi. |
| [44] | Bergsma G (2019) Chemical recycling and its CO2 reduction potential. CE Delft. Available from www.ce.nl. |
| [45] | Boulamanti A, Moya JA (2017) Energy efficiency and GHG emissions: Prospective scenarios for the chemical and petrochemical industry. Report 9789279657344, EU Science Hub |
| [46] | IPCC (2006) Intergovernmental Panel on Climate Change (IPCC), 2006 IPCC Guidelines for National Greenhouse Gas Inventories. Volume 3 - Industrial Processes and Product Use, Chapter 3 - Chemical Industry Emissions. |
| [47] |
Patel MK, Bechu A, Villegas JD, et al. (2018) Second-generation bio-based plastics are becoming a reality -Non-renewable energy and greenhouse gas (GHG) balance of succinic acid based plastic end products made from lignocellulosic biomass Biofuels. Bioprod Bioref 12: 426-441. doi: 10.1002/bbb.1849
|
| [48] | CAT (2018) http://www.catalystgrp.com.PROP-Ammonia-Production-April-2018.pdf (accessed 28.6.2019). |
| [49] |
Matzen M, Mahdi A, Demirel Y (2015) Chemical storage of wind energy by renewable methanol production: Feasibility analysis using a multi-criteria decision matrix. Energy 93: 343-353. doi: 10.1016/j.energy.2015.09.043
|
| [50] |
Su LW, Li XR, Sun ZY (2013) Flow chart of methanol in China. Renew. Sust Energ Rev 28: 541-550. doi: 10.1016/j.rser.2013.08.020
|
| [51] |
Kajaste R, Hurme M, Oinas P (2018) Methanol - Managing greenhouse gas emissions in the production chain by optimizing the resource base. AIMS Energy 6: 1074-1102. doi: 10.3934/energy.2018.6.1074
|
| [52] | Ruuska A (Eds.) (2013) Carbon footprint for building products. VTT Technology 115, Espoo. |
| [53] |
Ghanta M, Fahey D, Subramaniam B (2014) Environmental impacts of ethylene production from diverse feedstocks and energy sources. Appl. Petrochem Res 4: 167-179. doi: 10.1007/s13203-013-0029-7
|
| [54] | AI (2019) https://ammoniaindustry.com (accessed 28.6.2019). |
| [55] |
Andersson J, Lundgren J, Marklund M (2014) Methanol production via pressurized entrained flow biomass gasification-Techno-economic comparison of integrated vs. stand-alone production. Biomass Bioenerg 64: 256-268. doi: 10.1016/j.biombioe.2014.03.063
|
| [56] |
Melin K, Kohl T, Koskinen J, et al. (2016) Enhanced biofuel processes utilizing separate lignin and carbohydrate processing of lignocellulose. Biofuels 7: 31-54. doi: 10.1080/17597269.2015.1118777
|
| [57] | TFC (2021) http://timeforchange.org/plastic-bags-and-plastic-bottles-co2-emissions-during-their-lifetime/ (accessed 20.2.2021). |
| [58] |
Zheng J, Suh S (2019) Strategies to reduce the global carbon footprint of plastics. Nature Climate Change 9: 374-378. doi: 10.1038/s41558-019-0459-z
|
| [59] |
Cascone S, Ingrao C, Valenti F, et al. (2020) Energy and environmental assessment of plastic granule production from recycled greenhouse covering films in a circular economy perspective. J Env Manag 254: 109796. doi: 10.1016/j.jenvman.2019.109796
|
 Environ-08-04-24-s1.pdf Environ-08-04-24-s1.pdf |
 |


Figures(7) / Tables(6)

R. Kajaste, P. Oinas. Plastics value chain - Abatement of greenhouse gas emissions[J]. AIMS Environmental Science, 2021, 8(4): 371-392. doi: 10.3934/environsci.2021024


 DownLoad: