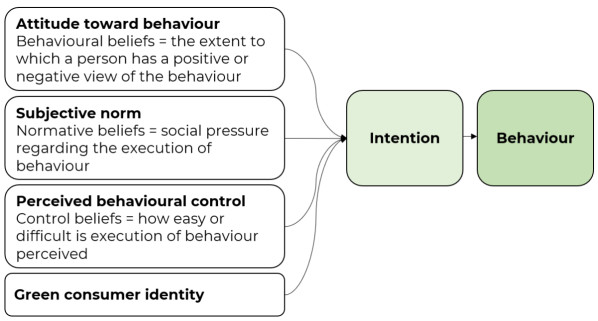
The lack of affordable housing and the considerable negative environmental impact of the housing sector pose significant challenges for policymakers. Tiny houses have been proposed as a potential solution, but there is still limited understanding of consumer behaviour and attitudes towards such solutions. This study looked at the adoption of tiny houses in Germany by applying the Theory of Planned Behaviour as a theoretical framework to explore demographic and socio-economic factors, motivations, and barriers for living in tiny houses. Data was collected through interviews and an online survey. The results showed a statistically significant positive relationship between intention to live in a tiny house and age, and a significant negative relationship between intention and current accommodation size. Main motivations found in this research were sustainability, cost reduction, freedom, minimalism, mobility, and a sense of community. The main barriers included legal restrictions and a negative perception of minimalism. The lessons learned from this research were: (1) COVID-19 had a negative impact on about 40% of participants, but a statistically significant positive impact on those who were already interested in small houses. (2) Although tiny houses located in cities would be preferable to meet the need for well-connected, high-density housing solutions for young and elderly people and to alleviate the housing shortage, most people seem to be interested in rather rural tiny houses. (3) Minimalism is both a motivator and a barrier to interest in tiny houses, but with a societal shift towards sustainability could become more of a motivator. (4) Interest in tiny homes often builds on financial constraints and limited alternative housing options. (5) The Theory of Planned Behaviour proved to be a sound theoretical framework for this research.
Citation: Véronique Vasseur, Jessica Sing, Samuel W. Short. Determinants of the adoption of tiny houses and their role in alleviating housing shortages in Germany[J]. Clean Technologies and Recycling, 2022, 2(4): 199-224. doi: 10.3934/ctr.2022011
The lack of affordable housing and the considerable negative environmental impact of the housing sector pose significant challenges for policymakers. Tiny houses have been proposed as a potential solution, but there is still limited understanding of consumer behaviour and attitudes towards such solutions. This study looked at the adoption of tiny houses in Germany by applying the Theory of Planned Behaviour as a theoretical framework to explore demographic and socio-economic factors, motivations, and barriers for living in tiny houses. Data was collected through interviews and an online survey. The results showed a statistically significant positive relationship between intention to live in a tiny house and age, and a significant negative relationship between intention and current accommodation size. Main motivations found in this research were sustainability, cost reduction, freedom, minimalism, mobility, and a sense of community. The main barriers included legal restrictions and a negative perception of minimalism. The lessons learned from this research were: (1) COVID-19 had a negative impact on about 40% of participants, but a statistically significant positive impact on those who were already interested in small houses. (2) Although tiny houses located in cities would be preferable to meet the need for well-connected, high-density housing solutions for young and elderly people and to alleviate the housing shortage, most people seem to be interested in rather rural tiny houses. (3) Minimalism is both a motivator and a barrier to interest in tiny houses, but with a societal shift towards sustainability could become more of a motivator. (4) Interest in tiny homes often builds on financial constraints and limited alternative housing options. (5) The Theory of Planned Behaviour proved to be a sound theoretical framework for this research.

| [1] | Destatis, Housing stock at the end of 2019: 42.5 million apartments. Increase of 0.7% or 277,400 dwellings compared to 2018 (in Deutsch). Statistisches Bundesamt, 2020. Available from: https://www.destatis.de/DE/Presse/Pressemitteilungen/2020/07/PD20_281_31231.html. |
| [2] |
Ingram DJ (2020) Tracey Harris, the tiny house movement: Challenging our consumer culture. Hum Ecol 48: 639–640. https://doi.org/10.1007/s10745-020-00194-w doi: 10.1007/s10745-020-00194-w

|
| [3] |
Crawford RH, Stephan A (2020) Tiny house, tiny footprint? The potential for tiny houses to reduce residential greenhouse gas emissions. IOP Conf Ser Earth Environ Sci 588: 022073. https://doi.org/10.1088/1755-1315/588/2/022073 doi: 10.1088/1755-1315/588/2/022073
|
| [4] | International Energy Agency and the United Nations Environment Programme, 2018 Global Status Report: Towards a zero-emission, efficient and resilient buildings and construction sector. UNEP, 2018. Available from: https://wedocs.unep.org/handle/20.500.11822/27140. |
| [5] | Statista Research Department, House price index for Germany up to 2020 (in Deutsch). Statista Research Department, 2021. Available from: https://de.statista.com/statistik/daten/studie/70265/umfrage/haeuserpreisindex-in-deutschland-seit-2000/. |
| [6] | van Sparrentak K, Tackling Europe's housing crisis: What would it mean if housing were a fundamental right? Organisation for Economic Co-operation and Development, 2021. Available from: https://www.oecd-forum.org/posts/tackling-europe-s-housing-crisis. |
| [7] | Lutz E (2020) Discussion paper for the foundation for the rights of future generations—The housing crisis as a problem of intergenerational justice: The case of Germany. IGJR 6: 24–30. |
| [8] | Deschermeier P, Henger R, Seipelt B, et al. Housing shortage in the cities, vacancies in the country (in Deutsch). IW-Kurzbericht, 2017. Available from: https://www.econstor.eu/bitstream/10419/162545/1/890554145.pdf. |
| [9] |
Shearer H, Burton P (2019) Towards a typology of tiny houses. Hous Theory Soc 36: 298–318. https://doi.org/10.1080/14036096.2018.1487879 doi: 10.1080/14036096.2018.1487879
|
| [10] | 2018 International Residential Code, Appendix Q tiny houses. International Code Council, 2017. Available from: https://codes.iccsafe.org/content/IRC2018/appendix-q-tiny-houses |
| [11] |
Boeckermann LM, Kaczynski AT, King SB (2019) Dreaming big and living small: examining motivations and satisfaction in tiny house living. J Hous Built Environ 34: 61–71. https://doi.org/10.1007/s10901-018-9616-3 doi: 10.1007/s10901-018-9616-3
|
| [12] | Mingoya CA (2015) Building together: Tiny house villages for the homeless: A comparative case study[PhD's thesis]. Massachusetts Institute of Technology, USA. |
| [13] | Harris T (2018) The Tiny House Movement: Challenging Our Consumer Culture, Lanham: Rowman & Littlefield. |
| [14] | Carlin TM (2014) Tiny homes: Improving carbon footprint and the American lifestyle on a large scale, Celebrating Scholarship & Creativity Day, Collegeville: College of Saint Benedict and Saint John's University. |
| [15] | Kilman C (2016) Small house, big impact: the effect of tiny houses on community and environment. UJHS 2: 1–12. |
| [16] | Mutter A (2013) Growing tiny houses: Motivations and opportunities for expansion through niche markets[Master's thesis]. Lund University—University of Manchester—University of the Aegean—Central European University, Sweden. |
| [17] |
Salas DA, Ramirez AD, Rodriguez CR, et al. (2016) Environmental impacts, life cycle assessment and potential improvement measures for cement production: a literature review. J Cleaner Prod 113: 114–122. https://doi.org/10.1016/j.jclepro.2015.11.078 doi: 10.1016/j.jclepro.2015.11.078
|
| [18] | European Environment Agency, Urban soil sealing in Europe. EEA, 2011. Available from: https://www.eea.europa.eu/articles/urban-soil-sealing-in-europe. |
| [19] | Hooper N, Moreno-Beals M, Altschul D, et al. Affordable and Sustainable Housing Solutions for Michigan Communities. Michigan State University, 2019. Available from: https://reicenter.org/upload/documents/colearning/tiny-houses_web.pdf. |
| [20] |
Cohen MJ (2021) New conceptions of sufficient home size in high-income countries: Are we approaching a sustainable consumption transition? Hous Theory Soc 38: 173–203. https://doi.org/10.1080/14036096.2020.1722218 doi: 10.1080/14036096.2020.1722218
|
| [21] | Interhyp AG, Eco-house, tiny house and Co.: Study shows trend towards sustainable and alternative forms of living (in Deutsch). Clever-immobilien, 2019. Available from: https://www.clever-immobilien.de/artikel/energie-und-umwelt/oekohaus-tiny-house-und-co-studie-zeigt-trend-zu-nachhaltigen-und-alternativen-wohnformen-foto/85.html. |
| [22] | Sackmann C, Tiny House: The trend towards tiny homes is becoming a billion dollar market (in Deutsch). FOCUS Online, 2021. Available from: https://www.focus.de/immobilien/deutsches-baurecht-ist-kompliziert-tiny-haeuser-auf-dem-weg-zum-milliardenmarkt-in-deutschland-sind-die-huerden-hoch_id_13211266.html. |
| [23] | Brecht C, Wagner J, First market study on tiny houses published in Germany—data and facts provide a deep insight into the world of tiny living (in Deutsch). LIVEE in cooperation with Tiny House Verband, 2021. Available from: https://www.hypzert.de/de/service/news/marktstudie-zu-tiny-houses-deutschland-veroeffentlicht. |
| [24] |
Mangold S, Zschau T (2019) In search of the "good life": The appeal of the tiny house lifestyle in the USA. Soc Sci 8: 26. https://doi.org/10.3390/socsci8010026 doi: 10.3390/socsci8010026
|
| [25] | Jebbink M (2019) Life in a shoebox: About people and their motivation to go tiny. A qualitative interview study on the intrinsic and extrinsic motivations to follow the tiny house lifestyle[Bachelor's thesis]. University of Twente, Netherlands. |
| [26] | Shearer H (2018) Tiny houses: Planning for affordability and inclusion. 2018 Joint Asia-Pacific Network for Housing Research and Australasian Housing Researchers Conference, Gold Coast, Queensland, Australia, 7–20. |
| [27] | Böllert PS (2019) Motivations to build a tiny house and continue despite obstacles-a multiple qualitative methods study[Bachelor's thesis]. University of Twente, Netherlands. |
| [28] |
Ford J, Gomez-Lanier L (2017) Are tiny homes here to stay? A review of literature on the tiny house movement. Fam Consum Sci Res J 45: 394–405. https://doi.org/10.1111/fcsr.12205 doi: 10.1111/fcsr.12205
|
| [29] | Tiny House Helden, Obstacles and limits in the world of tiny houses (in Deutsch). Tiny House Helden, 2021. Available from: https://www.tiny-house-helden.de/tiny-wissen/huerden-und-grenzen-in-der-welt-der-tiny-houses/. |
| [30] |
Kaas L, Kocharkov G, Preugschat E, et al. (2021) Low homeownership in Germany—A quantitative exploration. J Eur Econ Assoc 19: 128–164. https://doi.org/10.1093/jeea/jvaa004 doi: 10.1093/jeea/jvaa004
|
| [31] |
Bayrakdar S, Coulter R, Lersch P, et al. (2019) Family formation, parental background and young adults' first entry into homeownership in Britain and Germany. Hous Stud 34: 974–996. https://doi.org/10.1080/02673037.2018.1509949 doi: 10.1080/02673037.2018.1509949
|
| [32] | Cambridge Business English Dictionary, Definition of the property ladder. Cambridge University Press, 2021. Available from: https://dictionary.cambridge.org/dictionary/english/property-ladder. |
| [33] | D'Alessandro D, Gola M, Letizia A, et al. (2020) COVID-19 and living spaces challenge. Well-being and public health recommendations for a healthy, safe, and sustainable housing. Acta Biomed 91: 61–75. |
| [34] |
Amerio A, Brambilla A, Morganti A, et al. (2020) COVID-19 lockdown: housing built environment's effects on mental health. Int J Environ Res Public Health 17: 5973. https://doi.org/10.3390/ijerph17165973 doi: 10.3390/ijerph17165973
|
| [35] |
Tušl M, Brauchli R, Kerksieck P, et al. (2021) Impact of the COVID-19 crisis on work and private life, mental well-being and self-rated health in German and Swiss employees: a cross-sectional online survey. BMC Public Health 21: 741. https://doi.org/10.1186/s12889-021-10788-8 doi: 10.1186/s12889-021-10788-8
|
| [36] |
Dubey AD, Tripathi S (2020) Analysing the sentiments towards work-from-home experience during COVID-19 pandemic. J Innov Manag 8: 13–19. https://doi.org/10.24840/2183-0606_008.001_0003 doi: 10.24840/2183-0606_008.001_0003
|
| [37] |
Vasseur V, Marique AF (2019) Households' willingness to adopt technological and behavioral energy savings measures: An empirical study in the Netherlands. Energies 12: 4294. https://doi.org/10.3390/en12224294 doi: 10.3390/en12224294
|
| [38] |
Black JS, Stern PC, Elworth JT (1985) Personal and contextual influences on househould energy adaptations. J Appl Psychol 70: 3. https://doi.org/10.1037/0021-9010.70.1.3 doi: 10.1037/0021-9010.70.1.3
|
| [39] |
Stern P (2000) Toward a coherent theory of environmentally significant behavior. J Soc Issues 56: 407–424. https://doi.org/10.1111/0022-4537.00175 doi: 10.1111/0022-4537.00175
|
| [40] |
Olander F, Thogersen J (1995) Understanding of consumer behaviour as a prerequisite for environmental protection. J Consum Policy 18: 345–385. https://doi.org/10.1007/BF01024160 doi: 10.1007/BF01024160
|
| [41] |
Ajzen I (1991) The theory of planned behavior. Organ Behav Hum Decis Process 50: 179–211. https://doi.org/10.1016/0749-5978(91)90020-T doi: 10.1016/0749-5978(91)90020-T
|
| [42] | Schwartz SH (1977) Normative influences on altruism, In: Berkowitz L, Advances in Experimental Social Psychology, Amsterdam: Elsevier, 10: 221–279. https://doi.org/10.1016/S0065-2601(08)60358-5 |
| [43] | Lange P, Kruglanski A, Higgins E (2012) The theory of planned behavior, In: Ajzen I, Handbook of Theories of Social Psychology, 1 Ed., London: Sage, 438–459. https://doi.org/10.4135/9781446249215.n22 |
| [44] |
Harland P, Staats H, Wilke HA (1999) Explaining proenvironmental intention and behavior by personal norms and the Theory of Planned Behavior. J Appl Soc Psychol 29: 2505–2528. https://doi.org/10.1111/j.1559-1816.1999.tb00123.x doi: 10.1111/j.1559-1816.1999.tb00123.x
|
| [45] |
Scott FL, Jones CR, Webb TL (2014) What do people living in deprived communities in the UK think about household energy efficiency interventions? Energ Policy 66: 335–349. https://doi.org/10.1016/j.enpol.2013.10.084 doi: 10.1016/j.enpol.2013.10.084
|
| [46] |
Kalafatis SP, Pollard M, East R, et al. (1999) Green marketing and Ajzen's theory of planned behaviour: a cross-market examination. J Consum Mark 16: 441–460. https://doi.org/10.1108/07363769910289550 doi: 10.1108/07363769910289550
|
| [47] |
Judge M, Warren-Myers G, Paladino A (2019) Using the theory of planned behaviour to predict intentions to purchase sustainable housing. J Cleaner Prod 215: 259–267. https://doi.org/10.1016/j.jclepro.2019.01.029 doi: 10.1016/j.jclepro.2019.01.029
|
| [48] |
Vermeir I, Verbeke W (2008) Sustainable food consumption among young adults in Belgium: Theory of planned behaviour and the role of confidence and values. Ecol Econ 64: 542–553. https://doi.org/10.1016/j.ecolecon.2007.03.007 doi: 10.1016/j.ecolecon.2007.03.007
|
| [49] | Ajzen I, Fishbein M (1980) Understanding Attitudes and Predicting Social Behavior, Upper Saddle River: Prentice-Hall. |
| [50] |
Alam SS, Sayuti NM (2011) Applying the Theory of Planned Behavior (TPB) in halal food purchasing. Int J Commer Bus 21: 8–20. https://doi.org/10.1108/10569211111111676 doi: 10.1108/10569211111111676
|
| [51] |
Whitmarsh L, O'Neill S (2010) Green identity, green living? The role of pro-environmental self-identity in determining consistency across diverse pro-environmental behaviours. J Environ Psychol 30: 305–314. https://doi.org/10.1016/j.jenvp.2010.01.003 doi: 10.1016/j.jenvp.2010.01.003
|
| [52] | Sing J (2020) Socio-Economic Determinants of Pro-Environmental Behavior in the Case of Brazil, Maastricht: Maastricht University. |
| [53] | Saldaña J (2016) The Coding Manual for Qualitative Researchers, 3Ed., London: Sage. |
| [54] | Patten ML, Newhart M (2018) Grounded theory and research design, Understanding Research Methods: An Overview of the Essentials, 10 Ed., New York: Routledge. https://doi.org/10.4324/9781315213033 |
| [55] | Patten ML, Newhart M (2018) Descriptive and inferential statistics, Understanding Research Methods: An Overview of the Essentials, 10 Ed., New York: Routledge. https://doi.org/10.4324/9781315213033 |
| [56] | Burke N, A Student Village Made of Container Homes in Copenhagen by CPH. Humble Homes, 2016. Available from https://www.humble-homes.com/a-student-village-made-of-container-homes-in-copenhagen-by-cph/. |
| [57] | Ronald R, Lennartz C (2019) Housing careers, intergenerational support and family relations, Housing Careers, Intergenerational Support and Family Relations, 1 Ed., Hague: Taylor & Francis. https://doi.org/10.4324/9780429292361-1 |
| [58] |
Doling J, Ronald R (2010) Home ownership and asset-based welfare. J Hous Built Environ 25: 165–173. https://doi.org/10.1007/s10901-009-9177-6 doi: 10.1007/s10901-009-9177-6
|
| [59] |
Smith SJ (2008) Owner-occupation: at home with a hybrid of money and materials. Environ Plan A 40: 520–535. https://doi.org/10.1068/a38423 doi: 10.1068/a38423
|
| [60] |
Watson M (2010) House price Keynesianism and the contradictions of the modern investor subject. Hous Stud 25: 413–426. https://doi.org/10.1080/02673031003711550 doi: 10.1080/02673031003711550
|
| [61] |
Lersch PM, Dewilde C (2018) Homeownership, saving and financial wealth: A comparative and longitudinal analysis. Hous Stud 33: 1175–1206. https://doi.org/10.1080/02673037.2018.1424803 doi: 10.1080/02673037.2018.1424803
|
| [62] |
Siggelsten S (2014) Reallocation of heating costs due to heat transfer between adjacent apartments. Energ Buildings 75: 256–263. https://doi.org/10.1016/j.enbuild.2014.02.022 doi: 10.1016/j.enbuild.2014.02.022
|
| [63] | Stefan A, Crawfort R, Why energy-saving homes often use more energy. The Conversation, 2013. Available from: https://theconversation.com/why-energy-saving-homes-often-use-more-energy-20589. |
| [64] |
Pulselli RM, Simoncini E, Pulselli FM, et al. (2007) Emergy analysis of building manufacturing, maintenance and use: Em-building indices to evaluate housing sustainability. Energ Buildings 39: 620–628. https://doi.org/10.1016/j.enbuild.2006.10.004 doi: 10.1016/j.enbuild.2006.10.004
|
| [65] | Verhoeven V, Bhochhibhoya S, Winkler M (2019) Life cycle assessment of tiny houses in the Netherlands. 4th Congress of Engineering, Science and Environmental Management and 5th International Conference of Greening of Industry Network, AMICA, 376–380. |
| [66] | BpB, Population and households in absolute numbers, 1970 to 2040 (in Deutsch). BpB, 2021. Available from: https://www.bpb.de/nachschlagen/zahlen-und-fakten/soziale-situation-in-deutschland/61584/bevoelkerung-und-haushalte. |
 ctr-02-04-011-S001.pdf ctr-02-04-011-S001.pdf |
 |


Figures(3) / Tables(6)
Véronique Vasseur, Jessica Sing, Samuel W. Short. Determinants of the adoption of tiny houses and their role in alleviating housing shortages in Germany[J]. Clean Technologies and Recycling, 2022, 2(4): 199-224. doi: 10.3934/ctr.2022011


 DownLoad: