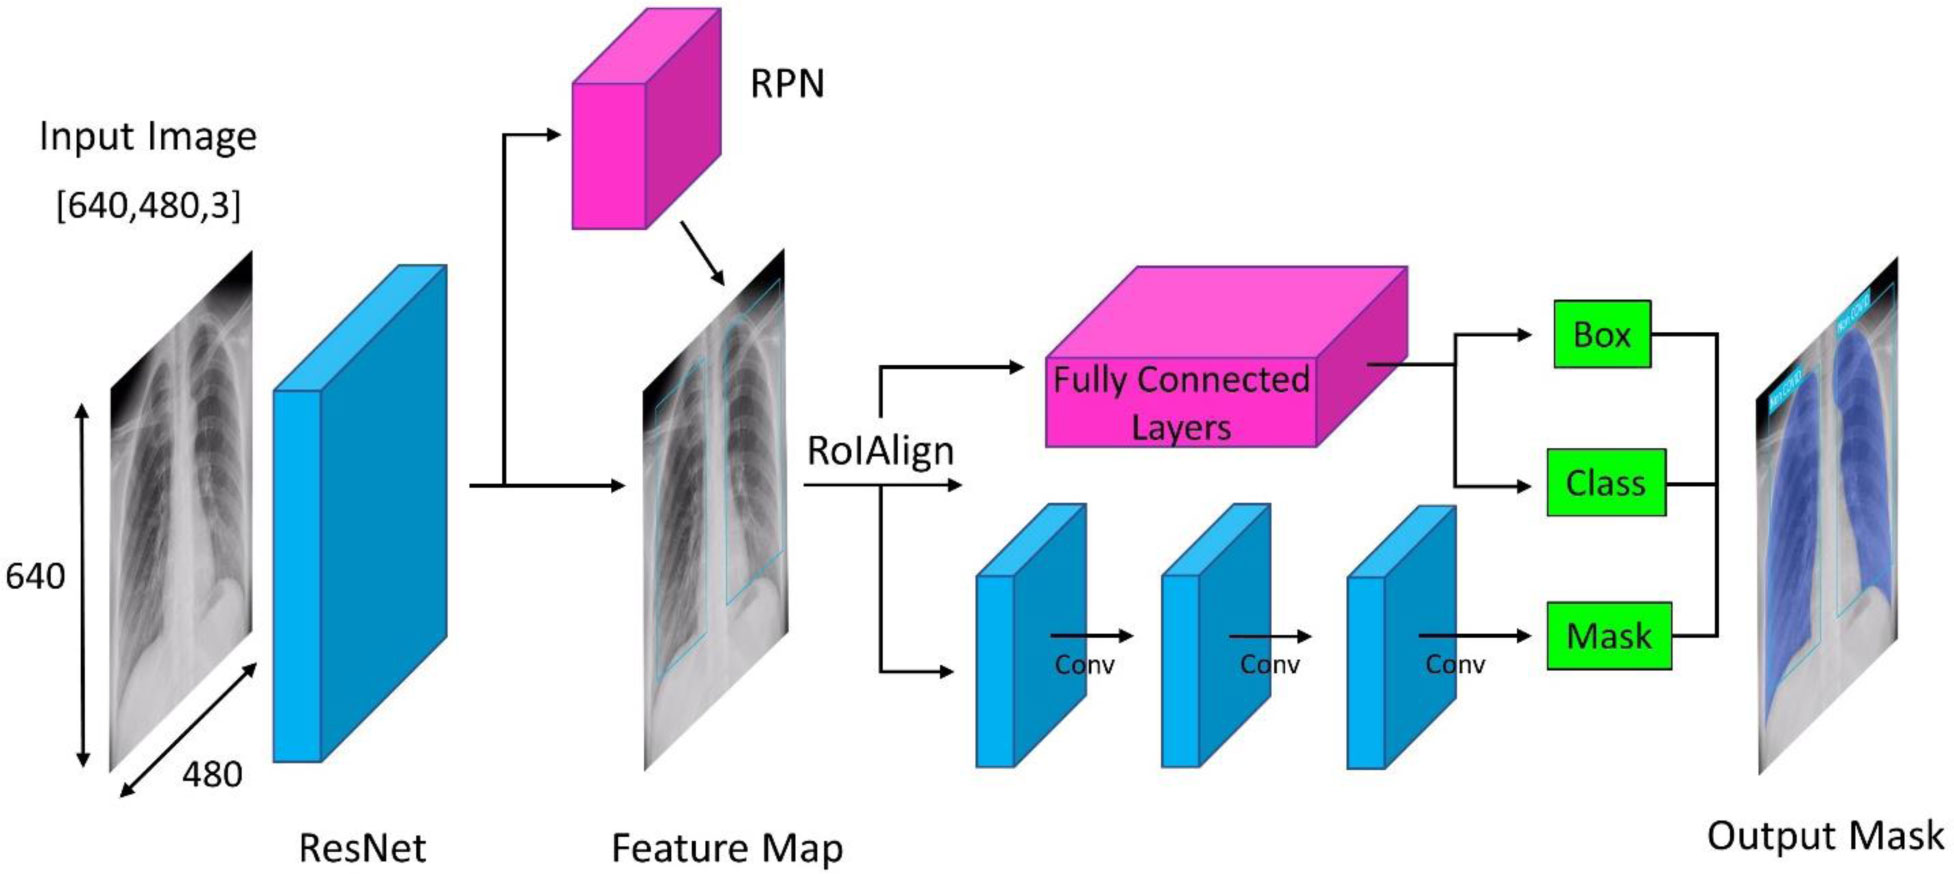
Artificial intelligence techniques are used on chest X-ray images for accurate detection of diseases and this paper aims to develop a process which is capable of diagnosing COVID-19 using deep learning methods on X-ray images. For this purpose, we used Mask R-CNN method to train and test on the dataset to classify between patients infected and non-infected with COVID-19. The dataset used here contains a large number of frontal views of X-ray images which are an essential resource for the algorithms used in the development of tools for the detection of COVID-19. Using 668 chest X-ray images, the proposed model achieved an accuracy as high as 96.98%, specificity of 97.36% with the precision of 96.60%. The entire process is presented in detail. When a comparison table on the AI-based techniques is prepared, it is noticed that the Mask R-CNN technique on chest X-ray images provides better efficiency in the detection of COVID-19. The Mask R-CNN method is found to be accurate and robust in the detection of COVID-19 from chest X-ray images.
Citation: Soumyajit Podder, Somnath Bhattacharjee, Arijit Roy. An efficient method of detection of COVID-19 using Mask R-CNN on chest X-Ray images[J]. AIMS Biophysics, 2021, 8(3): 281-290. doi: 10.3934/biophy.2021022
Artificial intelligence techniques are used on chest X-ray images for accurate detection of diseases and this paper aims to develop a process which is capable of diagnosing COVID-19 using deep learning methods on X-ray images. For this purpose, we used Mask R-CNN method to train and test on the dataset to classify between patients infected and non-infected with COVID-19. The dataset used here contains a large number of frontal views of X-ray images which are an essential resource for the algorithms used in the development of tools for the detection of COVID-19. Using 668 chest X-ray images, the proposed model achieved an accuracy as high as 96.98%, specificity of 97.36% with the precision of 96.60%. The entire process is presented in detail. When a comparison table on the AI-based techniques is prepared, it is noticed that the Mask R-CNN technique on chest X-ray images provides better efficiency in the detection of COVID-19. The Mask R-CNN method is found to be accurate and robust in the detection of COVID-19 from chest X-ray images.

| [1] |
Siddique S, Chow JCL (2021) Machine learning in healthcare communication. Encyclopedia 1: 220-239. doi: 10.3390/encyclopedia1010021

|
| [2] |
Ozturk T, Talo M, Yildirim EA, et al. (2020) Automated detection of COVID-19 cases using deep neural networks with X-ray images. Comput Biol Med 121: 103792. doi: 10.1016/j.compbiomed.2020.103792
|
| [3] |
Khatami F, Saatchi M, Zadeh SST, et al. (2020) A meta-analysis of accuracy and sensitivity of chest CT and RT-PCR in COVID-19 diagnosis. Sci Rep 10: 22402. doi: 10.1038/s41598-020-80061-2
|
| [4] |
Ai T, Yang Z, Hou H, et al. (2020) Correlation of Chest CT and RT-PCR Testing in Coronavirus Disease 2019 (COVID-19) in China: A Report of 1014 Cases. Radiology 296: E32-E40. doi: 10.1148/radiol.2020200642
|
| [5] |
Toussie D, Voutsinas N, Finkelstein M (2020) Clinical and chest radiography features determine patient outcomes in young and middle-aged adults with COVID-19. Radiology . doi: 10.1148/radiol.2020201754
|
| [6] |
Cellina M, Gibelli D, Pittino CV, et al. (2020) Risk factors of fatal outcome in patients with COVID-19 pneumonia. Disaster Med Public . doi: 10.1017/dmp.2020.346
|
| [7] |
Cellina M, Panzeri M, Oliva G (2020) Chest Radiography Features Help to Predict a Favorable Outcome in Patients with Coronavirus Disease 2019. Radiology 297: E238. doi: 10.1148/radiol.2020202326
|
| [8] | Johnson JW (2020) Automatic Nucleus Segmentation with Mask-RCNN. Proceedings of the 2019 Computer Vision Conference 2: https://doi.org/10.1007/978-3-030-17798-0_32. |
| [9] | Kopelowitz E, Engelhard G (2019) Lung nodules detection and segmentation using 3D mask-RCNN. Medical Imaging with Deep Learning 2019 arXiv preprint arXiv:1907.08612. |
| [10] | Liu M, Dong J, Dong X, et al. (2018) Segmentation of lung nodule in CT images based on mask R-CNN. 2018 9th International Conference on Awareness Science and Technology (iCAST) IEEE, 1-6. |
| [11] | Mulay S, Deepika G, Jeevakala S, et al. (2019) Liver segmentation from multimodal images using HED-mask R-CNN. International Workshop on Multiscale Multimodal Medical Imaging Cham: Springer, 68-75. |
| [12] |
Dhieb N, Ghazzai H, Besbes H, et al. (2019) An automated blood cells counting and classification framework using mask R-CNN deep learning model. 2019 31st International Conference on Microelectronics (ICM) IEEE, 300-303. doi: 10.1109/ICM48031.2019.9021862
|
| [13] | Shu JH, Nian FD, Yu MH, et al. (2020) An improved mask R-CNN model for multiorgan segmentation. Math Probl Eng 2020: 8351725. |
| [14] | Lin K, Zhao H, Lv J, et al. (2020) Face detection and segmentation based on improved mask R-CNN. Discrete Dyn Nat Soc 2020: 9242917. |
| [15] |
Anantharaman R, Velazquez M, Lee Y (2018) Utilizing mask R-CNN for detection and segmentation of oral diseases. 2018 IEEE international conference on bioinformatics and biomedicine (BIBM) IEEE, 2197-2204. doi: 10.1109/BIBM.2018.8621112
|
| [16] |
Nguyen DH, Le TH, Tran TH, et al. (2018) Hand segmentation under different viewpoints by combination of Mask R-CNN with tracking. 2018 5th Asian Conference on Defense Technology (ACDT) IEEE, 14-20. doi: 10.1109/ACDT.2018.8593130
|
| [17] |
Almubarak H, Bazi Y, Alajlan N (2020) Two-stage mask-RCNN approach for detecting and segmenting the optic nerve head, optic disc, and optic cup in fundus images. Appl Sci 10: 3833. doi: 10.3390/app10113833
|
| [18] |
Shibata T, Teramoto A, Yamada H, et al. (2020) Automated detection and segmentation of early gastric cancer from endoscopic images using mask R-CNN. Appl Sci 10: 3842. doi: 10.3390/app10113842
|
| [19] | Cao G, Song W, Zhao Z (2019) Gastric cancer diagnosis with mask R-CNN[C]. 2019 11th International Conference on Intelligent Human-Machine Systems and Cybernetics (IHMSC) IEEE, 60-63. |
| [20] |
Chiao JY, Chen KY, Liao KYK, et al. (2019) Detection and classification the breast tumors using mask R-CNN on sonograms. Medicine (Baltimore) 98: e15200. doi: 10.1097/MD.0000000000015200
|
| [21] | Saiz F A, Barandiaran I (2020) COVID-19 Detection in Chest X-ray Images using a Deep Learning Approach. Int J Interact Multim Artif Intell 6: 1-4. |
| [22] |
Abbas A, Abdelsamea MM, Gaber MM (2020) Classification of COVID-19 in chest X-ray images using DeTraC deep convolutional neural network. Appl. Intell . doi: 10.1007/s10489-020-01829-7
|
| [23] | Cohen JP, Morrison P, Dao L Covid-19 image data collection (2020) .arXiv preprint arXiv:2003.11597. |
| [24] | Cohen JP, Morrison P, Dao L, et al. Covid-19 image data collection: Prospective predictions are the future (2020) .arXiv preprint arXiv:2006.11988. |
| [25] |
Shibly KH, Dey SK, Islam MTU, et al. (2020) COVID faster R–CNN: A novel framework to diagnose novel coronavirus disease (COVID-19) in X-Ray images. Inform Med Unlocked 20: 100405. doi: 10.1016/j.imu.2020.100405
|
| [26] | Hemdan EED, Shouman MA, Karar ME Covidx-net: A framework of deep learning classifiers to diagnose covid-19 in x-ray images (2020) .arXiv preprint arXiv:2003.11055. |
| [27] |
Gunraj H, Wang L, Wong A (2020) Covidnet-ct: A tailored deep convolutional neural network design for detection of covid-19 cases from chest ct images. Front Med 7: 608525. doi: 10.3389/fmed.2020.608525
|
| [28] |
Apostolopoulos ID, Mpesiana TA (2020) Covid-19: automatic detection from x-ray images utilizing transfer learning with convolutional neural networks. Phys Eng Sci Med 43: 635-640. doi: 10.1007/s13246-020-00865-4
|
| [29] | Sethy PK, Behera SK, Ratha PK, et al. (2020) Detection of coronavirus disease (COVID-19) based on deep features and support vector machines. Int J Math Eng Manag Sci 5: 643-651. |
| [30] | Mukherjee H, Ghosh S, Dhar A, et al. (2021) Shallow convolutional neural network for COVID-19 outbreak screening using chest X-rays. Cogn Comput 1-14. |


Figures(3) / Tables(3)

Soumyajit Podder, Somnath Bhattacharjee, Arijit Roy. An efficient method of detection of COVID-19 using Mask R-CNN on chest X-Ray images[J]. AIMS Biophysics, 2021, 8(3): 281-290. doi: 10.3934/biophy.2021022


 DownLoad: