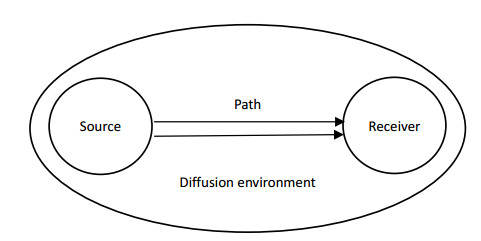
By constructing a technological innovation diffusion (TID) index system of the manufacturing industry with 15 indexes from four dimensions of diffusion source, diffusion path, diffusion receiver, and diffusion environment, this paper measures the TID in the manufacturing industry and analyzes its distribution characteristics from the perspective of industry and region from 2005 to 2018 by using the entropy weight method and the dynamic multi-indicator projection pursuit (PP-IPM) method. The results show that the TID in China's manufacturing industry has a good development trend in the sample period, and the diffusion resources and paths have a relatively greater impact on TID; the absorptive capacity of the receiver also has a significant impact, while the impact of the diffusion environment is relatively small. During the sample period, at the sector level, a pattern has formed in which transportation equipment manufacturing, electrical machinery and equipment manufacturing, and communication equipment, computer and electronic equipment manufacturing are the sources of diffusion, gradually spreading to other sectors according to the degree of industrial relevance. At the regional level, the diffusion pattern is that Guangdong, Jiangsu, Zhejiang, Shandong, Beijing, and Shanghai are the sources and diffuse to the surrounding and central and western regions successively.
Citation: Mengxin Wang, Lang Li, Hanyong Lan. The measurement and analysis of technological innovation diffusion in China's manufacturing industry[J]. National Accounting Review, 2021, 3(4): 452-471. doi: 10.3934/NAR.2021024
By constructing a technological innovation diffusion (TID) index system of the manufacturing industry with 15 indexes from four dimensions of diffusion source, diffusion path, diffusion receiver, and diffusion environment, this paper measures the TID in the manufacturing industry and analyzes its distribution characteristics from the perspective of industry and region from 2005 to 2018 by using the entropy weight method and the dynamic multi-indicator projection pursuit (PP-IPM) method. The results show that the TID in China's manufacturing industry has a good development trend in the sample period, and the diffusion resources and paths have a relatively greater impact on TID; the absorptive capacity of the receiver also has a significant impact, while the impact of the diffusion environment is relatively small. During the sample period, at the sector level, a pattern has formed in which transportation equipment manufacturing, electrical machinery and equipment manufacturing, and communication equipment, computer and electronic equipment manufacturing are the sources of diffusion, gradually spreading to other sectors according to the degree of industrial relevance. At the regional level, the diffusion pattern is that Guangdong, Jiangsu, Zhejiang, Shandong, Beijing, and Shanghai are the sources and diffuse to the surrounding and central and western regions successively.

| [1] | Cao Y, He D, Hong W, et al. (2017) The Statistic Measurement Study on the Comprehensive Competitiveness in Chinese Provincial Forestry Based on the Projection Pursuit Model. Forestry Econ 39: 75–80. |
| [2] | Cao X, Zhang LP, Liu GW (2018) Research on Dynamic mechanisms of Innovation Diffusion and Its Simulation Based on the Social Network Structure. Oper Res Manage 27: 149–156. |
| [3] | Cheng SH, Shen LH (2018) Spatio-temporal Evolution of Chinese Technology Spatial Diffusion Effect Based on Provincial Data. Econ Manage 32: 31–39. |
| [4] |
Cohen WM, Levinthal DA (1990) Absorptive capacity: A new perspective on learning and innovation. Adm Sci Q 35: 128–152. doi: 10.2307/2393553

|
| [5] |
Cole SA, Fernando AN (2021) Mobileizing Agricultural Advice Technology Adoption Diffusion and Sustainability. Econ J 131: 192–219. doi: 10.1093/ej/ueaa084
|
| [6] | Comin D, Dmitriev M, Rossi-Hansberg E (2012) The spatial diffusion of technology. Nat Bur Econ Res. |
| [7] |
Dechezleprêtre A, Neumayer E, Perkins R (2015) Environmental regulation and the cross-border diffusion of new technology: Evidence from automobile patents. Res Policy 44: 244–257. doi: 10.1016/j.respol.2014.07.017
|
| [8] |
Ertur C, Musolesi A (2017) Weak and Strong Cross-Sectional Dependence: A Panel Data Analysis of International Technology Diffusion. J Appl Econom 32: 477–503. doi: 10.1002/jae.2538
|
| [9] |
Friedman JH, Tukey JW (1974) A Projection Pursuit Algorithm for Exploratory Data Analysis. IEEE Trans Comput 23: 881–890. doi: 10.1109/T-C.1974.224051
|
| [10] |
Grafström J, Lindman Å (2017) Invention, innovation and diffusion in the European wind power sector. Technol Forecasting Soc Change 114: 179–191. doi: 10.1016/j.techfore.2016.08.008
|
| [11] |
Hacking N, Pearson P, Eames M (2019) Mapping innovation and diffusion of hydrogen fuel cell technologies: Evidence from the UK's hydrogen fuel cell technological innovation system, 1954–2012. Int J Hydrogen Energ 44: 29805–29848. doi: 10.1016/j.ijhydene.2019.09.137
|
| [12] | Hötte K (2020) How to accelerate green technology diffusion? Directed technological change in the presence of coevolving absorptive capacity. Energy Econ 85. |
| [13] | Huang ZQ, Zhang GH (2010) On the Measurement Indicators of Innovation Diffusion and Knowledge Spillover-Patent Citation, Technology Licensing and Publication Citation. Sci Technol Progress Policy 27: 124–126. |
| [14] |
Jan F, Bart V (2002) Technology-gaps, Innovation-diffusion and Transformation: An Evolutionary Interpretation. Res Policy 31: 1291–1304. doi: 10.1016/S0048-7333(02)00064-1
|
| [15] | Jin H, Li RJ (2018) Governance Performance Evaluation in Beijing-Tianjin-Hebei Region: Combination Evaluation Method. J Hebei Univ Technol 10: 7–12. |
| [16] | Jin JL, Wang SJ, Wei YM (2004) Projection Pursuit Model for Dynamic Multiple Attribute Decision Problems. Chinese J Manage Sci 12: 64–67. |
| [17] |
Laciana CE, Rovere SL (2011) Ising-like agent-based technology diffusion model: Adoption patterns vs. seeding strategies. Physica A 390: 1139–1149. doi: 10.1016/j.physa.2010.11.006
|
| [18] |
Lee H, Kim N, Kwak K, et al. (2016) Diffusion Patterns in Convergence among High-Technology Industries: A Co-Occurrence-Based Analysis of Newspaper Article Data. Sustainability 8: 1029. doi: 10.3390/su8101029
|
| [19] | Lv YB, Nie JW, Liu QS (2020) The Impact of Industrial Technology Grouping on Innovation Diffusion. Res Manage 41: 78–88. |
| [20] |
Lyu Y, Liu Q, He B, et al. (2017) Structural embeddedness and innovation diffusion: the moderating role of industrial technology grouping. Scientometrics 111: 889–916. doi: 10.1007/s11192-017-2320-3
|
| [21] |
Nelson AJ (2009) Measuring knowledge spillovers: What patents, licenses and publications reveal about innovation diffusion. Res Policy 38: 994–1005. doi: 10.1016/j.respol.2009.01.023
|
| [22] | Rogers EM (2003) Diffusion of Innovations. Free Press. |
| [23] | Santacreu AM (2019) International Technology Licensing, Intellectual Property Rights, and Tax Havens. FRB St. Louis Working Paper. |
| [24] | Wang WD, Fergola P, Tenneriello C (2003) Innovation diffusion model in patch environment. Appl Math Comput 134: 51–67. |
| [25] | Xu Z, Jiao XH, Zhu GL (2013) The technology diffusion of national heart cities and regional economic growth-taking Beijing and Shanghai as example. Sci Res Manage 34: 16–23. |
| [26] | Yu DK, Peng J, Tu GP (2018) The Evaluation of Agricultural Technology Diffusion environment of China Regions. Math Pract Theory 48: 43–57. |
| [27] |
Yu Q, Yu Z, Ma D (2020) A multiplex network perspective of innovation diffusion: An information-behavior framework. IEEE Access 8: 36427–36440. doi: 10.1109/ACCESS.2020.2975357
|


Figures(3) / Tables(5)

Mengxin Wang, Lang Li, Hanyong Lan. The measurement and analysis of technological innovation diffusion in China's manufacturing industry[J]. National Accounting Review, 2021, 3(4): 452-471. doi: 10.3934/NAR.2021024


 DownLoad: