We examined the behavioral outcomes of individuals' perceptions of the aesthetics and ethics in firms' corporate social responsibility (CSR) communications. Considering CSR communication as a key factor in building organizational trustworthiness and acknowledging the behavioral outcomes already established in the literature, this paper delves into the potential influence of aesthetic communication on perceptions of ethical leadership. Using the content analysis of CSR communications and ordinary least squares (OLS), the study investigates to what extent consumers' perceptions of a firm's ethical leadership and the aesthetic quality of its communications affect purchase intentions. Using a sample of 519 executive and non-executive students with management and economics backgrounds, we documented a positive relationship of perceptions of an organization's ethical leadership and the aesthetic attributes of its CSR communications with purchase intentions. The analysis demonstrates that respondents do not differentiate between firms classified as having high or low national CSR rankings. This research contributes to the literature on CSR by exploring the interplay between aesthetic judgments and perceptions of ethical leadership and offering a fresh perspective through the relatively unexplored lens of aesthetics in the field of environmental, social, and governance (ESG) sustainability.
Citation: Giacomo Boesso, Barbara Fryzel, Marco Ghitti. Aesthetics of CSR communication and perception of ethical leadership, impact on purchase intention in high and low rank CSR firms[J]. Green Finance, 2025, 7(1): 175-199. doi: 10.3934/GF.2025007
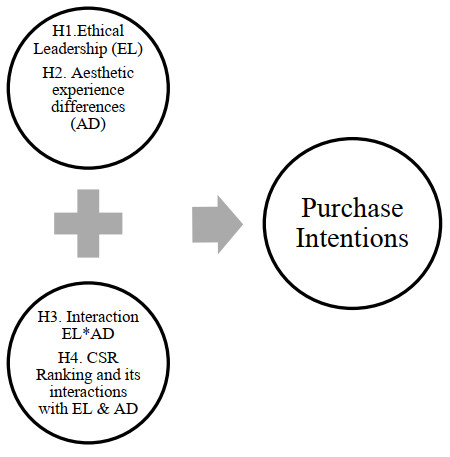
We examined the behavioral outcomes of individuals' perceptions of the aesthetics and ethics in firms' corporate social responsibility (CSR) communications. Considering CSR communication as a key factor in building organizational trustworthiness and acknowledging the behavioral outcomes already established in the literature, this paper delves into the potential influence of aesthetic communication on perceptions of ethical leadership. Using the content analysis of CSR communications and ordinary least squares (OLS), the study investigates to what extent consumers' perceptions of a firm's ethical leadership and the aesthetic quality of its communications affect purchase intentions. Using a sample of 519 executive and non-executive students with management and economics backgrounds, we documented a positive relationship of perceptions of an organization's ethical leadership and the aesthetic attributes of its CSR communications with purchase intentions. The analysis demonstrates that respondents do not differentiate between firms classified as having high or low national CSR rankings. This research contributes to the literature on CSR by exploring the interplay between aesthetic judgments and perceptions of ethical leadership and offering a fresh perspective through the relatively unexplored lens of aesthetics in the field of environmental, social, and governance (ESG) sustainability.

| [1] | Adler NJ, Laasch O (2020) Responsible leadership and management: Key distinctions and shared concerns, In: Laasch, O., Suddaby, R., Freeman, R. and Jamali, D. (Eds.), Research Handbook of Responsible Management, Edward Elgar Publishing, 100–112. https://doi.org/10.4337/9781788971966.00013 |
| [2] |
Amoako GK, Doe JK, Dzogbenuku RK (2021) Perceived firm ethicality and brand loyalty: The mediating role of corporate social responsibility and perceived green marketing. Soc Bus Rev 16: 398–419. https://doi.org/10.1108/SBR-05-2020-0076 doi: 10.1108/SBR-05-2020-0076

|
| [3] |
Arif M, Sajjad A, Farooq S, et al. (2021) The impact of audit committee attributes on the quality and quantity of environmental, social and governance (ESG) disclosures. Corp Gov 21: 497–514. https://doi.org/10.1108/CG-06-2020-0243 doi: 10.1108/CG-06-2020-0243
|
| [4] |
Auger P, Devinney TM (2007) Do what consumers say matter? The misalignment of preferences with unconstrained ethical intentions. J Bus Ethics 76: 361–383. https://doi.org/10.1007/s10551-006-9287-y doi: 10.1007/s10551-006-9287-y
|
| [5] | Bacevice PA, Wilhoit Larson E (2023) The Strategic Aestheticization of Work: How Workers Read Normative Organizational Values in Workplace Imagery. Management Communication Quarterly: 08933189231203232. |
| [6] |
Baer MD, van der Werff L, Colquitt JA, et al. (2018) Trusting the “Look and Feel”: Situational Normality, Situational Aesthetics, and the Perceived Trustworthiness of Organizations. Acad Manage J 61: 1718–1740. https://doi.org/10.5465/amj.2016.0248 doi: 10.5465/amj.2016.0248
|
| [7] |
Bedi A, Alpaslan CM, Green S (2016) A Meta-analytic Review of Ethical Leadership Outcomes and Moderators. J Bus Ethics 139: 517–536. https://doi.org/10.1007/s10551-015-2625-1 doi: 10.1007/s10551-015-2625-1
|
| [8] | Bhadauria A (2016) Investigating the role of aesthetics in consumer moral judgment and creativity. Doctoral dissertation, The University of Wisconsin-Milwaukee. |
| [9] |
Bloch PH, Brunel FF, Arnold TJ (2003) Individual differences in the centrality of visual product aesthetics: Concept and measurement. J Consum Res 29: 551–565. https://doi.org/10.1086/346250 doi: 10.1086/346250
|
| [10] |
Boesso G, Fryzel B, Ghitti M (2023) Corporate social responsibility and comparative capitalism frameworks: Evidence from the United States, Poland, and Italy. Corp Soc Resp and Env Manag 30: 531–547. https://doi.org/10.1002/csr.2372 doi: 10.1002/csr.2372
|
| [11] |
Bouilloud JP, Deslandes G (2015) The Aesthetics of Leadership: Beau Geste as Critical Behaviour. Organ Stud 36: 1095–1114. https://doi.org/10.1177/0170840615585341 doi: 10.1177/0170840615585341
|
| [12] |
Brady FN (1986) Aesthetic components of management ethics. Acad Manage Rev 11: 337–344. https://doi.org/10.5465/amr.1986.4283118 doi: 10.5465/amr.1986.4283118
|
| [13] |
Broadstock DC, Managi S, Matousek R, et al. (2019) Does doing “good” always translate into doing “well”? An eco-efficiency perspective. Bus Strat Env 28: 1199–1217. https://doi.org/10.1002/bse.2311 doi: 10.1002/bse.2311
|
| [14] |
Brown ME, Treviño LK, Harrison DA (2005) Ethical leadership: A social learning perspective for construct development and testing. Org Beh Hum Dec Proc 97: 117–134. https://doi.org/10.1016/j.obhdp.2005.03.002 doi: 10.1016/j.obhdp.2005.03.002
|
| [15] |
Cameron KS, Bright D, Caza A (2004) Exploring the relationships between organizational virtuousness and performance. Am Behav Sci 47: 766–790. https://doi.org/10.1177/00027642032602 doi: 10.1177/00027642032602
|
| [16] |
Candio P (2024) The effect of ESG and CSR attitude on financial performance in Europe: A quantitative re-examination. J Env Manage 354 https://doi.org/10.1016/j.jenvman.2024.120390 doi: 10.1016/j.jenvman.2024.120390
|
| [17] | Davis JL, Alibašic H, Norris S (2018) Corporate Leadership in Sustainability: A Green Ranking Performance-Based Approach to Understanding Corporate Social Responsibility (CSR) and Positive Marketing Impact. Creighton J Interd Leadership 4: 3–16. |
| [18] |
Delmas MA, Burbano VC (2011) The drivers of greenwashing. Calif Manage Rev 54: 64–87. https://doi.org/10.1525/cmr.2011.54.1.64 doi: 10.1525/cmr.2011.54.1.64
|
| [19] |
Dion K, Berscheid E, Walster E (1972) What is beautiful is good. J Pers Soc Psychol Rev 24: 285–290. https://doi.org/10.1037/h0033731 doi: 10.1037/h0033731
|
| [20] |
Dyck A, Lins K, Roth L, et al. (2019) Do institutional investors drive corporate social responsibility? International evidence. J Financ Econ 131: 693–714. https://doi.org/10.1016/j.jfineco.2018.08.013 doi: 10.1016/j.jfineco.2018.08.013
|
| [21] | Edelman Trust Barometer (2022) Available from: https://www.edelman.com/trust/2022-trust-barometer. |
| [22] |
Fong KH, Snape E (2015) Empowering leadership, psychological empowerment and employee Outcomes: Testing a multi‐level mediating model. British J Manage 26: 126–138. https://doi.org/10.1111/1467-8551.12048 doi: 10.1111/1467-8551.12048
|
| [23] |
Fryzel B, Seppala N (2016) The effect of CSR evaluations on affective attachment to CSR in different identity orientation firms. Bus Ethics: A Europ Rev 25: 310–326. https://doi.org/10.1111/beer.12116 doi: 10.1111/beer.12116
|
| [24] |
Geissler GL, Zinkhan GM, Watson RT (2006) The influence of home page complexity on consumer attention, attitudes, and purchase intent. J Advertising 35: 69–80. https://doi.org/10.1080/00913367.2006.10639232 doi: 10.1080/00913367.2006.10639232
|
| [25] |
Goldsmith RE, Lafferty BA, Newell SJ (2000) The Influence of Corporate Credibility on Consumer Attitudes and Purchase Intent. Corp Reput Rev 3: 304–318 https://doi.org/10.1057/palgrave.crr.1540122 doi: 10.1057/palgrave.crr.1540122
|
| [26] |
Gordon ME, Slade LA, Schmitt N (1987) Student guinea pigs: Porcine predictors and particularistic phenomena. Acad Manage Rev 12: 160–163. https://doi.org/10.5465/amr.1987.4306524 doi: 10.5465/amr.1987.4306524
|
| [27] |
Hamermesh DS, Biddle JE (1994) Beauty and the labor market. Am Econ Rev 84: 1174. https://doi.org/10.3386/w4518 doi: 10.3386/w4518
|
| [28] |
Hansen H, Ropo A, Sauer E (2007) Aesthetic leadership. Leade Quart 18: 544–560. https://doi.org/10.1016/j.leaqua.2007.09.003 doi: 10.1016/j.leaqua.2007.09.003
|
| [29] |
Hayat K, Jianjun Z, Ali S (2022) Reinforcing purchase behaviors through CSR and ethical practices. Mark Intell Plan 40: 256–272. https://doi.org/10.1108/MIP-08-2021-0268 doi: 10.1108/MIP-08-2021-0268
|
| [30] |
Hausman AV, Siekpe JS (2009) The effect of web interface features on consumer online purchase intentions. J Bus Res 62: 5–13. https://doi.org/10.1016/j.jbusres.2008.01.018 doi: 10.1016/j.jbusres.2008.01.018
|
| [31] |
He D, Workman CI, He X, et al. (2024) What is good is beautiful (and what isn’t, isn’t): How moral character affects perceived facial attractiveness. Psychol Aesthet Crea 18: 633. https://doi.org/10.1037/aca0000454 doi: 10.1037/aca0000454
|
| [32] |
Heres L, Lasthuizen K (2012) What’s the Difference? Ethical Leadership in Public, Hybrid and Private Sector Organizations. J Chang Manag 12: 441–466. https://doi.org/10.1080/14697017.2012.728768 doi: 10.1080/14697017.2012.728768
|
| [33] | Herzberg M, Rudeloff C (2022) Should your brand take a stand? Comparing the impact of brand activism and CSR on brand equity. J Brand Strat 11: 248–262. |
| [34] | Huang D, Anantharaman D, Zhao K (2020) Is a picture worth a thousand words? Image usage in CSR reports. Available at SSRN. http://dx.doi.org/10.2139/ssrn.3722228 |
| [35] |
Invernizzi AC, Bellucci M, Acuti D, et al. (2022) Form and substance: Visual content in CSR reports and investors’ perceptions. Psychol Market 39: 974–989. https://doi.org/10.1002/mar.21635 doi: 10.1002/mar.21635
|
| [36] |
Jiménez FR, Mendoza NA (2013) Too popular to ignore: The influence of online reviews on purchase intentions of search and experience products. J Interact Mark 27: 226–235. https://doi.org/10.1016/j.intmar.2013.04.004 doi: 10.1016/j.intmar.2013.04.004
|
| [37] |
Kanungo RN (2001) Ethical values of transactional and transformational leaders. Can J Adm Sc/Rev Can des Sci de l'Adm 18: 257–265. https://doi.org/10.1111/j.1936-4490.2001.tb00261.x doi: 10.1111/j.1936-4490.2001.tb00261.x
|
| [38] |
Kim S, Lee YJ (2012) The complex attribution process of CSR motives. Pub Rel Rev 38: 168–170. https://doi.org/10.1016/j.pubrev.2011.09.024 doi: 10.1016/j.pubrev.2011.09.024
|
| [39] |
Ladkin D (2018) The Aesthetic’ and Its Relationship to Business Ethics: Philosophical Underpinnings and Implications for Future Research. J Bus Ethics 147: 35–51. https://doi.org/10.1007/s10551-015-2928-2 doi: 10.1007/s10551-015-2928-2
|
| [40] |
Lane D (2005) Emerging varieties of capitalism in former state socialist societies. Compet Chang 9: 227–247. https://doi.org/10.1179/102452905X55912 doi: 10.1179/102452905X55912
|
| [41] |
Lawton A, Páez I (2015) Developing a Framework for Ethical Leadership. J Bus Ethics 130: 639–649. https://doi.org/10.1007/s10551-014-2244-2 doi: 10.1007/s10551-014-2244-2
|
| [42] | Legrand W, Nielsen RS (2018) Towards a Responsible Experience Economy: Ethics through Aesthetics in Tourism., Chen, J.S. (Ed.). Advances in Hospitality and Leisure, 14: 173–182 Emerald Publishing Limited. https://doi.org/10.1108/S1745-354220180000014011 |
| [43] |
Li YM, Yeh YS (2010) Increasing trust in mobile commerce through design aesthetics. Comput Hum Behav 26: 673–684. https://doi.org/10.1016/j.chb.2010.01.004 doi: 10.1016/j.chb.2010.01.004
|
| [44] |
Lyon TP, Montgomery AW (2015) The means and end of greenwash. Organ Environ 28: 223–249. https://doi.org/10.1177/1086026615575332 doi: 10.1177/1086026615575332
|
| [45] |
Maxham III JG (2001) Service recovery’s influence on consumer satisfaction, positive word-of-mouth, and purchase intentions. J Bus Res 54: 11–24. https://doi.org/10.1016/S0148-2963(00)00114-4 doi: 10.1016/S0148-2963(00)00114-4
|
| [46] |
Meng MD, Leary RB (2021) It might be ethical, but I won’t buy it: Perceived contamination of, and disgust towards, clothing made from recycled plastic bottles. Psychol Market 38: 298–312. https://doi.org/10.1002/mar.21323 doi: 10.1002/mar.21323
|
| [47] |
Mõttus M, Lamas D, Kukk L (2017) Aesthetic categories of interaction: aesthetic perceptions on smartphone and computer. Federated Conference on Computer Science and Information Systems (FedCSIS), 1249–1256. https://doi.org/10.15439/2017F408 doi: 10.15439/2017F408
|
| [48] |
Munro I (2014) Organizational ethics and Foucault’s ‘art of living’: Lessons from social movement organizations. Org Stud 35: 1127–1148. https://doi.org/10.1177/0170840614530915 doi: 10.1177/0170840614530915
|
| [49] |
Nölke A, Vliegenthart A (2009) Enlarging the Varieties of Capitalism: The Emergence of Dependent Market Economies in East Central Europe. World Polit 61: 670–702 https://doi.org/10.1017/S0043887109990098 doi: 10.1017/S0043887109990098
|
| [50] |
Pomering A, Dolnicar S (2009) Assessing the prerequisite of successful CSR implementation: are consumers aware of CSR initiatives? J Bus Ethics 85: 285–301. https://doi.org/10.1007/s10551-008-9729-9 doi: 10.1007/s10551-008-9729-9
|
| [51] |
Rämö H (2011) Visualizing the phronetic organization: The case of photographs in CSR reports. J Bus Ethics 104: 371–387. https://doi.org/10.1007/s10551-011-0916-8 doi: 10.1007/s10551-011-0916-8
|
| [52] |
Reimann M, Zaichkowsky J, Neuhaus C, et al. (2010) Aesthetic package design: A behavioral, neural, and psychological investigation. J Consum Psychol 20: 431–441. https://doi.org/10.1016/j.jcps.2010.06.009 doi: 10.1016/j.jcps.2010.06.009
|
| [53] |
Richardson BJ (2019) Green Illusions: Governing CSR Aesthetics. Windsor Yearbook of Access to Justice 36: 3–35 https://doi.org/10.22329/wyaj.v36i0.6065 doi: 10.22329/wyaj.v36i0.6065
|
| [54] |
Searle TP, Barbuto Jr JE (2013) A multilevel framework: Expanding and bridging micro and macro levels of positive behavior with leadership. J Leadersh Org Stud 20: 274–286. https://doi.org/10.1177/1548051813485133 doi: 10.1177/1548051813485133
|
| [55] |
Stevenson JS, Bruner GC, Kumar A (2000) Webpage background and viewer attitudes. J Adv Res 40: 29–34. https://doi.org/10.2501/jar-40-1-2-29-34 doi: 10.2501/jar-40-1-2-29-34
|
| [56] |
Storsletten VM, Jakobsen OD (2015) Development of leadership theory in the perspective of Kierkegaard’s philosophy. J Bus Ethics 128: 337–349. https://doi.org/10.1007/s10551-014-2106-y doi: 10.1007/s10551-014-2106-y
|
| [57] | Taylor SS, Hansen H (2017) Finding form: Looking at the field of organizational aesthetics. Aesthetic Turn Manage 17–37. |
| [58] |
Van der Heijden H (2003) Factors influencing the usage of websites: The case of a generic portal in the Netherlands. Inf Manag 40: 541–549. https://doi.org/10.1016/S0378-7206(02)00079-4 doi: 10.1016/S0378-7206(02)00079-4
|
| [59] |
Van Quaquebeke N, Becker JU, Goretzki N, et al. (2019) Perceived ethical leadership affects customer purchasing intentions beyond ethical marketing in advertising due to moral identity self-congruence concerns. J Bus Ethics 156: 357–376. https://doi.org/10.1007/s10551-017-3577-4 doi: 10.1007/s10551-017-3577-4
|
| [60] |
Wang Z, Sarkis J (2017) Corporate social responsibility governance, outcomes, and financial performance. J Clean Prod 162: 1607–1616. https://doi.org/10.1016/j.jclepro.2017.06.142 doi: 10.1016/j.jclepro.2017.06.142
|
| [61] | Witkin RW (2017) The aesthetic imperative of a rational-technical machinery: A study in organizational control through the design of artifacts. In: Symbols and artifacts, 325–338 Routledge. |
| [62] |
Yammarino FJ, Dionne SD, Chun JU, et al. (2005) Leadership and levels of analysis: A state-of-the science review. Leadership Quart 16: 879–919. https://doi.org/10.1016/j.leaqua.2005.09.002 doi: 10.1016/j.leaqua.2005.09.002
|
| [63] | Yoo B, Donthu N (2001). Developing a scale to measure the perceived quality of an Internet shopping site (SITEQUAL). Quart J Elect Com 2: 31–45. |
| [64] |
Yukl G, Mahsud R, Hassan S, et al. (2013) An improved measure of ethical leadership. J Lead Org Stud 20: 38–48. https://doi.org/10.1177/1548051811429352 doi: 10.1177/1548051811429352
|
 GF-07-01-007-s001.pdf GF-07-01-007-s001.pdf |
 |
Figures(1) / Tables(7)

Giacomo Boesso, Barbara Fryzel, Marco Ghitti. Aesthetics of CSR communication and perception of ethical leadership, impact on purchase intention in high and low rank CSR firms[J]. Green Finance, 2025, 7(1): 175-199. doi: 10.3934/GF.2025007


 DownLoad: