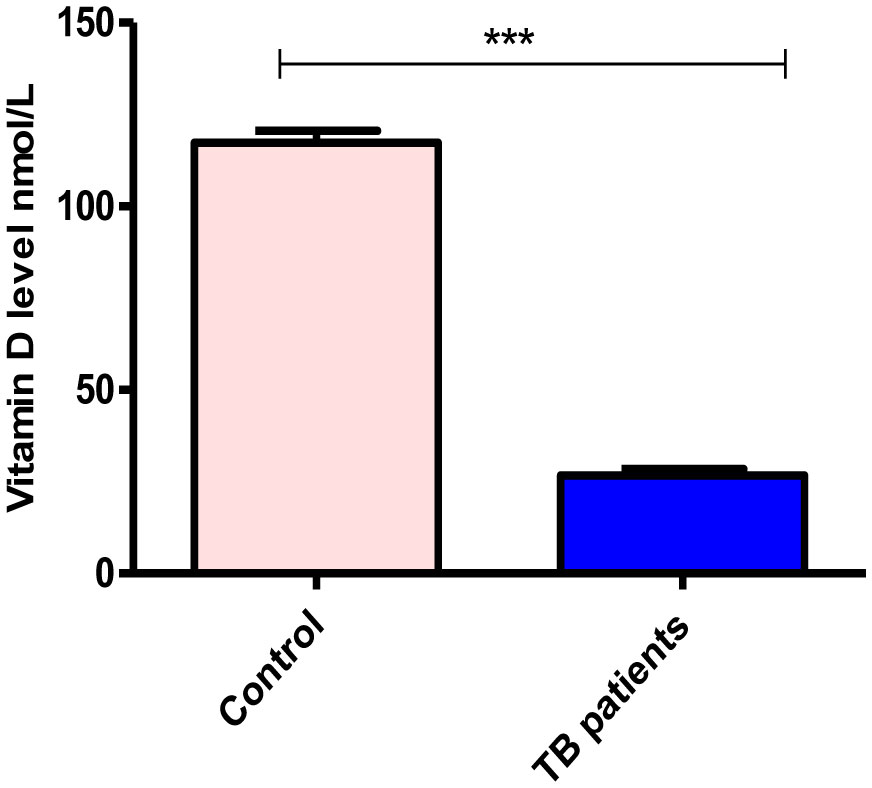
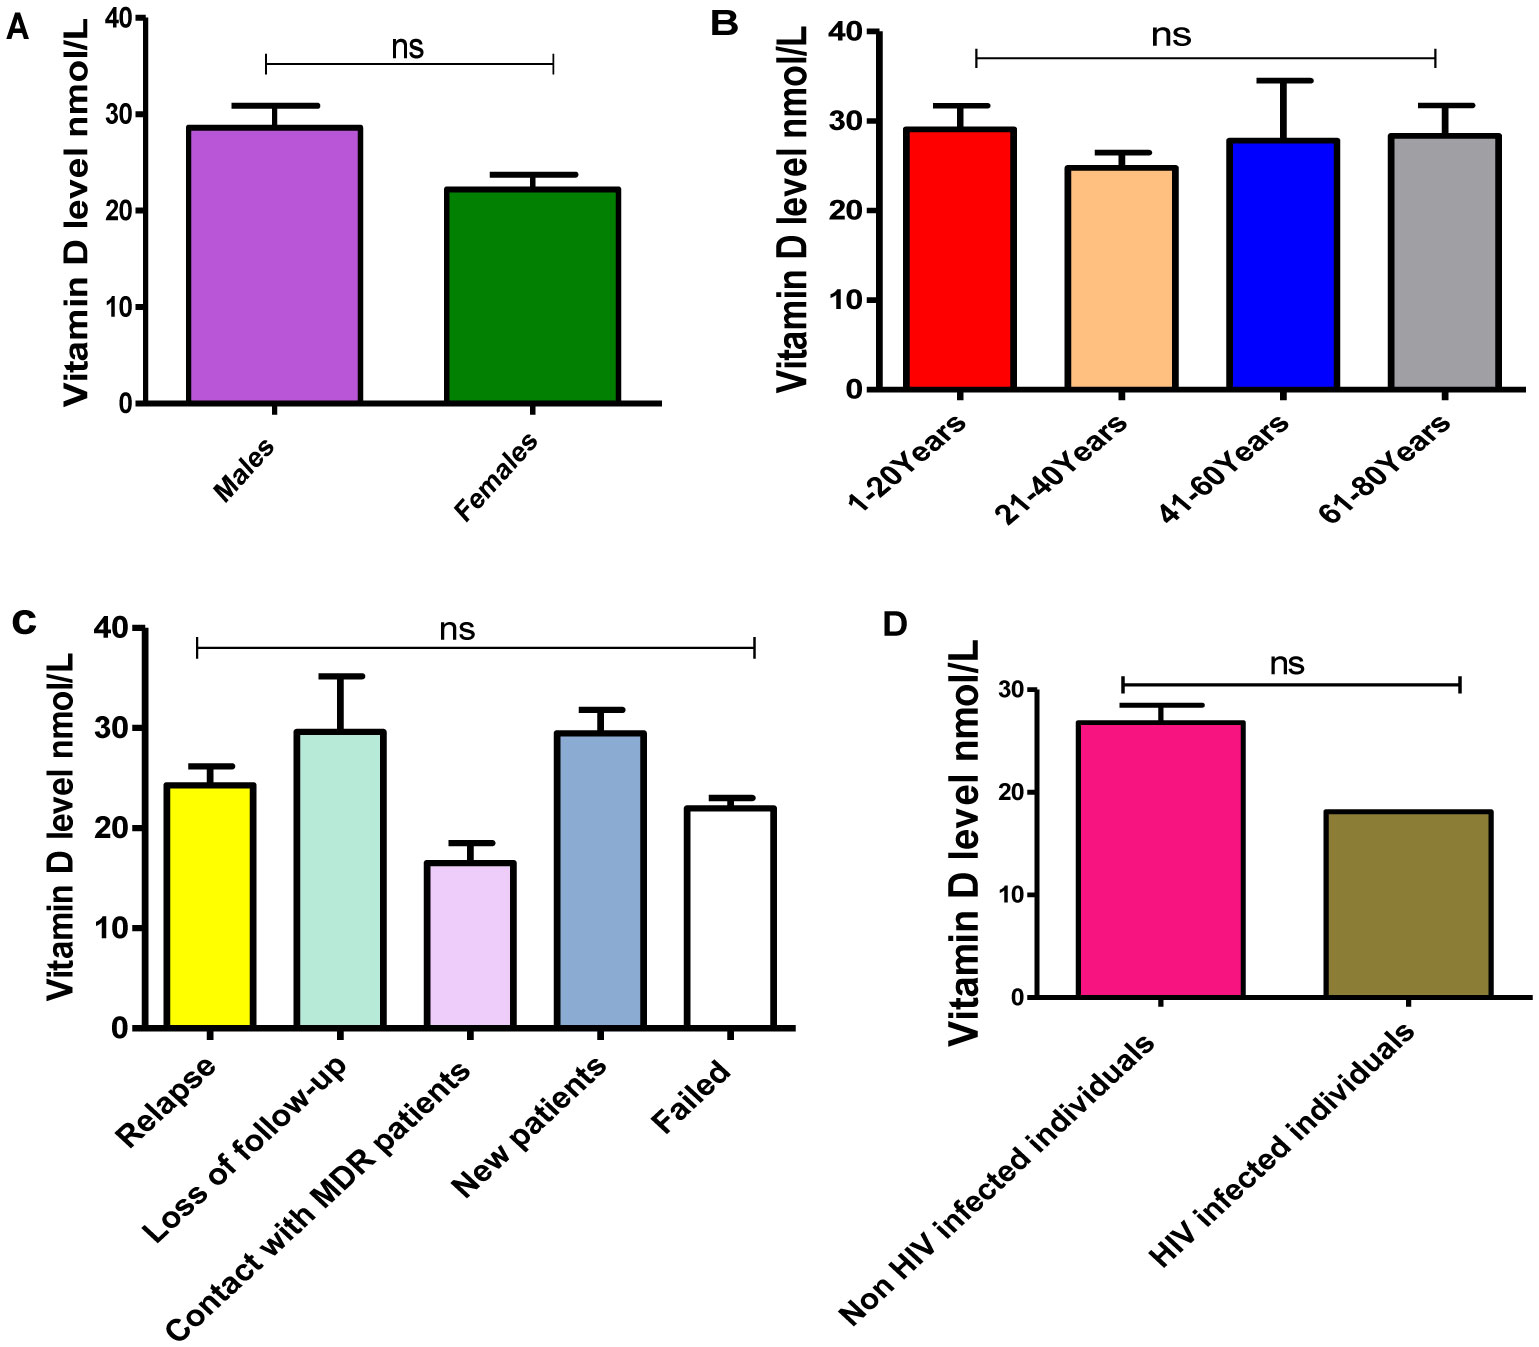
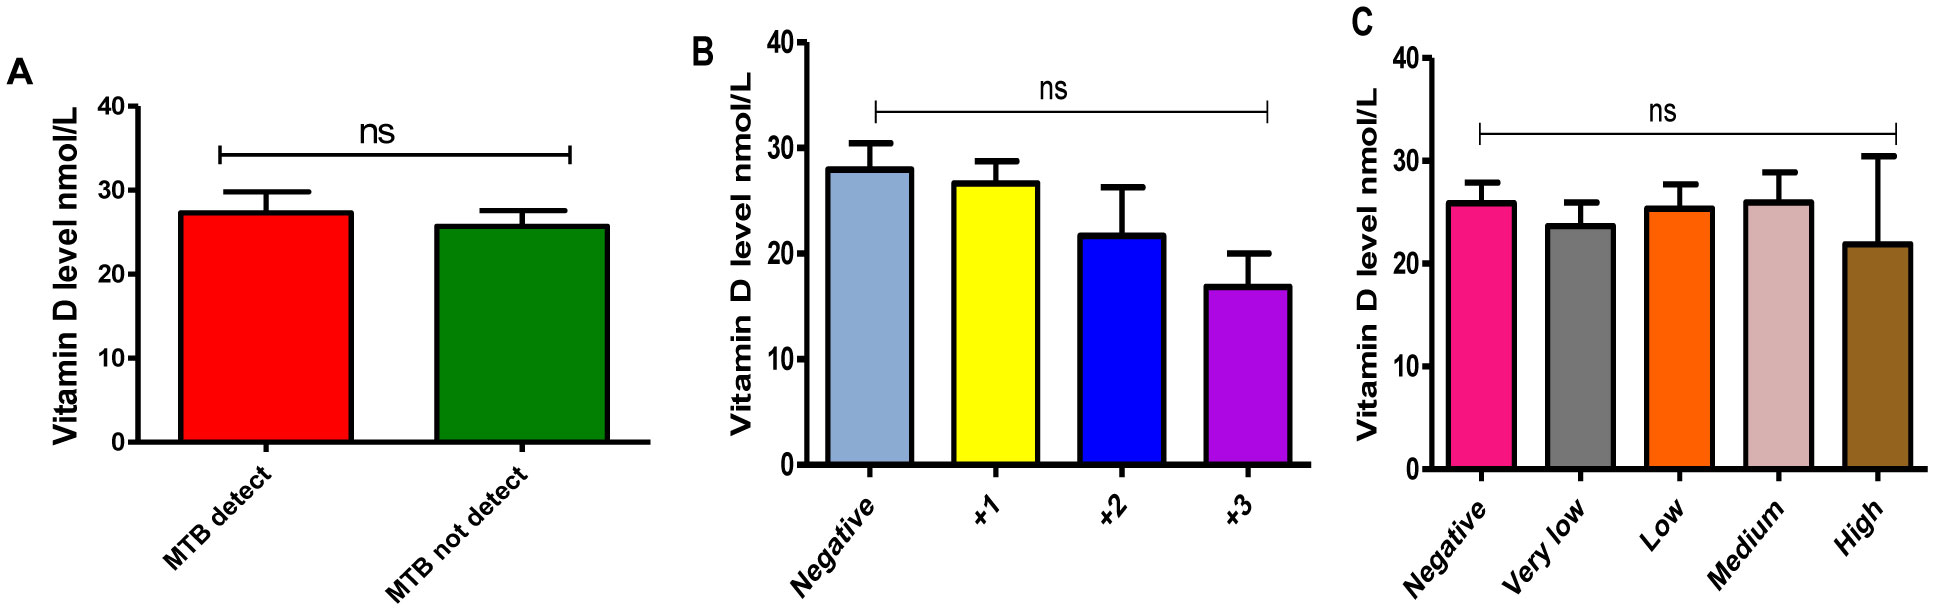
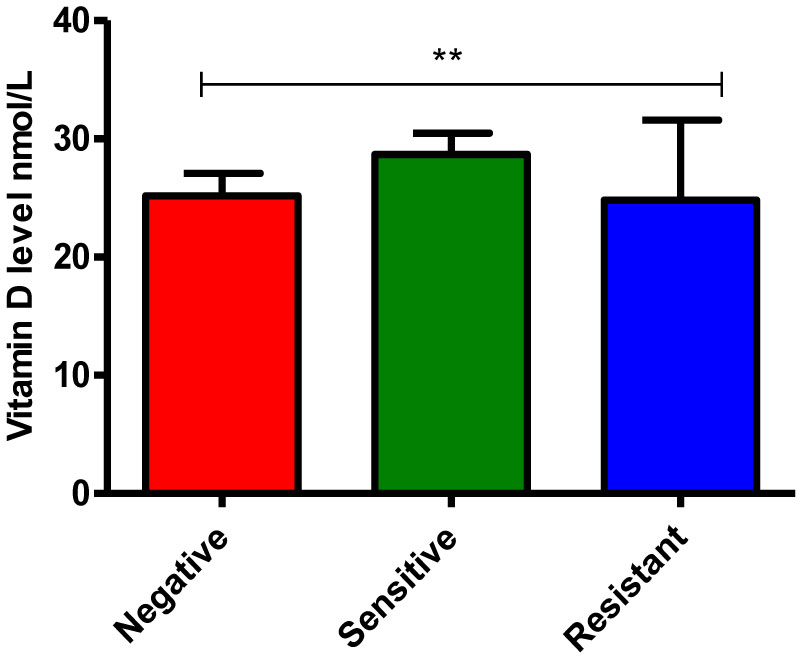
Globally, tuberculosis is one of the major causes of morbidity and mortality in many countries. Previous studies suggest that the incidence and severity of tuberculosis are associated with low levels of vitamin D (Vit D). Therefore, this study aimed to determine the occurrence and associated factors of vitamin D3 deficiency in pulmonary tuberculosis patients at White Nile State, Sudan. 101 individuals of diagnosed pulmonary tuberculosis patients (71 males and 30 females) and 100 non-TB controls (58 males and 42 females) were included in this study. Sputum samples were obtained from TB patients and subjected to examination for acid-fast bacilli (AFB) using Ziehl-Neelsen (ZN) stain and Gene Xpert analysis. Blood samples were collected from both groups and Serum 25(OH)-vitamin D3 was determined by an Enzyme-Linked Immunosorbent Assay. HIV infection in Tuberculosis (TB) group was also investigated using the immunochromatographic test. In our study, the majority of TB patients were suffered from TB relapse (36.6%); non-HIV infected individuals (99.1%) or showed a positive result for AFB (61.4%) in Gene Xpert analysis. Moreover, there is a significant difference in microscopy findings and bacillary levels of AFB, and Rifampicin (RIF) susceptibility pattern of M. tuberculosis strain among sputum samples of TB patients, P-values less 0.0001. Furthermore, we found that TB patients were suffered from vitamin D deficiency. In particular, the mean of vitamin D level was significantly much lower in TB patients (26.7 ± 1.6) compared to non-TB controls (117.3 ± 3.2), P-value equal 0.0001. Likewise, it's much lower in females, individuals of 21–40 years old, and patients with high bacillary levels or those infected by Rifampicin resistance strain. Accordingly, our study was highlighted the TB and Vit D deficiency relationship and showed the need for further studies to a better understanding of the impact of TB on Vit D level and investigate whether vitamin D supplementation can have a role in the prevention and treatment of tuberculosis.
Citation: Samah Sidahmed M.S Elsafi, Bakri Mohammed Nour, Adam Dawoud Abakar, Izzedeen Haroun Omer, Babiker Saad Almugadam. Vitamin D level and it is association with the severity of pulmonary tuberculosis in patients attended to Kosti Teaching Hospital, Sudan[J]. AIMS Microbiology, 2020, 6(1): 64-74. doi: 10.3934/microbiol.2020004
Globally, tuberculosis is one of the major causes of morbidity and mortality in many countries. Previous studies suggest that the incidence and severity of tuberculosis are associated with low levels of vitamin D (Vit D). Therefore, this study aimed to determine the occurrence and associated factors of vitamin D3 deficiency in pulmonary tuberculosis patients at White Nile State, Sudan. 101 individuals of diagnosed pulmonary tuberculosis patients (71 males and 30 females) and 100 non-TB controls (58 males and 42 females) were included in this study. Sputum samples were obtained from TB patients and subjected to examination for acid-fast bacilli (AFB) using Ziehl-Neelsen (ZN) stain and Gene Xpert analysis. Blood samples were collected from both groups and Serum 25(OH)-vitamin D3 was determined by an Enzyme-Linked Immunosorbent Assay. HIV infection in Tuberculosis (TB) group was also investigated using the immunochromatographic test. In our study, the majority of TB patients were suffered from TB relapse (36.6%); non-HIV infected individuals (99.1%) or showed a positive result for AFB (61.4%) in Gene Xpert analysis. Moreover, there is a significant difference in microscopy findings and bacillary levels of AFB, and Rifampicin (RIF) susceptibility pattern of M. tuberculosis strain among sputum samples of TB patients, P-values less 0.0001. Furthermore, we found that TB patients were suffered from vitamin D deficiency. In particular, the mean of vitamin D level was significantly much lower in TB patients (26.7 ± 1.6) compared to non-TB controls (117.3 ± 3.2), P-value equal 0.0001. Likewise, it's much lower in females, individuals of 21–40 years old, and patients with high bacillary levels or those infected by Rifampicin resistance strain. Accordingly, our study was highlighted the TB and Vit D deficiency relationship and showed the need for further studies to a better understanding of the impact of TB on Vit D level and investigate whether vitamin D supplementation can have a role in the prevention and treatment of tuberculosis.

| [1] |
Tiemersma EW, van der Werf MJ, Borgdorff MW, et al. (2011) Natural history of tuberculosis: duration and fatality of untreated pulmonary tuberculosis in HIV negative patients: a systematic review. PLoS One 6: e17601. doi: 10.1371/journal.pone.0017601

|
| [2] |
Jagielski T, Minias A, Van Ingen J, et al. (2016) Methodological and clinical aspects of the molecular epidemiology of Mycobacterium tuberculosis and other mycobacteria. Clin Microbiol Rev 29: 239-290. doi: 10.1128/CMR.00055-15
|
| [3] |
de Paus RA, van Meijgaarden KE, Prins C, et al. (2017) Immunological characterization of latent tuberculosis infection in a low endemic country. Tuberculosis 106: 62-72. doi: 10.1016/j.tube.2017.07.001
|
| [4] |
Sirelkhatim M, Eldin GS, Almula IF, et al. (2016) Tuberculosis in Sudan: Efficiency of diagnostic techniques commonly used and investigation of some sociodemographic factors which may influence the disease prevalence. Sudan Med Monit 11: 71-77. doi: 10.4103/1858-5000.189559
|
| [5] |
Pope V, Sacksteder KA, Hererra JC, et al. (2018) MPT64 patch test for the diagnosis of active pulmonary tuberculosis: a randomised controlled trial in Peru. Int J Tuberc Lung Dis 22: 622-627. doi: 10.5588/ijtld.17.0716
|
| [6] |
Liu PT, Stenger S, Li H, et al. (2006) Toll-like receptor triggering of a vitamin D-mediated human antimicrobial response. Science 311: 1770-1773. doi: 10.1126/science.1123933
|
| [7] |
Denis M (1991) Killing of mycobacterium tuberculosis within human monocytes, activation by cytokines and calcitriol. Clin Exp Immunol 84: 200-206. doi: 10.1111/j.1365-2249.1991.tb08149.x
|
| [8] |
Abu-Amer Y, Bar-Shavit Z (1993) Impaired bone marrow derived macrophage differentiation in vitamin D deficiency. Cell Immunol 151: 356-368. doi: 10.1006/cimm.1993.1245
|
| [9] |
Stechschulte SA, Kirsner RS, Federman DG (2009) Vitamin D: bone and beyond, rationale and recommendations for supplementation. The American Journal of Medicine 122: 793-802. doi: 10.1016/j.amjmed.2009.02.029
|
| [10] |
Holick MF (2007) Vitamin D deficiency. N Engl J Med 357: 266-281. doi: 10.1056/NEJMra070553
|
| [11] | Rook GW, Steele J, Fraher L, et al. (1986) VitaminD3, gamma interferon, and control of proliferation of Mycobacterium tuberculosis by human monocytes. Immunology 57: 159-163. |
| [12] |
Rowle AJ, Ross EJ (1987) Inhibition by 1,25(OH)2-vitaminD3 of the multiplication of virulent tubercle bacilli in cultured human macrophages. Infect Immun 55: 2945-2950. doi: 10.1128/IAI.55.12.2945-2950.1987
|
| [13] |
Griffin MD, Xing N, Kumar R (2003) Vitamin D and its analogs as regulators of immune activation and antigen presentation. Annu Rev Nutr 23: 117-145. doi: 10.1146/annurev.nutr.23.011702.073114
|
| [14] |
Wilkinson RJ, Llewelyn M, Toossi Z, et al. (2000) Influence of vitamin D deficiency and vitamin D receptor polymorphisms on tuberculosis among Gujarati Asians in west London: a case-control study. Lancet 355: 618-621. doi: 10.1016/S0140-6736(99)02301-6
|
| [15] |
Kramnik I, Dietrich WF, Demant P, et al. (2000) Genetic control of resistance to experimental infection with virulent Mycobacterium tuberculosis. Proc NatlAcad Sci USA 97: 8560-8565. doi: 10.1073/pnas.150227197
|
| [16] |
Friis H, Range N, Pedersen M, et al. (2008) Hypovitaminosis D is common among pulmonary tuberculosis patients in Tanzania but is not explained by the acute phase response. J Nutr 138: 2474-2480. doi: 10.3945/jn.108.094979
|
| [17] |
Scragg R, Sowers M, Bell C (2007) Serum 25-hydroxyvitamin D, ethnicity, and blood pressure in the Third National Health and nutrition examination survey. Am J Hypertens 20: 713-719. doi: 10.1016/j.amjhyper.2007.01.017
|
| [18] |
Mansoor S, Habib A, Ghani F (2010) Prevalence and significance of vitamin D deficiency and insufficiency among apparently healthy adults. Clin Biochem 43: 1431-1435. doi: 10.1016/j.clinbiochem.2010.09.022
|
| [19] | FMoH E (2008) Tuberculosis, leprosy and TB. HIV prevention and control programme manual. 2008: 5-7. |
| [20] | Cheesbrough M (2009) District laboratory practice in tropical countries Cambridge: New York. |
| [21] |
Nielsen NO, Skifte T, Andersson M, et al. (2010) Both high and low serum vitamin D concentrations are associated with tuberculosis: a case-control study in Greenland. Br J Nutr 104: 1487-1491. doi: 10.1017/S0007114510002333
|
| [22] |
Waters WR, Palmer MV, Nonnecke BJ (2004) Mycobacterium bovis infection of vitamin D-deficient mice. Microb Pathog 6: 11-17. doi: 10.1016/j.micpath.2003.08.008
|
| [23] |
Martineau AR, Wilkinson KA, Newton SM, et al. (2007) IFN-gamma- and TNF-independent Vitamin D inducible human suppression of mycobacteria: the role of cathelicidin LL-37. J Immunol 178: 7190-7198. doi: 10.4049/jimmunol.178.11.7190
|
| [24] |
Kibirige D, Mutebi E, Ssekitoleko R, et al. (2013) Vitamin D deficiency among adult patients with tuberculosis: a cross sectional study from a national referral hospital in Uganda. BMC Res Notes 6: 293. doi: 10.1186/1756-0500-6-293
|
| [25] | Banda R, Mhemedi B, Allain T (2010) Prevalence of vitamin D deficiency in adult tuberculosis patients at a central hospital in Malawi. Int J Tuberc Lung Dis 15: 408-410. |
| [26] | Iftikhar R, Kamran SM, Qadir A, et al. (2013) Vitamin D deficiency in patients with tuberculosis. J Coll Physicians Surg Pak 23: 780-783. |
| [27] |
Tessema B, Moges F, Habte D, et al. (2017) Vitamin D deficiency among smear positive pulmonary tuberculosis patients and their tuberculosis negative household contacts in Northwest Ethiopia: a case–control study. Ann Clin Microbiol Antimicrob 16: 36. doi: 10.1186/s12941-017-0211-3
|
| [28] |
Gloth FM, Gundberg CM, Hollis BW, et al. (1995) Vitamin Deficiency in homebound elderly persons. JAMA 274: 1683-1686. doi: 10.1001/jama.1995.03530210037027
|
| [29] |
Omdahl JL, Garry PJ, Hunsaker LA, et al. (1982) Nutritional status in a healthy elderly population: vitamin D. Am J Clin Nutr 36: 1225-1233. doi: 10.1093/ajcn/36.6.1225
|
| [30] |
Holick MF (1995) Environmental factors that influence the cutaneous production of vitamin D. Am J Clin Nutr 61: 638S-645S. doi: 10.1093/ajcn/61.3.638S
|
| [31] |
Gannage-Yared MH, Chemali R, Yaacoub N, et al. (2000) Hypovitaminosis D in a sunny country: relation to lifestyle and bone markers. J Bone Miner Res 15: 1856-1862. doi: 10.1359/jbmr.2000.15.9.1856
|
| [32] |
Matsuoka LY, Ide L, Wortsman J, et al. (1987) Sunscreens suppress cutaneous vitamin D3 synthesis. J Clin Endocrinol Metab 64: 1165-1168. doi: 10.1210/jcem-64-6-1165
|
| [33] |
Dianne EG, Stanley JP, William BG, et al. (2012) Solar UV doses of young Americans and vitamin D3 Production. Environ Health Perspect 120: 139-143. doi: 10.1289/ehp.1003195
|
| [34] |
Bonilla C, Ness AR, Wills AK, et al. (2014) Skin pigmentation, sun exposure and vitamin D levels in children of the Avon Longitudinal Study of Parents and Children. BMC Public Health 14: 597. doi: 10.1186/1471-2458-14-597
|
| [35] |
Libon F, Cavalier E, Nikkels AF (2013) Skin color is relevant to vitamin D synthesis. Dermatology 227: 250-254. doi: 10.1159/000354750
|
| [36] |
Martineau AR, Nhamoyebonde S, Oni T, et al. (2011) Reciprocal seasonal variation in vitamin D status and tuberculosis notifications in Cape Town, South Africa. Proc Natl Acad Sci USA 108: 19013-19017. doi: 10.1073/pnas.1111825108
|
Figures(4) / Tables(1)

Samah Sidahmed M.S Elsafi, Bakri Mohammed Nour, Adam Dawoud Abakar, Izzedeen Haroun Omer, Babiker Saad Almugadam. Vitamin D level and it is association with the severity of pulmonary tuberculosis in patients attended to Kosti Teaching Hospital, Sudan[J]. AIMS Microbiology, 2020, 6(1): 64-74. doi: 10.3934/microbiol.2020004


 DownLoad: