Research article Topical Sections

Design of a compressed air energy storage system for hydrostatic wind turbines

  • Integration of Compressed Air Energy Storage (CAES) system with a wind turbine is critical in optimally harvesting wind energy given the fluctuating nature of power demands. Here we consider the design of a CAES for a wind turbine with hydrostatic powertrain. The design parameters of the CAES are determined based on simulation of the integrated system model for a combination of these parameter values, namely the compression ratios of the air compressors and the expanders and the air tank size. The results of the simulations were used to choose the best design parameters, which would produce the best stable performance through increased energy output of the integrated CAES and wind turbine based on the intermittent wind profile. Simulation results for a 600 kW rated power wind turbine with integrated CAES indicate that increasing the tank size and compression ratio will improve the overall power quality through increased energy output up to a limit beyond which the power quality exhibits only marginal improvement.

    Citation: Ammar E. Ali, Nicholas C. Libardi, Sohel Anwar, Afshin Izadian. Design of a compressed air energy storage system for hydrostatic wind turbines[J]. AIMS Energy, 2018, 6(2): 229-244. doi: 10.3934/energy.2018.2.229

    Related Papers:

    [1] Majid Deldar, Afshin Izadian, Sohel Anwar . Analysis of a hydrostatic drive wind turbine for improved annual energy production. AIMS Energy, 2018, 6(6): 908-925. doi: 10.3934/energy.2018.6.908
    [2] Stephen K. Musau, Kathrin Stahl, Kevin Volkmer, Nicholas Kaufmann, Thomas H. Carolus . A design and performance prediction method for small horizontal axis wind turbines and its application. AIMS Energy, 2021, 9(5): 1043-1066. doi: 10.3934/energy.2021048
    [3] Nadwan Majeed Ali, Handri Ammari . Design of a hybrid wind-solar street lighting system to power LED lights on highway poles. AIMS Energy, 2022, 10(2): 177-190. doi: 10.3934/energy.2022010
    [4] Rashid Al Badwawi, Mohammad Abusara, Tapas Mallick . Speed control of synchronous machine by changing duty cycle of DC/DC buck converter. AIMS Energy, 2015, 3(4): 728-739. doi: 10.3934/energy.2015.4.728
    [5] Nour Khlaifat, Ali Altaee, John Zhou, Yuhan Huang . A review of the key sensitive parameters on the aerodynamic performance of a horizontal wind turbine using Computational Fluid Dynamics modelling. AIMS Energy, 2020, 8(3): 493-524. doi: 10.3934/energy.2020.3.493
    [6] Azevedo Joaquim, Mendonça Fábio . Small scale wind energy harvesting with maximum power tracking. AIMS Energy, 2015, 2(3): 297-315. doi: 10.3934/energy.2015.3.297
    [7] Navid Majdi Nasab, Jeff Kilby, Leila Bakhtiaryfard . Integration of wind and tidal turbines using spar buoy floating foundations. AIMS Energy, 2022, 10(6): 1165-1189. doi: 10.3934/energy.2022055
    [8] S. Vinoth John Prakash, P.K. Dhal . Cost optimization and optimal sizing of standalone biomass/diesel generator/wind turbine/solar microgrid system. AIMS Energy, 2022, 10(4): 665-694. doi: 10.3934/energy.2022032
    [9] Ferhat Bingol . Feasibility of large scale wind turbines for offshore gas platform installation. AIMS Energy, 2018, 6(6): 967-978. doi: 10.3934/energy.2018.6.967
    [10] Salih N Akour, Hani Omar Bataineh . Design considerations of wind funnel concentrator for low wind speed regions. AIMS Energy, 2019, 7(6): 728-742. doi: 10.3934/energy.2019.6.728
  • Integration of Compressed Air Energy Storage (CAES) system with a wind turbine is critical in optimally harvesting wind energy given the fluctuating nature of power demands. Here we consider the design of a CAES for a wind turbine with hydrostatic powertrain. The design parameters of the CAES are determined based on simulation of the integrated system model for a combination of these parameter values, namely the compression ratios of the air compressors and the expanders and the air tank size. The results of the simulations were used to choose the best design parameters, which would produce the best stable performance through increased energy output of the integrated CAES and wind turbine based on the intermittent wind profile. Simulation results for a 600 kW rated power wind turbine with integrated CAES indicate that increasing the tank size and compression ratio will improve the overall power quality through increased energy output up to a limit beyond which the power quality exhibits only marginal improvement.


    Nomenclature: Bv: Viscous damping coefficient; CAES: Compressed air energy storage; A-CAES: Adiabetic compressed air energy storage; D-CAES: Diabatic compressed air energy storage; I-CAES: Isothermal compressed air energy storage; Cp: Specific heat at constant pressure; Cs: Slippage coefficient; Cv: Viscous drag coefficient; Dm: Motor displacement; Dp: Pump displacement; Energyrequired: the total energy demand; Energytotal: the total energy supplied to the grid; Kps: Motor inertia; Kms: Motor leakage flow coefficient; Im: Pump slippage coefficient; M: Mass of air in the tank; ˙min: Air mass flow through compressors; ˙mout: Air mass flow going through gas turbines From the air tank; n: Polytrophic index of the compressor train and is set as 1.4; P1, P2: Output Pressure of each compressor; Ρc: Energy consumed by each of the compressor; Pin, c: Air pressure entering compressors; Pin, t: Air pressure entering turbine; Pm: Differential pressure across the motor; Pmax: Maximum pressure inside the air tank; Pout, c: Air pressure leaving compressors; Pout, t: Air pressure leaving turbine; Pp: Differential pressure across the pump; Ρt: Power generated by each gas turbine; Qm: Actual motor delivered flow rate; Qp: Actual pump delivered flow rate; R: The universal gas constant; SC: Air tank storage capacity; TES: Thermal Energy Storage; THX: Heat Exchanger Temperature Tin, c: Air temperature entering compressors = 293 K; Tin, t: Air temperature entering the turbine; Tout, c: Air temperature leaving compressors; Tout, HX: Air temperature leaving Heat exchanger; Tout, t: Air temperature leaving turbine; Ts: Storage air temperature inside the tank; Turbout: The gas turbine power in kW; V: Tank volume; βc: Compression ratio of each compressor; βt: The compression ratio of each turbine; η: Efficiency Storage Tank; ηc: Efficiency of each compressor; ηHX: The efficiency of heat exchanger; ηt: The efficiency of each gas turbine; γ: Energytotal/Energyrequired; μ: Absolute viscosity; τload: Load torque; ωp: Pump angular velocity; ωm: Motor angular velocity.


    1. Introduction

    Wind energy is the fastest growing renewable energy in the world. US wind energy capacity grew by 4.8 GW in 2014, a 7.8% increase from 2013, to represent 5.7% of total U.S. cumulative installed power generation capacity 30. It represented about 33% of total renewable power generation capacity in the USA in 2014. However, China continued to lead the world in cumulative installed wind capacity of over 114 GW in 2014.

    The conventional wind turbine includes a mechanical gearbox in the nacelle attached to the turbine. The rotor of the turbine transmits the wind energy to the gearbox which is connected to the electrical generator. All the components are housed inside the nacelle, which makes it very hard for regular inspection and maintenance. The gearbox of the wind turbine will have higher downtimes due to routine repairs and preventive maintenance as compared to hydraulic transmission [1].

    Hydrostatic drive wind turbines are a relatively new type of wind turbines that have been introduced in the recent years. These wind turbines offer the opportunity to bring most of the nacelle equipment down to the ground, which open up the door for many improvements in the wind turbine technology including the reduction in the cost of the construction and maintenance of the turbine. In these turbines, the wind energy is transferred to hydraulic power by connecting a positive displacement hydraulic pump to the turbine rotor. The hydraulic power is transported through hydraulic lines down to the ground level that drives a hydraulic motor, which, in turn, is connected to a generator to generate electrical power. Both the generator and the gearbox are eliminated from a traditional nacelle in such a hydrostatic drive turbine. It has been shown that the capacity factor can be increased through optimal control of the tip speed ratio and the motor displacement for the same cost because of the new turbine benefits largely from reduced construction, operating, and maintenance costs [2,3,4,5].

    Figure 1. World production of wind energy [6].

    The intermittent nature of wind energy negatively impacts the power quality in the grid since the percentage of wind power generation is on the rise. Compressed Air Energy Storage (CAES) can be used as an energy storage system to minimize the intermittent effect of the wind turbine power to the grid. The first idea of using compressed air to store electrical energy goes back to 1940s [7]. The first CAES plant was built in Huntorf Germany in 1978 [8]. US built its first CAES plant in 1991 at McIntosh site [9]. CAES plants at Huntorf and McIntosh were built to improve peak power capability and economic optimization of storing cheaper base load power to be used at peak hours. Today, the main driver for CAES plants is balancing intermittent renewable energy power feed in.

    The basic concept of CAES is as follows. At high wind speeds, when more wind power can be generated than demanded by the grid, the extra wind energy is used to compress air inside an air tank. The compressed air is released to drive a turbine connected to the generator to supply the energy shortfall when wind speeds are lower than demand [10,11].

    We can divide CAES technologies into three streams diabatic (D-CAES), adiabatic (A-CAES), and isothermal (I-CAES) concepts [12]. The three types differ by how the heat is handled through out the compression and expansion stage. In D-CAES the heat resulting from air compression is cooled to the ambient. A heat source (usually gas-fueled) is needed for the discharging process of the air from the tank by pre-heating the compressed air before the expander or turbine. In California, PG & E is planning a 300 MWel D-CAES to be in operation in 2020–2021 [13]. Sacramento Municipal Utility District is doing feasibility and conceptual engineering analyses for a wind farm coupled small D-CAES (15–50 MWel) as well as for one or more 135 MWel plants [14,15]. In Texas, two plants have been announced at the Bethel Energy Center near Dallas and the Matagorda Energy Center near Houston [16]. New York Power Authority (NYPA) is planning a utility-scale D-CAES and has finished the design, performance, and thermodynamic studies on a small-scale D-CAES with about 10 MW of rated power and a storage capacity of 4.5 h by using steel pipes as aboveground CAS [17]. More projects still on their way are an aboveground D-CAES on Hawaii [18] and a 100–300 MWel plant by Nebraska Public Power District using the Dakota porous sandstone formation as storage, which is currently in test operation [19].

    In A-CAES, the heat due to compression is captured in additional Thermal Energy Storage (TES) devices and is used back to pre-heat the air going out of the tank to the expander or turbine. This type of systems can achieve 60–74% efficiency with 80–90% TES efficiency [20,21,22]. A European research AA-CAES4 project started in 2003 [19] to develop an A-CAES plant with 70% cycle efficiency overcoming the low cycle efficiency of D-CAES. One of the outcomes of the project was a conceptual plant layout for a 300 MW A-CAES plant. Despite the interest of several European utilities, this type of A-CAES has not been realized so far. The main obstacle seems to be the considerable development effort related to the adiabatic compressor and to the TES together with the very limited number of installations to be expected. Cardenas et al. introduced an innovative development to the A-CAES system to lower the total cost of the system by for a specific exergy storage capacity. They preheated the air entering the first compressor to increase the fraction of the total exergy [23]. Wolf and Budt [24] showed that low-temperature A-CAES can achieve better economical performance but with lower efficiencies 50–60%.

    In contrast to D-CAES and A-CAES concepts, the heat of compression is to be minimized or even prevented in I-CAES concepts. For I-CAES, there are very few attempts that have been undertaken at the level of startup companies.

    In this paper, we consider the design of an integrated wind turbine and CAES through optimization of a performance index based on simulation experiments at various compression ratios and tank sizes. As a test case, a 600 kW rated hydrostatic wind power system is integrated with an A-CAES. The system is mathematically modeled for different compression ratios and tank sizes. Its operation and effects on power delivery improvements are also studied. The main goal of the control system is to maintain a generator frequency of 60 Hz with ±10% variation while the integrated hydrostatic wind turbine and CAES can deliver a stable power supply to meet the demand. The dynamics of the CAES are modeled to include different design parameters. Simulation experiments are performed to study the relationship between the tank size and compression ratios. The main target of this paper is to help the designer of a CAES system to select the best suitable Tank size and Compression ratio.


    2. Hydraulic power system

    The wind turbine system studied in this paper is a high torque low-speed turbine. Intermittent nature of wind results in fluctuations in hydraulic flow from the prime mover to the generator unit, which causes the output power to be unstable. A goal of this paper is to select and design the compressors, air tank, and expander sizes in order to provide a steady electric power as per the grid requirements. Steady electric output power requires steady torque and speed to the generator. To achieve this goal A-CAES system is used to stabilize the torque for the wind turbine system. The wind drives the turbine rotor, which is connected to a fixed displacement pump. The fixed displacement pump provides flow with at varying pressures to the motor due to the intermittent nature of the wind. The flow is passed to a variable displacement motor which is controlled to maintain a fixed rotational speed of 900 rpm as an output. The motor is connected directly to the generator and the CAES.

    The CAES system is controlled so that it collects the extra torque from the motor when the demand is lower than the available wind power and provides additional torque to the generator when needed. The excess wind power is used by the compressor to store the energy in terms of pressurized air in the tank and released when the available wind power falls short of the demand in order to stabilize the output power.

    Figure 2 shows the overall system configuration. The hydraulic components that affect the dynamics of the system needs to be modeled. These components are briefly described as follows.

    Figure 2. Hydraulic transmission wind turbine integrated with CAES.

    2.1. Hydraulic pump

    The pump used in the system is a fixed displacement pump. Fixed displacement pumps have much fewer maintenance problems than variable displacement pumps. It is also much cheaper. Based on its geometry and working pressure, each pump is associated with a theoretical displacement and volumetric losses due to a portion of the flow leaks back to the inlet port. The pump governing equations are described as follows [25,26]:

    Qp=DpωpCsDpμPp (1)

    Qp=DpωpCsDpμPp is a constant term depending on the internal structure of a pump [27]. Therefore, (1) can be re-written using the pump slippage coefficient Kps as follows:

    Kps=CsDpμ (2)
    Qp=DpωpKpsPp (3)

    The leakage in the pump is due to two reason. The first reason is the laminar leakage due to pressure gradient in the clearance of the pump. The second reason is the flow loss due to compression. Different leakage models have been investigated in [28] based on the above reasons. It was proven experimentally that laminar leakages exhibit a linear behavior [29,30,31].


    2.2. Variable displacement hydraulic motor

    The speed of the motor can be controlled using its displacement. The motor is controlled to have a constant rotational speed of the shaft under different wind speeds. This is very important because the shaft is connected to a synchronous generator that needs to be run at constant speed. The governing equation for the motor flow is similar to the pump's flow equation but with the motor leakage flow coefficient Kms as the additive term [25,26]:

    Qm=Dmωm+KmsPm (4)

    The hydraulic motor equations are similar to hydraulic pump ones. In addition to that, the torque equation can be written based on driving torque and braking torque applied to a hydraulic motor. Additional losses terms are not considered in the following formulation [24] because their values are typically much less than the viscous term [25,26,32]:

    Imdωmdt=DmPmCvDmμωmτload (5)

    A lumped coefficient can be used to replace the terms that multiply to the motor velocity as the viscous damping coefficient, i.e., Bv=CvDmμ.

    Imdωmdt=DmPmBvωmτload (6)

    3. A-CAES mathematical modeling

    The A-CAES system setup and its operational algorithm are illustrated in Figures 3ab. Here the CAES system transports the excess mechanical energy from the wind turbine due to high wind speeds and store it in form of compressed air in the storage tank. When the wind speed goes lower than the minimum speed required to generate the demanded electricity power, the compressed air will be released from the tank to the turbine to generate the mechanical torque needed on the generator shaft. This torque will substitute the lack in wind torque. In general, A-CAES has three stages. The first stage represents the compression stage, which converts the excess prime mover's mechanical energy to the compressed air. The second stage is the air tank for energy storage. The third stage represents the expansion stage, which converts the energy stored in the tank to mechanical torque assisting the prime mover in meeting the power demanded from the generator. Figure 3a also illustrates the different stages of A-CAES. The air tank is generally kept at a relatively low air temperature (at around 293 K) by using intercooling after each compression stage in order to increase the storage capacity. Heat collected by the intercoolers will be stored in Thermal Energy Storages (TES 1 and 2) which, in turn, will be used to heat the compressed air in the expansion stages.

    Figure 3a. Schematic design of the proposed CAES system.
    Figure 3b. Flow chart for the CAES system.

    3.1. Compressor model

    The simulation assumes the use of two-stage compressors to compress the air in the tank [1]. Usage of two stages of compressors and expanders provides better overall system efficiency. The air compressors are assumed to be of reciprocating type. The typical efficiencies of such air compressors are in the range of 70%–90% [33]. The below table shows the specifications of actual compressors from the market to compress up to 15 bar. The compressor efficiency is assumed to be at 85% for both air compressors in all the remaining trials. It was assumed that the two TES and their heat exchangers will have 70% efficiency based on earlier studies [22]. The temperature of the heat exchanger is set to 293 K to carry the heat to TES 1 and 2. The initial value of the compression ratio for both the compressors was assumed to be 10 and increased by an interval of 5 to a maximum value of 30. The air enters the first stage compressor with ambient temperature before entering the second stage. The compressed air from the first stage is then fed to the second stage compressor through TES1.

    Table 1. 15 Bar compressor specifications and efficiency.
    No Item Description
    1 Name Compressor HL221524
    2 Max final pressure (bar) 15
    3 Motor output (kW) 15
    4 Intake rate (L/min) 2335
    5 Volumetric flow rate (L/min) 1960
    6 Cylinders 4
    7 No. of stages 2
    8 RPM 765
    9 Efficiency (%) 85%
     | Show Table
    DownLoad: CSV

    The compression process is stopped once the pressure inside the air tank reaches the maximum value of (30 bar). The output air temperature of compressor, the output air pressure of compressor, and power are expressed in Eqs 7–10 respectively [34,35,36].

    Tout,c=Tin,c.βn1nc (7)
    Tout,HX=Tout,c+ηHX(THXTout,c) (8)
    Pout,c=Pin,c.β (9)
    Pc=1ηc˙min.cp.Tin,c(βn1nc1) (10)

    3.2. Storage tank model

    In this model, the air tank is considered above ground tank. The pressure of atmospheric air entering the compressor is 1 bar and the air pressure exiting the air tank is expected to be the final compression ratio after two-stage compression; therefore, the maximum air pressure inside the air tank reaches Pmax=P1.P2bar.

    The lower limit of the air tank pressure is set to 2 bar under which the discharging mode is stopped. The storage capacity, the mass of air, and volume inside the air tank are sized as in Equations 11–13 respectively [35].

    SC=Turboutηt (11)
    m=3600.SCcp.(Tout,cTin,c) (12)
    V=˙min.R.TsPmax (13)

    3.3. Expander model

    In the CAES, the expansion stage consists of two turbines, with efficiency for both assumed to be 80%, and two heat exchangers with efficiency both of 70%. A compressed air turbine, as in the case of a turbocharger, may reach an efficiency level as high as 80% depending on expansion ratio and volume flow rate. The expansion ratios of the two turbines are the same as the compression ratio. The temperature of the heat exchanger is set to 480 K. After released from the air tank the air enters the high-pressure turbine (HPT). The same process is performed for the low-pressure turbine (LPT). The expansion stage is a reverse process of the compression stage and the air temperature and pressure outputs of each turbine can be calculated as in Eqs14–17 respectively [34,35,36].

    Tout,t=Tin,tβk1kt (14)
    Tout,HX=Tout,t+ηHX.(THXTout,t) (15)
    Pout,t=Pin,tβt (16)

    4. Design optimization

    To optimize the design parameters of the CAES, simulations at different operating conditions were carried out varying three design parameters, as indicated earlier. The first parameter is the compression ratio of the compressor and expander. It was assumed that the total compression ratio and the expansion ratio are the same, for the purpose of simplification. Compression ratios used are between 10 and 30 with an interval of 5. This range of values is selected based on preliminary simulation results which had a direct impact on the performance index. For these simulations, the compressor stage 1 was assumed to have a compression ratio of 5:1 and stage 2 was adjusted to achieve the total compression ratio. The same is true for the turbine: stage 1 was fixed at 3:1 and stage 2 was adjusted to achieve the total ratio.

    The second parameter is the tank size. The selected tank sizes used in the simulation are between 5 m3 and maximum of 50 m3 with an interval of 5 m3. Again these values of tank sizes were found to directly impact the performance index.

    The last parameter is the operating power demand. It was assumed that the demand is fixed for each simulation run. Demand was simulated from 450 kW to 650 kW with an interval of 50 kW for each simulation.

    The wind profile was fixed for all 250-simulation runs to enable realistic comparison of CAES behavior under different design parameters. The wind data of 33 hours were collected from NREL [37] at 1-minute intervals. In order to speed up the calculations, the wind speed over 100-minute interval was averaged using the 1-min interval data from NREL. Thus the 100-min interval data has been used in the optimization process. This is an actual wind data that was used to simulate a more realistic response of the wind turbines. The minimum wind speed was found to be 8 m/s with an average wind speed of around 10 m/s and the maximum wind speed of 14 m/s.

    The power supplied by the turbine using the CAES (Ptotal) was integrated for the duration of the wind profile in order to obtain the total energy produced (Energytotal). The total energy demand (Energyrequired) was calculated by integrating the power demand (Prequired) over the stated period. The power demand was maintained constant for each simulation, but a number of power demand values were considered that were either below, at, or above the rated value. Eqs 18–21 show the total energy produced by the integrated hydrostatic wind turbine and CAES, and energy demand for the duration of 33 hours considered in this simulation. Eq 21 defines the ratio of the total energy supplied to the grid (including CAES supplied energy) to the total energy demand (γ). γ has been used as the objective function for the optimization problem. This ratio represents the amount of energy sufficiency and coverage of the demanded energy for each combination of tank size and compression ratio.

    Ptotal=Pwind+PCAES (18)
    Energytotal=Ptotaldt (19)
    Energyrequired=Prequireddt (20)
    γ=EnergytotalEnergyrequired (21)

    5. Simulation results

    The integrated wind power system has been simulated for the entire 1980-minute operation in which the wind speed is changed according to the pattern shown in Figure 4. A SIMULINK model was built to capture all the dynamical Eqs 1–17 and the performance Eqs 18–21. This model was then simulated for all the combinations of compression/expansion ratios, tank sizes, and power demands as stated in section 4. Figures 5 through 11 and Table 1 capture the simulation results. Figures 5 through 9 show the effect of the tank size and compression ratio on the objective function γ that indicated the level of satisfying the power demands of 450,500,550,600 and 650 kW. It is observed that during low power demands, the tank size has almost no effect on the energy supplied. The compression ratio has minimal effect for a power demand of 450 kW as seen in Figure 5. It is observed that increasing compression ratio will reduce the energy supplied to the grid for higher power demands except for small tank sizes, a trend observed in Figures 69. At high power demands, the compression ratio has a significant effect on power supplied, particularly for small tank sizes. It is also observed that for a particular compression ratio, increasing the tank size will increase energy supply. At every power demand, we optimized the tank size and compression ratio by finding the first maximum sufficiency percentage as shown in Table 1. Table 1 shows the best combination for each power demand and its equivalent sufficiency.

    Figure 4. Wind speed profile for the simulation.
    Figure 5. Percentage of power sufficiency at 450 kW power demand at different tank size and compression ratio combinations.
    Figure 6. Percentage of power sufficiency at 500 kW power demand at different tank size and compression ratio. combinations.
    Figure 7. Percentage of power sufficiency at 550 kW power demand at different tank size and compression ratio combinations.
    Figure 8. Percentage of power sufficiency at 600 kW power demand at different tank size and compression ratio. combinations.
    Figure 9. Percentage of power sufficiency at 650 kW power demand at different tank size and compression ratio combinations.

    Figures 10 and 11 illustrate the effect of increasing the power demand on the system performance for a fixed tank size and compression ratio. The light blue area represents the energy the supplied by the wind turbine without the CAES system integration. The gray area represents the additional energy obtained through the integration of the CAES system to the wind turbine. At low power demands, the system will have a better coverage of energy requirement. During high power demands, the CAES lacks the excess power in the charging stages. This results in a less stored energy, thus causing insufficiency in supplied energy (shown using white area).

    Figure 10. Power demand vs time for a compression ratio of 10 and a tank size of 5 m3.
    Figure 11. Power demand vs time for a compression ratio of 15 and a tank size of 45 m3.
    Table 2. Best design combinations and related power sufficiency.
    Power Demand Total Power Sufficiency γ Optimal Compression Ratio Optimal Tank size (m3)
    450 96.15 10 15
    500 95.06 10 25
    550 94.15 10 30
    600 93.01 10 45
    650 91.88 15 35
     | Show Table
    DownLoad: CSV

    6. Conclusion

    In this paper, a hydrostatic wind turbine with integrated CAES system has been modeled and simulated in order to optimize the CAES system design parameters, for a 600 kW hydrostatic wind turbine. The performance index was defined as the power sufficiency for the combined system. The combined system was modeled and simulated to obtain the power sufficiency results based on a real wind speed data from NREL. CAES system design parameters such as tank size and compression/expansion ratio were varied at the stated power demands to simulate the combined power output in order to optimize these design parameters. It was observed from the simulation results that the optimal design parameters which provided the maximum energy output from the combined wind turbine and CAES system are: a tank size of 15 m3 and a compression ratio/expansion ratio of 10. It was also observed that the CAES is capable of providing excess power during high power demands, up to a specific limit beyond which the power coverage exhibits only marginal improvement.


    Conflict of interest

    The authors declare no conflict of interest in this paper.


    [1] Hamzehlouia S, Izadian A (2012) Nonlinear state space modeling of gearless wind power systems. In Iecon.
    [2] Vaezi M, Izadian A (2013) Multiple-model adaptive estimation of a hydraulic wind power system. Industrial Electronics Society, IECON 2013-, Conference of the IEEE. IEEE, 2111–2116.
    [3] Eriksson S, Bernhoff H, Leijon M (2008) Evaluation of different turbine concepts for wind power. Renew Sust Energ Rev 12: 1419–1434. doi: 10.1016/j.rser.2006.05.017
    [4] Izadian A (2014) Central wind turbine power generation: US, US 8878384 B2[P].
    [5] ChapDrive. ChapDrive, Hydrostatic driv for wind turbines. Cleantech Forum XXII (2009). Available from: https://www.slideshare.net/Calion/chap-drive-1.
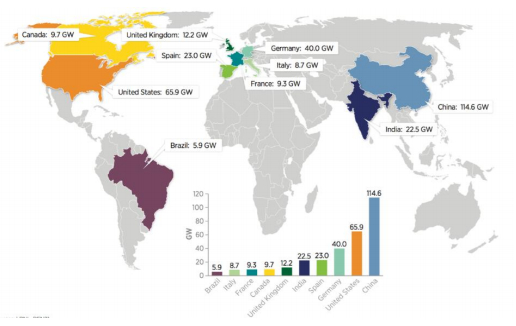
    [6] Beiter P, Tian T (2014) Renewable energy data book. US Department of Energy's National Renewable Energy Laboratory (NREL).
    [7] Kalhammer FR, Schneider TR (1976) Energy storage. Annu Rev Energ 1: 311–343. doi: 10.1146/annurev.eg.01.110176.001523
    [8] Mattick WH, Haddenhorst OW, Stys ZS (1975) Huntorf: the world's first 290-MW gas turbine air-storage peaking plant. Compressed air pumped hydro storage. In Proc. Am. Power Conf. United States.
    [9] Pollak R (1994) History of first US compressed-air energy storage (CAES) Plant (110 MW 26h) volume 2: Construction. Electric Power Research Institute (EPRI).
    [10] ONE (2010) Presentation of the Huntorf CAES Plant. Available from: https://www. kraftwerk-wilhelmshaven.com/pages/ekw_de. Huntorf/Uebersicht/index.
    [11] South P (2010) Presentation of the McIntosh CAES Plant. Available from: www.powersouth.com/mcintosh_power_plant.
    [12] Budt M, Wolf D, Span R, et al. (2016) A review on compressed air energy storage: Basic principles, past milestones and recent developments. Appl Energ 170: 250–268. doi: 10.1016/j.apenergy.2016.02.108
    [13] Pacific Gas And Electric Company (Pg&E) Compressed Air Energy Storage (Caes) Compression Testing Phase Project, San Joaquin County, California. 2014. Available from: https://www.energy.gov/sites/prod/files/2013/11/f5/EA-1752-DEA-2013.pdf.
    [14] Sacramento Municipal Utility District (SMUD) compressed air energy storage: plant. 2012, PDU-Distributed Energy Resources and the Customer.
    [15] Foung Mua, Ten-Year Transmission Assessment Plan. 2013, SMUD.
    [16] Ch2MHill, Prevention of Significant Deterioration Greenhouse Gas Permit Application Bethel Energy Center, Anderson County, Texas. 2012, U.S. Environmental Protection Agency Region 6.
    [17] Li K (2012) Energy Storage Activities at New York Power Authority. in APPA National Conference. Seattle, WA.
    [18] Hampton K (2014) Hawaiian Electric Seeks energy storage to support renewables for Oahu, in Energy Storage Journal.
    [19] Press TA (2012) NPPD to test underground air storage. Available from: http://journalstar.com/news/state-and-regional/nebraska/nppd-to-test-underground-air-storage/article_875259af-d46f-5c98-b1b5-e0b265a17331.html.
    [20] Luo X, Wang J, Krupke C, et al. (2016) Modelling study, efficiency analysis and optimisation of large-scale adiabatic compressed air energy storage systems with low-temperature thermal storage. Appl Energ 162: 589–600. doi: 10.1016/j.apenergy.2015.10.091
    [21] Mozayeni H, Negnevitsky M, Wang X, et al. (2017) Performance study of an advanced adiabatic compressed air energy storage system. Energy Procedia, 71–76.
    [22] Sciacovelli A, Li Y, Chen H, et al. (2017) Dynamic simulation of Adiabatic Compressed Air Energy Storage (A-CAES) plant with integrated thermal storage-link between components performance and plant performance. Appl Energ 185: 16–28. doi: 10.1016/j.apenergy.2016.10.058
    [23] Cárdenas B, Pimm AJ, Kantharaj B, et al. (2017) Lowering the cost of large-scale energy storage: High temperature adiabatic compressed air energy storage. Propul Power Res 62: 126–133.
    [24] Wolf D, Budt M (2014) LTA-CAES-A low-temperature approach to Adiabatic Compressed Air Energy Storage. Appl Energ 125: 158–164. doi: 10.1016/j.apenergy.2014.03.013
    [25] Merritt HE (1967) Hydraulic control systems. John Wiley & Sons.
    [26] Fitch EC (2004) Hydraulic component design and selection. Bardyne. Incorporated.
    [27] Blackburn JF (1969) Fluid power control. Mit Press.
    [28] Rydberg K (2009) Efficiencies for variable hydraulics pumps and motors-Mathematical models and operation conditions. Linköpings University, Department of Management and Engineering.
    [29] Parker, Denison GOLD CUP® Product Catalog Piston Pumps & Motors, Parker, Editor. 2010.
    [30] Rexroth B, Fixed Displacement Pump A4FO. 2013, ed.
    [31] Vickers E (2013) Hydrokraft Transmission Piston Pumps. Technical catalogu.
    [32] Gorbeshko MV (1997) Development of mathematical models for the hydraulic machinery of systems controlling the moving components of water-development works. Hydrotech Construct 31: 745–750. doi: 10.1007/BF02766233
    [33] Moshfeghian DM (2015) How to estimate compressor efficiency? Available from: http://www.jmcampbell.com/tip-of-the-month/2015/07/how-to-estimate-compressor-efficiency.
    [34] Steta FDS (2010) Modeling of an advanced adiabatic compressed air energy storage (AA-CAES) unit and an optimal model-based operation strategy for its integration into power markets. Available from: http://pdfs.semanticscholar.org/d5cc/58ad087d3336a7d4a0ba76e02f9ea959184b.pdf.
    [35] El-Wakil MM (1988) Energy Storage in Power Plant Technology, International ed. Singapore ch.16, sec. 2. 2nd ed.: McGraw-Hill.
    [36] Hasan NS, Hassan MY, Majid MS, et al. (2012) Mathematical model of Compressed Air Energy Storage in smoothing 2MW wind turbine. Power Engineering and Optimization Conference. IEEE, 339–343.
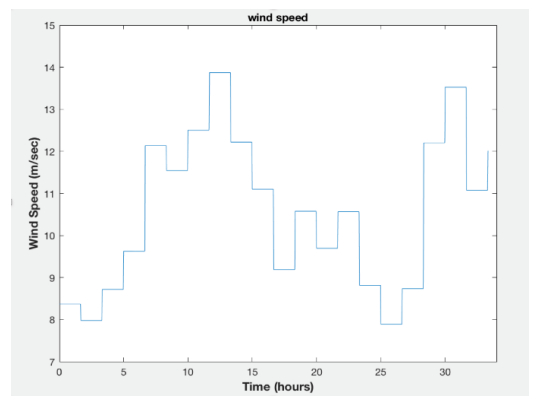
    [37] Wind Energy in Indiana. Wind data from Jan 1st 2007 to Dec 31st 2013. Available from: https://windexchange.energy.gov/states/in.
  • This article has been cited by:

    1. Liejiang Wei, Zengguang Liu, Yuyang Zhao, Gang Wang, Yanhua Tao, Modeling and Control of a 600 kW Closed Hydraulic Wind Turbine with an Energy Storage System, 2018, 8, 2076-3417, 1314, 10.3390/app8081314
    2. Zengguang Liu, Guolai Yang, Liejiang Wei, Daling Yue, Yanhua Tao, Research on the Robustness of the Constant Speed Control of Hydraulic Energy Storage Generation, 2018, 11, 1996-1073, 1310, 10.3390/en11051310
    3. Ahsan Tanveer, Farooq Khan, Muhammad Usman, M.A. Irfan, 2022, Design & Development of a Prototype Compressed Air Energy Storage Mechanism, 978-1-6654-9242-3, 1, 10.1109/ETECTE55893.2022.10007224
  • Reader Comments
  • © 2018 the Author(s), licensee AIMS Press. This is an open access article distributed under the terms of the Creative Commons Attribution License (http://creativecommons.org/licenses/by/4.0)
通讯作者: 陈斌, bchen63@163.com
  • 1. 

    沈阳化工大学材料科学与工程学院 沈阳 110142

  1. 本站搜索
  2. 百度学术搜索
  3. 万方数据库搜索
  4. CNKI搜索

Metrics

Article views(8009) PDF downloads(1818) Cited by(3)

Article outline

Figures and Tables

Figures(12)  /  Tables(2)

/

DownLoad:  Full-Size Img  PowerPoint
Return
Return

Catalog