A characteristic feature of many cancer cells, including glioblastoma and ovarian carcinoma, is their reliance on exogenous methionine for tumor proliferation. L-methioninase, an enzyme that degrades methionine, is being investigated as a potential agent for specifically targeting methionine-dependent cancers by disrupting critical cellular pathways necessary for cancer cell survival. This study evaluated the cytotoxic effects of L-methioninase (L-Met) on the glioblastoma cell line A-172 and the ovarian carcinoma cell line SK-OV-3, focusing on cell survival, nuclear integrity, and metastatic potential.
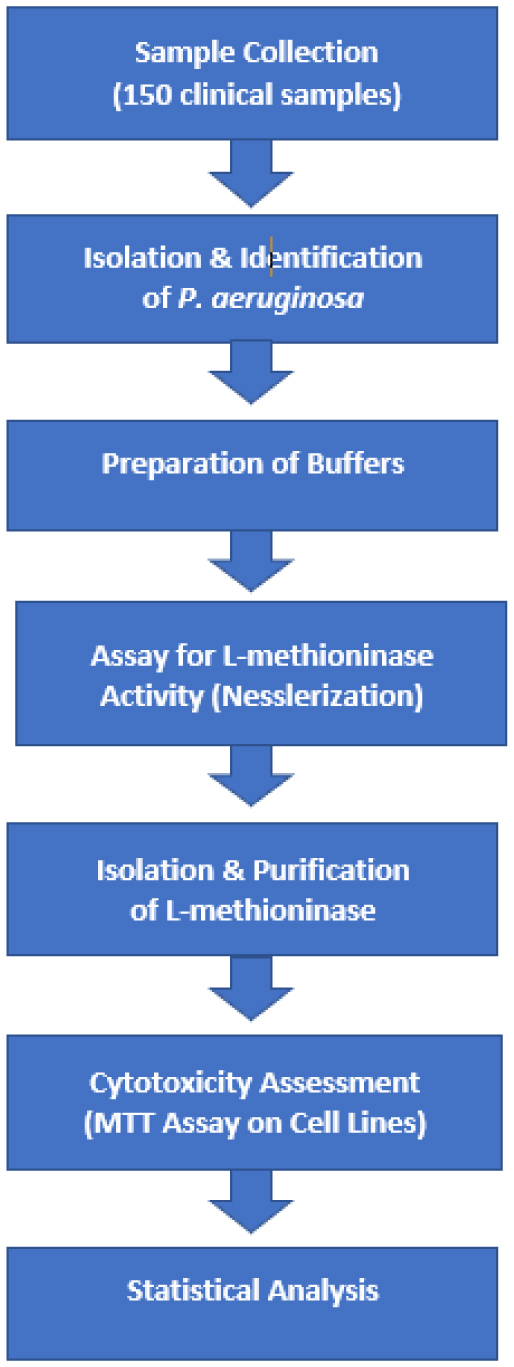
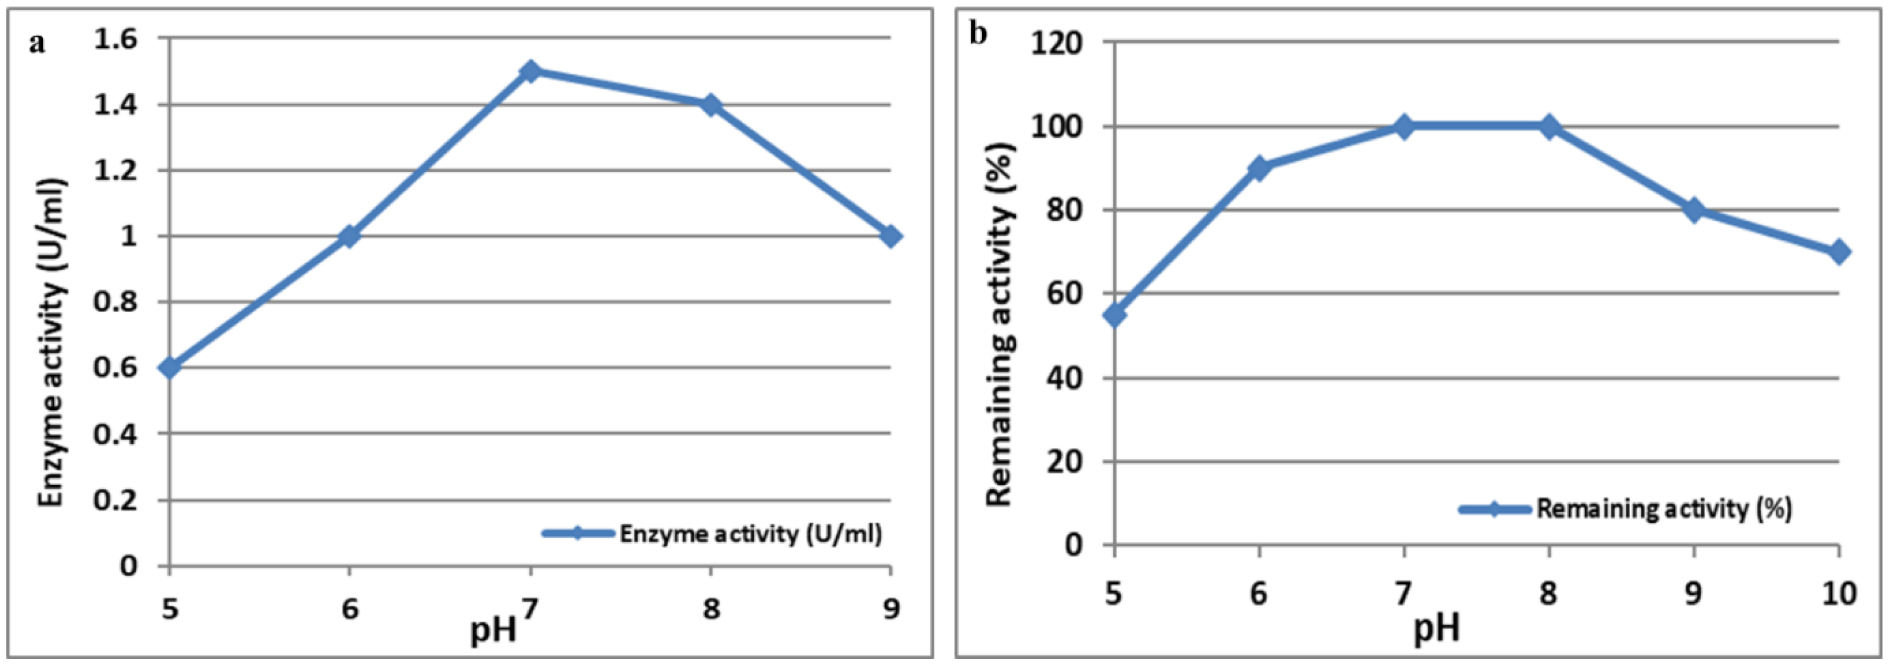
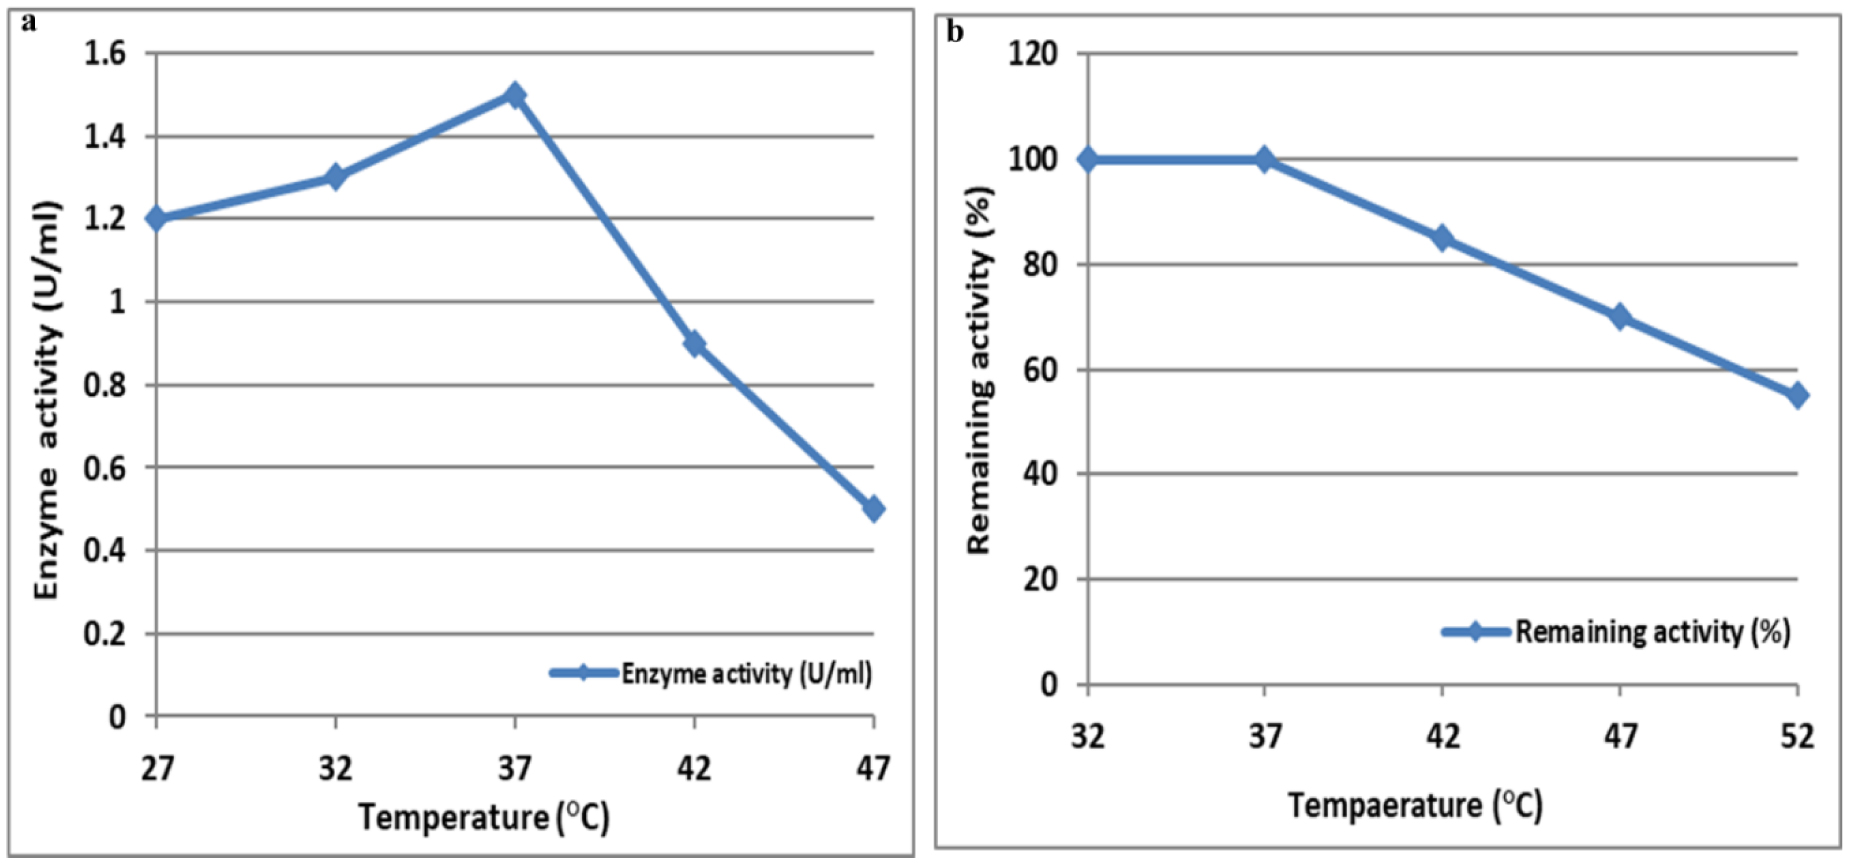
L-Met was purified and tested for activity across a 25–200 µg/mL concentration range. Cytotoxicity was assessed using MTT assays, which measured viable cell count (VCC), total nuclear intensity (TNI), cell membrane permeability (CMP), and matrix metalloproteinase (MMP) activity. IC50 values were determined using Dunnett's multiple comparisons test.
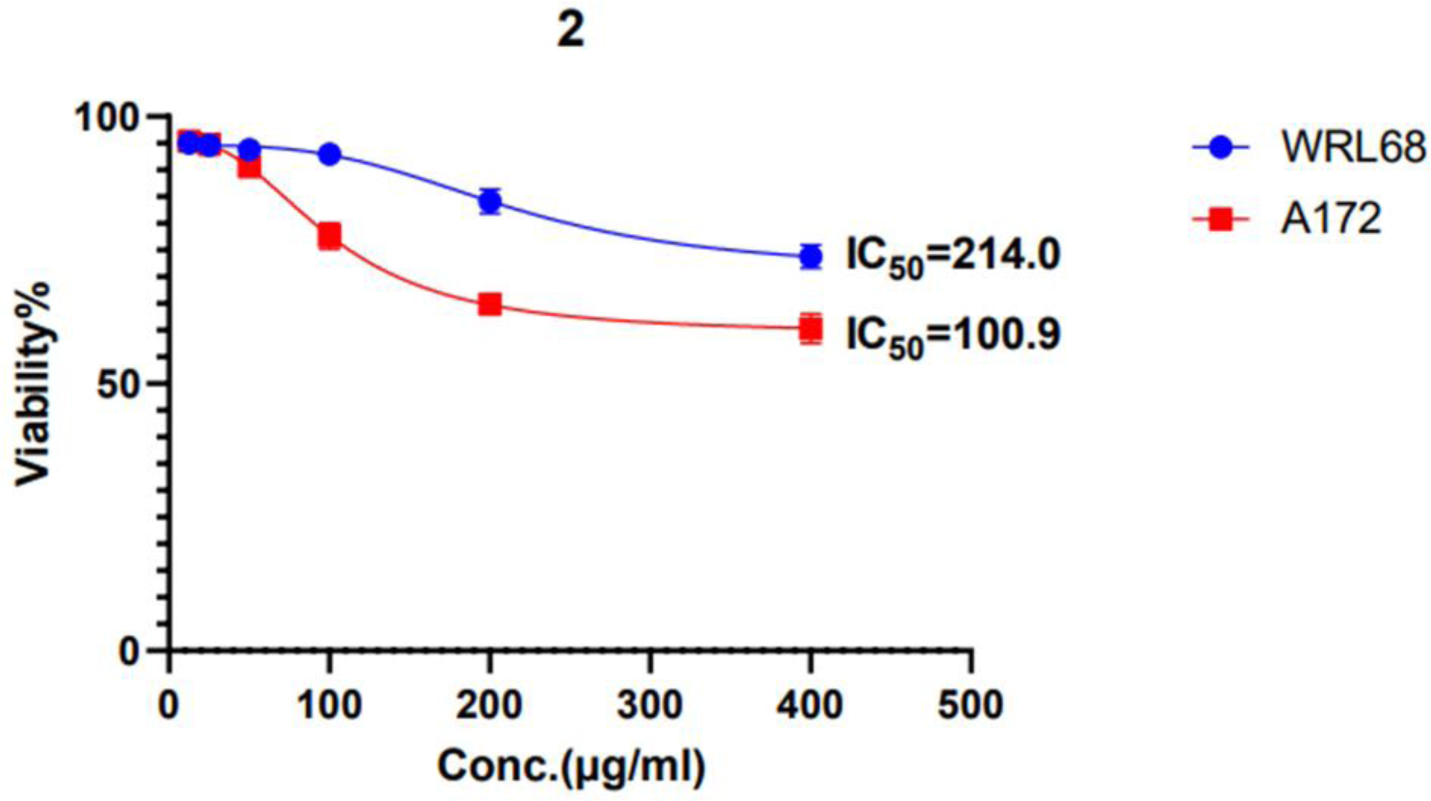
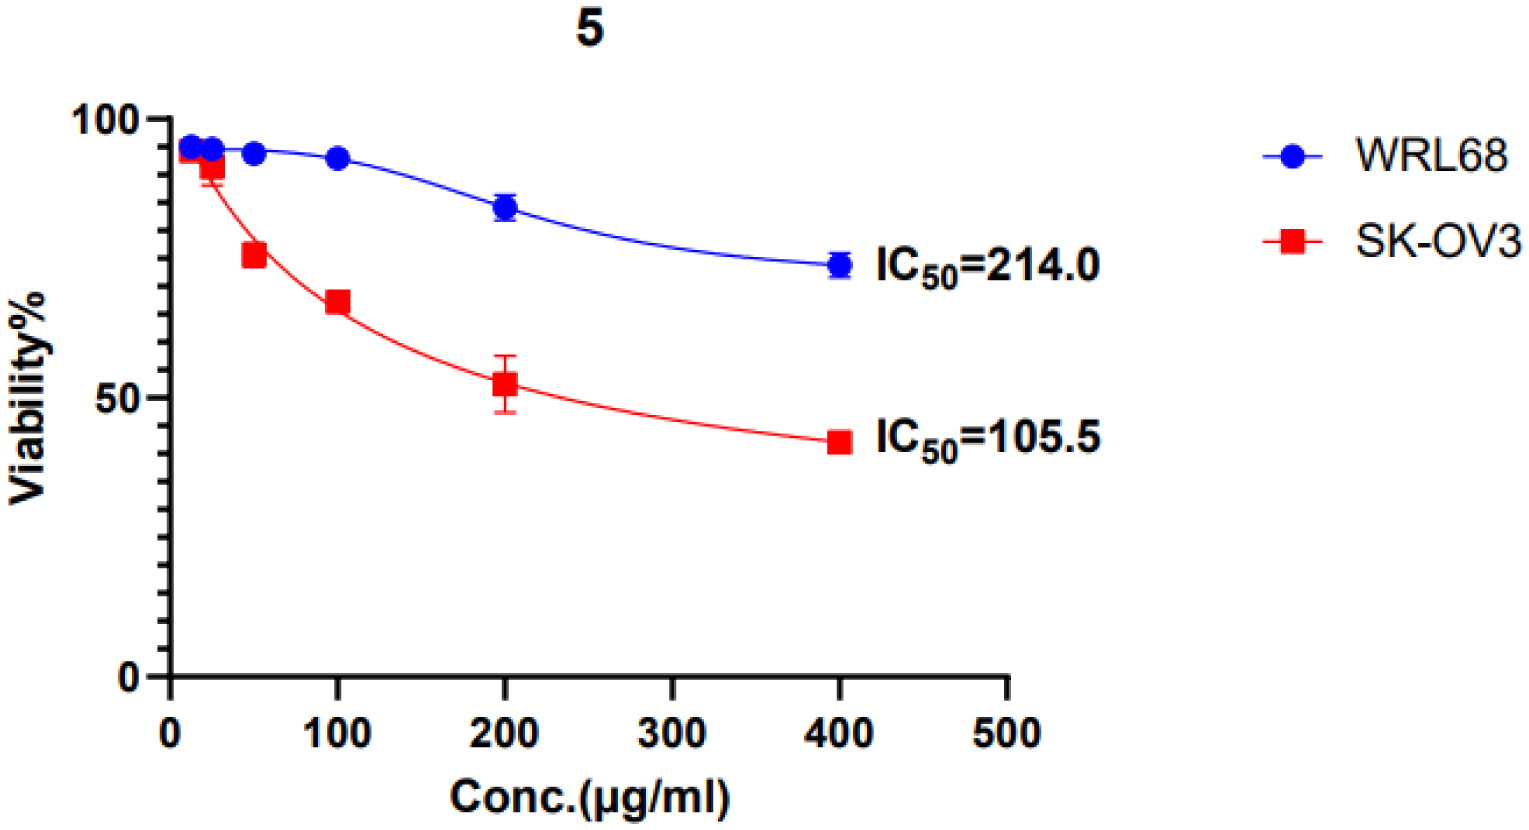
L-Met significantly decreased cell viability in a dose-dependent manner for both cell lines. In A-172 cells, 200 and 100 µg/mL doses substantially reduced VCC and induced nuclear damage. In SK-OV-3 cells, these doses similarly reduced VCC and inhibited MMP activity, suggesting metastasis suppression. The IC50 values indicate that cancer cells are more sensitive to L-methioninase treatment than normal cells.
L-Met demonstrates significant cytotoxic effects against glioblastoma and ovarian cancer cells, primarily through the induction of DNA damage, disruption of cell membranes, and suppression of metastasis. These findings support the potential of L-Met as a therapeutic agent for methionine-dependent cancers.
Citation: Abbas Abed Noor Al-Owaidi, Mohammed Abdullah Jebor. Evaluation of L-methioninase as a targeted anticancer therapy in ovarian cancer and glioblastoma[J]. AIMS Biophysics, 2025, 12(2): 197-219. doi: 10.3934/biophy.2025012
A characteristic feature of many cancer cells, including glioblastoma and ovarian carcinoma, is their reliance on exogenous methionine for tumor proliferation. L-methioninase, an enzyme that degrades methionine, is being investigated as a potential agent for specifically targeting methionine-dependent cancers by disrupting critical cellular pathways necessary for cancer cell survival. This study evaluated the cytotoxic effects of L-methioninase (L-Met) on the glioblastoma cell line A-172 and the ovarian carcinoma cell line SK-OV-3, focusing on cell survival, nuclear integrity, and metastatic potential.
L-Met was purified and tested for activity across a 25–200 µg/mL concentration range. Cytotoxicity was assessed using MTT assays, which measured viable cell count (VCC), total nuclear intensity (TNI), cell membrane permeability (CMP), and matrix metalloproteinase (MMP) activity. IC50 values were determined using Dunnett's multiple comparisons test.
L-Met significantly decreased cell viability in a dose-dependent manner for both cell lines. In A-172 cells, 200 and 100 µg/mL doses substantially reduced VCC and induced nuclear damage. In SK-OV-3 cells, these doses similarly reduced VCC and inhibited MMP activity, suggesting metastasis suppression. The IC50 values indicate that cancer cells are more sensitive to L-methioninase treatment than normal cells.
L-Met demonstrates significant cytotoxic effects against glioblastoma and ovarian cancer cells, primarily through the induction of DNA damage, disruption of cell membranes, and suppression of metastasis. These findings support the potential of L-Met as a therapeutic agent for methionine-dependent cancers.

| [1] |
Tassinari V, Jia W, Chen WL, et al. (2024) The methionine cycle and its cancer implications. Oncogene 43: 3483-3488. https://doi.org/10.1038/s41388-024-03122-0 
|
| [2] |
Wanders D, Hobson K, Ji X (2020) Methionine restriction and cancer biology. Nutrients 12: 684. https://doi.org/10.3390/nu12030684
|
| [3] |
Gao X, Sanderson SM, Dai Z, et al. (2019) Dietary methionine influences therapy in mouse cancer models and alters human metabolism. Nature 572: 397-401. https://doi.org/10.1038/s41586-019-1437-3
|
| [4] |
Wu W, Klockow JL, Zhang M, et al. (2021) Glioblastoma multiforme (GBM): an overview of current therapies and mechanisms of resistance. Pharmacol Res 171: 105780. https://doi.org/10.1016/j.phrs.2021.105780
|
| [5] |
Cavuoto P, Fenech MF (2012) A review of methionine dependency and the role of methionine restriction in cancer growth control and life-span extension. Cancer Treat Rev 38: 726-736. https://doi.org/10.1016/j.ctrv.2012.01.004
|
| [6] |
Zgheib R, Battaglia-Hsu SF, Hergalant S, et al. (2019) Folate can promote the methionine-dependent reprogramming of glioblastoma cells towards pluripotency. Cell Death Dis 10: 596. https://doi.org/10.1038/s41419-019-1836-2
|
| [7] |
Zhang S, Cheng C, Lin Z, et al. (2022) The global burden and associated factors of ovarian cancer in 1990–2019: findings from the Global Burden of Disease Study 2019. BMC Public Health 22: 1455. https://doi.org/10.1186/s12889-022-13861-y
|
| [8] |
Murali R, Balasubramaniam V, Srinivas S, et al. (2023) Deregulated metabolic pathways in ovarian cancer: cause and consequence. Metabolites 13: 560. https://doi.org/10.3390/metabo13040560
|
| [9] |
Younesian S, Mohammadi MH, Younesian O, et al. (2024) DNA methylation in human diseases. Heliyon 10: e32366. https://doi.org/10.1016/j.heliyon.2024.e32366
|
| [10] |
Ehrlich M (2019) DNA hypermethylation in disease: mechanisms and clinical relevance. Epigenetics 14: 1141-1163. https://doi.org/10.1080/15592294.2019.1638701
|
| [11] |
Landgraf BJ, McCarthy EL, Booker SJ (2016) Radical S-adenosylmethionine enzymes in human health and disease. Annu Rev Biochem 85: 485-514. https://doi.org/10.1146/annurev-biochem-060713-035504
|
| [12] |
Wanders D, Hobson K, Ji X (2020) Methionine restriction and cancer biology. Nutrients 12: 684. https://doi.org/10.3390/nu12030684
|
| [13] |
Abdelraof M, Selim MH, Elsoud MM, et al. (2019) Statistically optimized production of extracellular l-methionine γ-lyase by Streptomyces Sp. DMMMH60 and evaluation of purified enzyme in sub-culturing cell lines. Biocatal Agr Biotechnol 18: 101074. https://doi.org/10.1016/j.bcab.2019.101074
|
| [14] | Al-Zahrani NH, Bukhari KA (2019) Molecular identification, gene detection, and improving L-methioninase production of Serratia SP. isolate. Pharmacophore 10: 14-25. |
| [15] |
Aldawood AS, Al-Ezzy RM (2024) Cytotoxicity of l-methioninase purified from clinical isolates of pseudomonas species in cancer cell lines. Al-Rafidain J Med Sci 6: 46-49. https://doi.org/10.54133/ajms.v6i1.405
|
| [16] | Kholmurodov BO, Jurayev RS (2024) Quantitative analysis of vitamins and amino acids in alhagi mauro-rum plant extract. Eng Proc 67: 32. https://doi.org/10.3390/engproc2024067032 |
| [17] |
Javia BM, Gadhvi MS, Vyas SJ, et al. (2024) A review on L-methioninase in cancer therapy: precision targeting, advancements and diverse applications for a promising future. Int J Biol Macromol 265: 130997. https://doi.org/10.1016/j.ijbiomac.2024.130997
|
| [18] | Thivat E, Durando X, Demidem A, et al. (2007) A methionine-free diet associated with nitrosourea treatment down-regulates methylguanine-DNA methyl transferase activity in patients with metastatic cancer. Anticancer Res 27: 2779-2783. |
| [19] |
Locasale JW, Melman T, Song S, et al. (2012) Metabolomics of human cerebrospinal fluid identifies signatures of malignant glioma. Mol Cell Proteom 11: M111.014688. https://doi.org/10.1074/mcp.M111.014688
|
| [20] |
Kokkinakis DM, Brickner AG, Kirkwood JM, et al. (2006) Mitotic arrest, apoptosis, and sensitization to chemotherapy of melanomas by methionine deprivation stress. Mol Cancer Res 4: 575-589. https://doi.org/10.1158/1541-7786.mcr-05-0240
|
| [21] |
Lu X (2019) The role of large neutral amino acid transporter (LAT1) in cancer. Curr Cancer Drug Tar 19: 863-876. https://doi.org/10.2174/1568009619666190802135714
|
| [22] |
Cunningham A, Erdem A, Alshamleh I, et al. (2022) Dietary methionine starvation impairs acute myeloid leukemia progression. Blood 140: 2037-2052. https://doi.org/10.1182/blood.2022017575
|
| [23] |
Xin L, Yang WF, Zhang HT, et al. (2018) The mechanism study of lentiviral vector carrying methioninase enhances the sensitivity of drug-resistant gastric cancer cells to Cisplatin. Brit J Cancer 118: 1189-1199. https://doi.org/10.1038/s41416-018-0043-8
|
| [24] |
Kubota Y, Sasaki M, Han Q, et al. (2024) Efficacy of recombinant methioninase on late-stage patient cancer in the histoculture drug response assay (HDRA) as a potential functional biomarker of sensitivity to methionine-restriction therapy in the clinic. Cancer Diagn Progn 4: 239. https://doi.org/10.21873/cdp.10314
|
| [25] |
Strekalova E, Malin D, Hoelper D, et al. (2018) Abstract LB-247: targeting methionine metabolism to eradicate cancer stem cells. Cancer Res 78: LB-247. https://doi.org/10.1158/1538-7445.AM2018-LB-247
|
| [26] |
Liu Y, Guo J, Cheng H, et al. (2024) Methionine restriction diets: unravelling biological mechanisms and enhancing brain health. Trends Food Sci Tech 2024: 104532. https://doi.org/10.1016/j.tifs.2024.104532
|
| [27] |
Abdulabbas HS, Al-Mawlah YH (2023) Effect of Rs5746136 genotypes on SOD activity and biomarkers levels in breast cancer patients. AIMS Biophys 10: 1-11. https://doi.org/0.3934/biophy.2023001
|
Figures(12) / Tables(9)

Abbas Abed Noor Al-Owaidi, Mohammed Abdullah Jebor. Evaluation of L-methioninase as a targeted anticancer therapy in ovarian cancer and glioblastoma[J]. AIMS Biophysics, 2025, 12(2): 197-219. doi: 10.3934/biophy.2025012


 DownLoad: