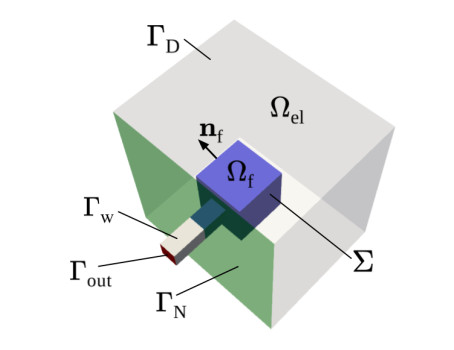
The modeling of the interaction between a poroelastic medium and a fluid in a hollow cavity is crucial for understanding, e.g., the multiphysics flow of blood and Cerebrospinal Fluid (CSF) in the brain, the supply of blood by the coronary arteries in heart perfusion, or the interaction between groundwater and rivers or lakes. In particular, the cerebral tissue's elasticity and its perfusion by blood and interstitial CSF can be described by Multi-compartment Poroelasticity (MPE), while CSF flow in the brain ventricles can be modeled by the (Navier-)Stokes equations, the overall system resulting in a coupled MPE-(Navier-)Stokes system. The aim of this paper is three-fold. First, we aim to extend a recently presented discontinuous Galerkin method on polytopal grids (PolyDG) to incorporate three-dimensional geometries and physiological interface conditions. Regarding the latter, we consider here the Beavers-Joseph-Saffman (BJS) conditions at the interface: These conditions are essential to model the friction between the fluid and the porous medium. Second, we quantitatively analyze the computational efficiency of the proposed method on a domain with small geometrical features, thus demonstrating the advantages of employing polyhedral meshes. Finally, by a comparative numerical investigation, we assess the fluid-dynamics effects of the BJS conditions and of employing either Stokes or Navier-Stokes equations to model the CSF flow. The semidiscrete numerical scheme for the coupled problem is proved to be stable and optimally convergent. Temporal discretization is obtained using Newmark's $ \beta $-method for the elastodynamics equation and the $ \theta $-method for the remaining equations of the model. The theoretical error estimates are verified by numerical simulations on a test case with a manufactured solution, and a numerical investigation is carried out on a three-dimensional geometry to assess the effects of interface conditions and fluid inertia on the system.
Citation: Ivan Fumagalli. Discontinuous Galerkin method for a three-dimensional coupled fluid-poroelastic model with applications to brain fluid mechanics[J]. Mathematics in Engineering, 2025, 7(2): 130-161. doi: 10.3934/mine.2025006
The modeling of the interaction between a poroelastic medium and a fluid in a hollow cavity is crucial for understanding, e.g., the multiphysics flow of blood and Cerebrospinal Fluid (CSF) in the brain, the supply of blood by the coronary arteries in heart perfusion, or the interaction between groundwater and rivers or lakes. In particular, the cerebral tissue's elasticity and its perfusion by blood and interstitial CSF can be described by Multi-compartment Poroelasticity (MPE), while CSF flow in the brain ventricles can be modeled by the (Navier-)Stokes equations, the overall system resulting in a coupled MPE-(Navier-)Stokes system. The aim of this paper is three-fold. First, we aim to extend a recently presented discontinuous Galerkin method on polytopal grids (PolyDG) to incorporate three-dimensional geometries and physiological interface conditions. Regarding the latter, we consider here the Beavers-Joseph-Saffman (BJS) conditions at the interface: These conditions are essential to model the friction between the fluid and the porous medium. Second, we quantitatively analyze the computational efficiency of the proposed method on a domain with small geometrical features, thus demonstrating the advantages of employing polyhedral meshes. Finally, by a comparative numerical investigation, we assess the fluid-dynamics effects of the BJS conditions and of employing either Stokes or Navier-Stokes equations to model the CSF flow. The semidiscrete numerical scheme for the coupled problem is proved to be stable and optimally convergent. Temporal discretization is obtained using Newmark's $ \beta $-method for the elastodynamics equation and the $ \theta $-method for the remaining equations of the model. The theoretical error estimates are verified by numerical simulations on a test case with a manufactured solution, and a numerical investigation is carried out on a three-dimensional geometry to assess the effects of interface conditions and fluid inertia on the system.

| [1] | M. Alnæs, J. Blechta, J. Hake, A. Johansson, B. Kehlet, A. Logg, et al., The FEniCS project version 1.5, Arch. Numer. Software, 3 (2015), 9–23. |
| [2] |
I. Ambartsumyan, E. Khattatov, I. Yotov, P. Zunino, A Lagrange multiplier method for a Stokes-Biot fluid–poroelastic structure interaction model, Numer. Math., 140 (2018), 513–553. https://doi.org/10.1007/s00211-018-0967-1 doi: 10.1007/s00211-018-0967-1

|
| [3] |
D. Anderson, J. Droniou, An arbitrary-order scheme on generic meshes for miscible displacements in porous media, SIAM J. Sci. Comput., 40 (2018), B1020–B1054. https://doi.org/10.1137/17M1138807 doi: 10.1137/17M1138807
|
| [4] |
P. F. Antonietti, P. Houston, G. Pennesi, Fast numerical integration on polytopic meshes with applications to discontinuous Galerkin finite element methods, J. Sci. Comput., 77 (2018), 1339–1370. https://doi.org/10.1007/s10915-018-0802-y doi: 10.1007/s10915-018-0802-y
|
| [5] |
P. F. Antonietti, S. Bonetti, M. Botti, M. Corti, I. Fumagalli, I. Mazzieri, $ \texttt{lymph} $: discontinuous poLYtopal methods for Multi-PHysics differential problems, ACM Trans. Math. Software, 51 (2025), 1–22. https://doi.org/10.1145/3716310 doi: 10.1145/3716310
|
| [6] | P. F. Antonietti, A. Cangiani, J. Collis, Z. Dong, E. H. Georgoulis, S. Giani, et al., Review of discontinuous Galerkin finite element methods for partial differential equations on complicated domains, In: G. Barrenechea, F. Brezzi, A. Cangiani, E. Georgoulis, Building bridges: connections and challenges in modern approaches to numerical partial differential equations, Lecture Notes in Computational Science and Engineering, Springer, 114 (2016), 281–310. https://doi.org/10.1007/978-3-319-41640-3_9 |
| [7] |
P. F. Antonietti, N. Farenga, E. Manuzzi, G. Martinelli, L. Saverio, Agglomeration of polygonal grids using graph neural networks with applications to multigrid solvers, Comput. Math. Appl., 154 (2024), 45–57. https://doi.org/10.1016/j.camwa.2023.11.015 doi: 10.1016/j.camwa.2023.11.015
|
| [8] |
P. F. Antonietti, L. Mascotto, M. Verani, S. Zonca, Stability analysis of polytopic discontinuous Galerkin approximations of the Stokes problem with applications to fluid–structure interaction problems, J. Sci. Comput., 90 (2022), 23. https://doi.org/10.1007/s10915-021-01695-6 doi: 10.1007/s10915-021-01695-6
|
| [9] |
P. Antonietti, I. Mazzieri, High-order discontinuous Galerkin methods for the elastodynamics equation on polygonal and polyhedral meshes, Comput. Methods Appl. Mech. Eng., 342 (2018), 414–437. https://doi.org/10.1016/j.cma.2018.08.012 doi: 10.1016/j.cma.2018.08.012
|
| [10] |
A. Bacyinski, M. Xu, W. Wang, J. Hu, The paravascular pathway for brain waste clearance: current understanding, significance and controversy, Front. Neuroanat., 11 (2017), 101. https://doi.org/10.3389/fnana.2017.00101 doi: 10.3389/fnana.2017.00101
|
| [11] |
S. Badia, A. Quaini, A. Quarteroni, Coupling Biot and Navier-Stokes equations for modelling fluid–poroelastic media interaction, J. Comput. Phys., 228 (2009), 7986–8014. https://doi.org/10.1016/j.jcp.2009.07.019 doi: 10.1016/j.jcp.2009.07.019
|
| [12] | O. Balédent, M. Henry-Feugeas, I. Idy-Peretti, Cerebrospinal fluid dynamics and relation with blood flow: a magnetic resonance study with semiautomated cerebrospinal fluid segmentation, Invest. Radiol., 36 (2001), 368–377. |
| [13] |
N. A. Barnafi Wittwer, S. D. Gregorio, L. Dede', P. Zunino, C. Vergara, A. Quarteroni, A multiscale poromechanics model integrating myocardial perfusion and the epicardial coronary vessels, SIAM J. Appl. Math., 82 (2022), 1167–1193. https://doi.org/10.1137/21M1424482 doi: 10.1137/21M1424482
|
| [14] |
G. S. Beavers, D. D. Joseph, Boundary conditions at a naturally permeable wall, J. Fluid Mech., 30 (1967), 197–207. https://doi.org/10.1017/S0022112067001375 doi: 10.1017/S0022112067001375
|
| [15] |
L. Bociu, S. Canic, B. Muha, J. T. Webster, Multilayered poroelasticity interacting with Stokes flow, SIAM J. Math. Anal., 53 (2021), 6243–6279. https://doi.org/10.1137/20M1382520 doi: 10.1137/20M1382520
|
| [16] |
D. Boffi, M. Botti, D. A. Di Pietro, A nonconforming high-order method for the Biot problem on general meshes, SIAM J. Sci. Comput., 38 (2016), A1508–A1537. https://doi.org/10.1137/15M1025505 doi: 10.1137/15M1025505
|
| [17] |
W. M. Boon, M. Kuchta, K. A. Mardal, R. Ruiz-Baier, Robust preconditioners for perturbed saddle-point problems and conservative discretizations of Biot's equations utilizing total pressure, SIAM J. Sci. Comput., 43 (2021), B961–B983. https://doi.org/10.1137/20M1379708 doi: 10.1137/20M1379708
|
| [18] |
J. W. Both, N. A. Barnafi, F. A. Radu, P. Zunino, A. Quarteroni, Iterative splitting schemes for a soft material poromechanics model, Comput. Methods Appl. Mech. Eng., 388 (2022), 114183. https://doi.org/10.1016/j.cma.2021.114183 doi: 10.1016/j.cma.2021.114183
|
| [19] | L. Botti, M. Botti, D. A. Di Pietro, A hybrid high-order method for multiple-network poroelasticity, In: D. A. Di Pietro, L. Formaggia, R. Masson, Polyhedral methods in geosciences, Springer, 27 (2021), 227–258. https://doi.org/10.1007/978-3-030-69363-3_6 |
| [20] |
G. S. Brennan, T. B. Thompson, H. Oliveri, M. E. Rognes, A. Goriely, The role of clearance in neurodegenerative diseases, SIAM J. Appl. Math., 84 (2024), S172–S198. https://doi.org/10.1137/22M1487801 doi: 10.1137/22M1487801
|
| [21] |
M. Bucelli, A. Zingaro, P. C. Africa, I. Fumagalli, L. Dede', A. Quarteroni, A mathematical model that integrates cardiac electrophysiology, mechanics, and fluid dynamics: application to the human left heart, Int. J. Numer. Methods Biomed. Eng., 39 (2023), e3678. https://doi.org/10.1002/cnm.3678 doi: 10.1002/cnm.3678
|
| [22] |
S. Budday, G. Sommer, J. Haybaeck, P. Steinmann, G. A. Holzapfel, E. Kuhl, Rheological characterization of human brain tissue, Acta Biomater., 60 (2017), 315–329. https://doi.org/10.1016/j.actbio.2017.06.024 doi: 10.1016/j.actbio.2017.06.024
|
| [23] |
M. Bukač, I. Yotov, P. Zunino, An operator splitting approach for the interaction between a fluid and a multilayered poroelastic structure, Numer. Meth. Part. D. E., 31 (2015), 1054–1100. https://doi.org/10.1002/num.21936 doi: 10.1002/num.21936
|
| [24] |
A. Cangiani, E. H. Georgoulis, P. Houston, $hp$-Version discontinuous Galerkin methods on polygonal and polyhedral meshes, Math. Mod. Meth. Appl. Sci., 24 (2014), 2009–2041. https://doi.org/10.1142/S0218202514500146 doi: 10.1142/S0218202514500146
|
| [25] |
M. Causemann, V. Vinje, M. E. Rognes, Human intracranial pulsatility during the cardiac cycle: a computational modelling framework, Fluids Barriers CNS, 19 (2022), 84. https://doi.org/10.1186/s12987-022-00376-2 doi: 10.1186/s12987-022-00376-2
|
| [26] |
X. Chen, F. Ti, M. Li, S. Liu, T. J. Lu, Theory of fluid saturated porous media with surface effects, J. Mech. Phys. Solids, 151 (2021), 104392. https://doi.org/10.1016/j.jmps.2021.104392 doi: 10.1016/j.jmps.2021.104392
|
| [27] |
S. W. Cheung, E. Chung, H. H. Kim, Y. Qian, Staggered discontinuous Galerkin methods for the incompressible Navier-Stokes equations, J. Comput. Phys., 302 (2015), 251–266. https://doi.org/10.1016/j.jcp.2015.08.024 doi: 10.1016/j.jcp.2015.08.024
|
| [28] |
D. Chou, J. C. Vardakis, L. Guo, B. J. Tully, Y. Ventikos, A fully dynamic multi-compartmental poroelastic system: application to aqueductal stenosis, J. Biomech., 49 (2016), 2306–2312. https://doi.org/10.1016/j.jbiomech.2015.11.025 doi: 10.1016/j.jbiomech.2015.11.025
|
| [29] |
M. Corti, P. F. Antonietti, L. Dede', A. M. Quarteroni, Numerical modelling of the brain poromechanics by high-order discontinuous Galerkin methods, Math. Mod. Meth. Appl. Sci., 33 (2023), 1577–1609. https://doi.org/10.1142/S0218202523500367 doi: 10.1142/S0218202523500367
|
| [30] |
F. Dassi, D. Mora, C. Reales, I. Velásquez, Mixed variational formulations of virtual elements for the polyharmonic operator $(-\Delta)^n$, Comput. Math. Appl., 158 (2024), 150–166. https://doi.org/10.1016/j.camwa.2024.01.013 doi: 10.1016/j.camwa.2024.01.013
|
| [31] |
S. Deparis, G. Grandperrin, A. Quarteroni, Parallel preconditioners for the unsteady Navier-Stokes equations and applications to hemodynamics simulations, Comput. Fluids, 92 (2014), 253–273. https://doi.org/10.1016/j.compfluid.2013.10.034 doi: 10.1016/j.compfluid.2013.10.034
|
| [32] |
A. Dereims, S. Drapier, J. M. Bergheau, P. De Luca, 3D robust iterative coupling of Stokes, Darcy and solid mechanics for low permeability media undergoing finite strains, Finite Elem. Anal. Des., 94 (2015), 1–15. https://doi.org/10.1016/j.finel.2014.09.003 doi: 10.1016/j.finel.2014.09.003
|
| [33] |
S. Di Gregorio, M. Fedele, G. Pontone, A. F. Corno, P. Zunino, C. Vergara, et al., A computational model applied to myocardial perfusion in the human heart: from large coronaries to microvasculature, J. Comput. Phys., 424 (2021), 109836. https://doi.org/10.1016/j.jcp.2020.109836 doi: 10.1016/j.jcp.2020.109836
|
| [34] |
M. Discacciati, E. Miglio, A. Quarteroni, Mathematical and numerical models for coupling surface and groundwater flows, Appl. Numer. Math., 43 (2002), 57–74. https://doi.org/10.1016/S0168-9274(02)00125-3 doi: 10.1016/S0168-9274(02)00125-3
|
| [35] |
I. N. Drøsdal, K. A. Mardal, K. Støverud, V. Haughton, Effect of the central canal in the spinal cord on fluid movement within the cord, Neuroradiology J., 26 (2013), 585–590. https://doi.org/10.1177/197140091302600513 doi: 10.1177/197140091302600513
|
| [36] |
E. Eliseussen, M. E. Rognes, T. B. Thompson, A posteriori error estimation and adaptivity for multiple-network poroelasticity, ESAIM: M2AN, 57 (2023), 1921–1952. https://doi.org/10.1051/m2an/2023033 doi: 10.1051/m2an/2023033
|
| [37] |
M. Esmaily Moghadam, Y. Bazilevs, T. Y. Hsia, I. E. Vignon-Clementel, A. L. Marsden, Modeling of Congenital Hearts Alliance (MOCHA), A comparison of outlet boundary treatments for prevention of backflow divergence with relevance to blood flow simulations, Comput. Mech., 48 (2011), 277–291. https://doi.org/10.1007/s00466-011-0599-0 doi: 10.1007/s00466-011-0599-0
|
| [38] |
M. Feder, A. Cangiani, L. Heltai, R3MG: R-tree based agglomeration of polytopal grids with applications to multilevel methods, J. Comput. Phys., 526 (2025), 113773. https://doi.org/10.1016/j.jcp.2025.113773 doi: 10.1016/j.jcp.2025.113773
|
| [39] |
M. Ferronato, A. Franceschini, C. Janna, N. Castelletto, H. A. Tchelepi, A general preconditioning framework for coupled multiphysics problems with application to contact-and poro-mechanics, J. Comput. Phys., 398 (2019), 108887. https://doi.org/10.1016/j.jcp.2019.108887 doi: 10.1016/j.jcp.2019.108887
|
| [40] |
I. Fumagalli, M. Corti, N. Parolini, P. F. Antonietti, Polytopal discontinuous Galerkin discretization of brain multiphysics flow dynamics, J. Comput. Phys., 513 (2024), 113115. https://doi.org/10.1016/j.jcp.2024.113115 doi: 10.1016/j.jcp.2024.113115
|
| [41] |
I. Fumagalli, M. Fedele, C. Vergara, L. Dede', S. Ippolito, F. Nicolò, et al., An image-based computational hemodynamics study of the systolic anterior motion of the mitral valve, Comput. Biol. Med., 123 (2020), 103922. https://doi.org/10.1016/j.compbiomed.2020.103922 doi: 10.1016/j.compbiomed.2020.103922
|
| [42] |
C. Geuzaine, J. F. Remacle, Gmsh: a 3-D finite element mesh generator with built-in pre-and post-processing facilities, Int. J. Numer. Meth. Eng., 79 (2009), 1309–1331. https://doi.org/10.1002/nme.2579 doi: 10.1002/nme.2579
|
| [43] |
L. Guo, J. C. Vardakis, T. Lassila, M. Mitolo, N. Ravikumar, D. Chou, et al., Subject-specific multi-poroelastic model for exploring the risk factors associated with the early stages of alzheimer's disease, Interface Focus, 8 (2018), 20170019. https://doi.org/10.1098/rsfs.2017.0019 doi: 10.1098/rsfs.2017.0019
|
| [44] | L. M. Hablitz, M. Nedergaard, The glymphatic system, Curr. Biol., 31 (2021), R1371–R1375. |
| [45] |
M. Hirschhorn, V. Tchantchaleishvili, R. Stevens, J. Rossano, A. Throckmorton, Fluid–structure interaction modeling in cardiovascular medicine – a systematic review 2017–2019, Med. Eng. Phys., 78 (2020), 1–13. https://doi.org/10.1016/j.medengphy.2020.01.008 doi: 10.1016/j.medengphy.2020.01.008
|
| [46] |
K. E. Holter, B. Kehlet, A. Devor, T. J. Sejnowski, A. M. Dale, S. W. Omholt, et al., Interstitial solute transport in 3D reconstructed neuropil occurs by diffusion rather than bulk flow, Proceedings of the National Academy of Sciences, 114 (2017), 9894–9899. https://doi.org/10.1073/pnas.1706942114 doi: 10.1073/pnas.1706942114
|
| [47] |
G. Karypis, V. Kumar, A fast and high quality multilevel scheme for partitioning irregular graphs, SIAM J. Sci. Comput., 20 (1998), 359–392. https://doi.org/10.1137/S1064827595287997 doi: 10.1137/S1064827595287997
|
| [48] |
H. H. Kim, E. T. Chung, C. S. Lee, A staggered discontinuous Galerkin method for the Stokes system, SIAM J. Numer. Anal., 51 (2013), 3327–3350. https://doi.org/10.1137/120896037 doi: 10.1137/120896037
|
| [49] |
W. J. Layton, F. Schieweck, I. Yotov, Coupling fluid flow with porous media flow, SIAM J. Numer. Anal., 40 (2002), 2195–2218. https://doi.org/10.1137/S0036142901392766 doi: 10.1137/S0036142901392766
|
| [50] |
J. J. Lee, E. Piersanti, K. A. Mardal, M. E. Rognes, A mixed finite element method for nearly incompressible multiple-network poroelasticity, SIAM J. Sci. Comput., 41 (2019), A722–A747. https://doi.org/10.1137/18M1182395 doi: 10.1137/18M1182395
|
| [51] |
J. Li, B. Riviere, High order discontinuous Galerkin method for simulating miscible flooding in porous media, Comput. Geosci., 19 (2015), 1251–1268. https://doi.org/10.1007/s10596-015-9541-4 doi: 10.1007/s10596-015-9541-4
|
| [52] |
K. Lipnikov, D. Vassilev, I. Yotov, Discontinuous Galerkin and mimetic finite difference methods for coupled Stokes-Darcy flows on polygonal and polyhedral grids, Numer. Math., 126 (2014), 321–360. https://doi.org/10.1007/s00211-013-0563-3 doi: 10.1007/s00211-013-0563-3
|
| [53] | A. Logg, K. A. Mardal, G. Wells, Automated solution of differential equations by the finite element method, The FEniCS book, Vol. 84, Springer Science & Business Media, 2012. https://doi.org/10.1007/978-3-642-23099-8 |
| [54] |
K. A. Mardal, M. E. Rognes, T. B. Thompson, Accurate discretization of poroelasticity without Darcy stability: Stokes-Biot stability revisited, BIT Numer. Math., 61 (2021), 941–976. https://doi.org/10.1007/s10543-021-00849-0 doi: 10.1007/s10543-021-00849-0
|
| [55] | K. A. Mardal, M. E. Rognes, T. B. Thompson, L. M. Valnes, Mathematical modeling of the human brain, From Magnetic Resonance Images to Finite Element Simulation, Vol. 10, Springer, 2022. https://doi.org/10.1007/978-3-030-95136-8 |
| [56] |
K. A. Mardal, R. Winther, Uniform preconditioners for the time dependent Stokes problem, Numer. Math., 98 (2004), 305–327. https://doi.org/10.1007/s00211-004-0529-6 doi: 10.1007/s00211-004-0529-6
|
| [57] |
C. Michler, A. N. Cookson, R. Chabiniok, E. Hyde, J. Lee, M. Sinclair, et al., A computationally efficient framework for the simulation of cardiac perfusion using a multi-compartment Darcy porous-media flow model, Int. J. Numer. Meth. Biomed. Eng., 29 (2013), 217–232. https://doi.org/10.1002/cnm.2520 doi: 10.1002/cnm.2520
|
| [58] |
A. S. Mijailovic, S. Galarza, S. Raayai-Ardakani, N. P. Birch, J. D. Schiffman, A. J. Crosby, et al., Localized characterization of brain tissue mechanical properties by needle induced cavitation rheology and volume controlled cavity expansion, J. Mech. Behav. Biomed. Mater., 114 (2021), 104168. https://doi.org/10.1016/j.jmbbm.2020.104168 doi: 10.1016/j.jmbbm.2020.104168
|
| [59] | A. Quarteroni, L. Dede', A. Manzoni, C. Vergara, Mathematical modelling of the human cardiovascular system: data, numerical approximation, clinical applications, Vol. 33, Cambridge University Press, 2019. https://doi.org/10.1017/9781108616096 |
| [60] |
S. Saeidi, M. P. Kainz, M. Dalbosco, M. Terzano, G. A. Holzapfel, Histology-informed multiscale modeling of human brain white matter, Sci. Rep., 13 (2023), 19641. https://doi.org/10.1038/s41598-023-46600-3 doi: 10.1038/s41598-023-46600-3
|
| [61] |
P. G. Saffman, On the boundary condition at the surface of a porous medium, Stud. Appl. Math., 50 (1971), 93–101. https://doi.org/10.1002/sapm197150293 doi: 10.1002/sapm197150293
|
| [62] | E. M. Stein, Singular integrals and differentiability properties of functions, Princeton University Press, 1970. |
| [63] |
S. Sun, M. F. Wheeler, Symmetric and nonsymmetric discontinuous Galerkin methods for reactive transport in porous media, SIAM J. Numer. Anal., 43 (2005), 195–219. https://doi.org/10.1137/S003614290241708X doi: 10.1137/S003614290241708X
|
| [64] |
B. Sweetman, M. Xenos, L. Zitella, A. A. Linninger, Three-dimensional computational prediction of cerebrospinal fluid flow in the human brain, Comput. Biol. Med., 41 (2011), 67–75. https://doi.org/10.1016/j.compbiomed.2010.12.001 doi: 10.1016/j.compbiomed.2010.12.001
|
| [65] | R. Temam, Navier-Stokes equations: theory and numerical analysis, Vol. 343, American Mathematical Society, 2001. |
| [66] |
J. Tithof, K. A. Boster, P. A. Bork, M. Nedergaard, J. H. Thomas, D. H. Kelley, A network model of glymphatic flow under different experimentally-motivated parametric scenarios, iScience, 25 (2022), 104258. https://doi.org/10.1016/j.isci.2022.104258 doi: 10.1016/j.isci.2022.104258
|
| [67] |
E. J. Ulbrich, C. Schraner, C. Boesch, J. Hodler, A. Busato, S. E. Anderson, et al., Normative MR cervical spinal canal dimensions, Radiology, 271 (2014), 172–182. https://doi.org/10.1148/radiol.13120370 doi: 10.1148/radiol.13120370
|
| [68] |
J. Wen, Y. He, A strongly conservative finite element method for the coupled Stokes-Biot model, Comput. Math. Appl., 80 (2020), 1421–1442. https://doi.org/10.1016/j.camwa.2020.07.001 doi: 10.1016/j.camwa.2020.07.001
|
| [69] |
L. Zhao, E. T. Chung, E. J. Park, G. Zhou, Staggered DG method for coupling of the Stokes and Darcy–Forchheimer problems, SIAM J. Numer. Anal., 59 (2021), 1–31. https://doi.org/10.1137/19M1268525 doi: 10.1137/19M1268525
|
| [70] | S. Zonca, P. F. Antonietti, C. Vergara, A polygonal discontinuous Galerkin formulation for contact mechanics in fluid-structure interaction problems, Commun. Comput. Phys., 30 (2021), 1–33. |
| [71] |
S. Zonca, C. Vergara, L. Formaggia, An unfitted formulation for the interaction of an incompressible fluid with a thick structure via an XFEM/DG approach, SIAM J. Sci. Comput., 40 (2018), B59–B84. https://doi.org/10.1137/16M1097602 doi: 10.1137/16M1097602
|


Figures(10) / Tables(1)

Ivan Fumagalli. Discontinuous Galerkin method for a three-dimensional coupled fluid-poroelastic model with applications to brain fluid mechanics[J]. Mathematics in Engineering, 2025, 7(2): 130-161. doi: 10.3934/mine.2025006


 DownLoad: