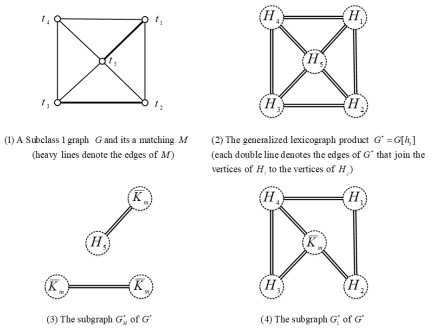
Research article Special Issues

Edge-coloring of generalized lexicographic product of graphs

  • An edge-coloring of a graph G is an assignment of colors to its edges so that no two edges incident to the same vertex receive the same color. The chromatic index of G, denoted by χ(G), is the least k for which G has a k edge-coloring. Graphs with χ(G)=Δ(G) are said to be Class 1, and graphs with χ(G)=Δ(G)+1 are said to be Class 2. Let G be a graph with V(G)={t1,t2,,tn}, n2, and hn=(Hi)i{1,2,,n} be a sequence of vertex-disjoint graphs with V(Hi)={(ti,y1),(ti,y2),,(ti,ymi)}, mi1. The generalized lexicographic product G[hn] of G and hn=(Hi)i{1,2,,n} is a simple graph with vertex set ni=1V(Hi), in which (ti,yp) is adjacent to (tj,yq) if and only if either ti=tj and (ti,yp)(ti,yq)E(Hi) or titjE(G). If G is a complete graph with order 2, then G[h2] denotes a join H1+H2 of vertex-disjoint graphs H1 and H2. If HiH for i=1,2,,n, then G[hn]=G[H], where G[H] denotes the lexicographic product of two graphs G and H. In this paper, we provide sufficient conditions for the generalized lexicographic product G[hn] of G and hn=(Hi)i{1,2,,n} to be Class 1, where all graphs in hn have the same number of vertices.

    Citation: Shuangliang Tian, Ping Chen. Edge-coloring of generalized lexicographic product of graphs[J]. AIMS Mathematics, 2024, 9(6): 15988-15995. doi: 10.3934/math.2024774

    Related Papers:

    [1] Michael Z. Hu, Peng Lai . Substrate effect on nanoporous structure of silica wires by channel-confined self-assembly of block-copolymer and sol-gel precursors. AIMS Materials Science, 2015, 2(4): 346-355. doi: 10.3934/matersci.2015.4.346
    [2] Amany Mahmoud, Ehssan Nassef, Hesham Salah, Yehia El-taweel . Use of hydrazide derivative of poly methylacrylate for the removal of cupric ions from solutions. AIMS Materials Science, 2020, 7(4): 420-430. doi: 10.3934/matersci.2020.4.420
    [3] Lucangelo Dimesso, Michael Wussler, Thomas Mayer, Eric Mankel, Wolfram Jaegermann . Inorganic alkali lead iodide semiconducting APbI3 (A = Li, Na, K, Cs) and NH4PbI3 films prepared from solution: Structure, morphology, and electronic structure. AIMS Materials Science, 2016, 3(3): 737-755. doi: 10.3934/matersci.2016.3.737
    [4] Dorel Feldman . Poly(vinyl alcohol) nanocomposites: Recent contributions to engineering and medicine. AIMS Materials Science, 2021, 8(1): 119-129. doi: 10.3934/matersci.2021008
    [5] K. Ravindranadh, K. Durga Venkata Prasad, M.C. Rao . Spectroscopic and luminescent properties of Co2+ doped tin oxide thin films by spray pyrolysis. AIMS Materials Science, 2016, 3(3): 796-807. doi: 10.3934/matersci.2016.3.796
    [6] Yuguo Tao, Vijaykumar Upadhyaya, Keenan Jones, Ajeet Rohatgi . Tunnel oxide passivated rear contact for large area n-type front junction silicon solar cells providing excellent carrier selectivity. AIMS Materials Science, 2016, 3(1): 180-189. doi: 10.3934/matersci.2016.1.180
    [7] Giovanna Di Pasquale, Salvatore Graziani, Chiara Gugliuzzo, Antonino Pollicino . Ionic polymer-metal composites (IPMCs) and ionic polymer-polymer composites (IP2Cs): Effects of electrode on mechanical, thermal and electromechanical behaviour. AIMS Materials Science, 2017, 4(5): 1062-1077. doi: 10.3934/matersci.2017.5.1062
    [8] Gérrard Eddy Jai Poinern, Nurshahidah Ali, Xuan Le, Derek Fawcett . Nano-hardness and elastic modulus of anodic aluminium oxide based Poly (2-hydroxyethylmethacrylate) composite membranes. AIMS Materials Science, 2014, 1(3): 159-173. doi: 10.3934/matersci.2014.3.159
    [9] Wisatre Kongcharoensuntorn, Pornpen Atorngitjawat . Influence of chlorotrifluoroethylene on crystal structure and polymer dynamics of poly(vinylidenefluoride-co-chlorotrifluoroethylene) antibacterial copolymers. AIMS Materials Science, 2023, 10(1): 164-181. doi: 10.3934/matersci.2023009
    [10] Stephanie Flores Zopf, Matthew J. Panzer . Integration of UV-cured Ionogel Electrolyte with Carbon Paper Electrodes. AIMS Materials Science, 2014, 1(1): 59-69. doi: 10.3934/matersci.2014.1.59
  • An edge-coloring of a graph G is an assignment of colors to its edges so that no two edges incident to the same vertex receive the same color. The chromatic index of G, denoted by χ(G), is the least k for which G has a k edge-coloring. Graphs with χ(G)=Δ(G) are said to be Class 1, and graphs with χ(G)=Δ(G)+1 are said to be Class 2. Let G be a graph with V(G)={t1,t2,,tn}, n2, and hn=(Hi)i{1,2,,n} be a sequence of vertex-disjoint graphs with V(Hi)={(ti,y1),(ti,y2),,(ti,ymi)}, mi1. The generalized lexicographic product G[hn] of G and hn=(Hi)i{1,2,,n} is a simple graph with vertex set ni=1V(Hi), in which (ti,yp) is adjacent to (tj,yq) if and only if either ti=tj and (ti,yp)(ti,yq)E(Hi) or titjE(G). If G is a complete graph with order 2, then G[h2] denotes a join H1+H2 of vertex-disjoint graphs H1 and H2. If HiH for i=1,2,,n, then G[hn]=G[H], where G[H] denotes the lexicographic product of two graphs G and H. In this paper, we provide sufficient conditions for the generalized lexicographic product G[hn] of G and hn=(Hi)i{1,2,,n} to be Class 1, where all graphs in hn have the same number of vertices.


    Solid polymer electrolytes (SPEs) have been the subject of intense research. Interest in these systems is motivated by their properties and prospective applications in batteries, solar cells and electrochemical devices. Electrolyte of such a type consists of a polymer matrix loaded with an inorganic salt. Among most frequently studied systems are alkali metal salts (mainly lithium or sodium) dissolved in poly(ethylene oxide) (PEO) or poly(propylene oxide) [1].

    Research effort is focused on better understanding physical origin of observed properties, in particular these related to charge transport, and to optimize electrolytes for practical applications. Technologically relevant are mostly systems containing high amount of dissolved salt and therefore high concentration of solvated ions. However, depending on electrolyte composition and temperature, salt precipitation may occur in SPEs [2]. From technological point of view this is an undesirable phenomenon, but investigations of this process may provide better understanding of interactions between ions and polymer.

    Systematic experimental studies of salt precipitation were performed for alkali metal iodides MeI (Me = Li-Cs) in PEO between 40 and 200 ℃ [2]. Tendency to ion agammaegation increases with the cation radius and temperature. It has been found that for PEO/LiI and PEO/NaI electrolytes conductivity increases with temperature whereas conductivity of systems with heavier ions decreases above a critical temperature and is the lowest for PEO/Cs systems. More detailed analysis of ion migration was performed in [2] for PEO/RbI electrolyte. Ion transport and ion pairing was then studied for PEO/NaI systems in the range of concentration and temperatures where precipitation does not occur [3].

    Theoretical modeling of PEO-based electrolytes was focused mainly on systems with lithium salts. Quantum chemical calculations provided information on Li+ interactions with model solvent molecules (usually simple ethers or oligoglymes) [4,5,6,7,8] and classical molecular dynamics (MD) simulations were used to study the structure and transport properties of PEO/Li+ electrolytes [9,10,11,12,13,14,15,16]. Studies involving other alkali cations and PEO-type solvent are less common [17,18,19]. Owing to increasing interest in electrolytes for sodium ion batteries several quantum chemical and MD studies on systems with Na+ cation have been reported recently [20,21,22,23,24]. Simulations of polymer electrolytes are focused on conditions of technological relevance, i.e. on systems with low degree of ion agammaegation. However, from methodological point of view, it is important to test theoretical approaches also on systems exhibiting less common properties. In such a way methodology used in simulations may be validated and information on its performance at extreme conditions provides better insight into the physics of observed processes making possible improvements of simulation protocols or parameterization with prospective benefits for routine modeling of common systems.

    Availability of experimental data on salt precipitation in PEO/MeI electrolytes offers a possibility to validate computational simulations on these model systems. In this work we want to assess the performance of a polarizable force field for PEO-based electrolytes on model systems of the kind investigated experimentally in [2], in order to check whether classical MD simulations can describe properly ion association process and its dependence on temperature and electrolyte composition. Based on quantum chemical calculations, parameterization of the force field will be adjusted and results of simulations will be analyzed to track the ion agammaegation and estimate diffusivity and conductivity of electrolyte.

    Gaussian 09 rev. D.01 [25] was used for all quantum-chemical (QC) calculations in this work. Optimized structures were found for Me+-I- ion pairs and Me+ complexes with oligoglyme molecules in vacuum. MP2 methodology with def2-TZVP basis set was used in geometry optimizations and calculations of binding energies. Outermost core orbitals were included in MP2 calculations (FC1 option in Gaussian 09). Different Me+ coordination numbers (CNs) were modeled in Me-oligoglyme complexes: CN = 1, 2 and 3 in Me+-diglyme structures and CN = 4, 5 and 6 in the complexes with tri-, tetra- and pentaglyme, respectively (Cf. plots of K-oligoglyme complexes in the Supplementary Information in Figure S1).

    Selected parameters of optimized structures (distances and binding energies for MeI or Me+-oligoglyme complexes) are presented in the Supplementary Information in Tables S1, S2 and S3. With the radius of the Me+ cation increasing from Li+ to Cs+, the Me-I and Me-O distances increase and the binding energy is reduced.

    Molecular dynamics simulations were performed using Tinker v.5.1 package [26]. The polarizable force field for PEO employed here in MD was the same as the parameterization described in Reference [27]. Bonded parameters for oligoglymes and PEO were based on the APPLE & P (atomistic polarizable potential for liquids, electrolytes & polymers) parametrization [28]. Non-bonded parameters (Lennard-Jones potential, polarizabilities and partial charges) were adapted from an earlier work on PEO-based electrolytes [15]. The parameterization of PEO and oligoglyme molecules was supplemented by van der Waals parameters and polarizabilities of Me+ and I- ions taken from the polarizable Amoeba potential [29] parameters. This set of parameters will be referred here as FF0 force field.

    To assess the performance of the force field parameterizaton, molecular mechanics with FF0 field was used to compute geometries and binding energies for the same set of structures as studied earlier in QC calculations. Results are presented in the Supplementary Information in Tables S2 and S3. FF0 underestimates the Me+-I- distances for smaller ions (Li and Na) and overestimates the binding energy of MeI. This overestimate is particularly significant for LiI in which case the difference between QC and FF0 values exceeds 40 kcal/mol. On the other hand, FF0 underestimates Me+ binding to glymes, yielding too large distances and too small energetic effect; the differences between QC and FF0 again are the largest for Li and Na. Moreover, test MD runs for LiI solution in pentaglyme indicated that large polarizability of I- ion (7.25 Å3) causes the “polarizability catastrophe” leading to increasing induced dipole moments and nonphysically short Li-I distances. These results show that polarizability of the anion is one of key parameters of the force field controlling the dynamics of ion agammaegation.

    Therefore, a modified parameterization of the force-field was developed. The polarizability of I anion was reduced to 5.5 Å3. Additionally, parameters of the Lennard-Jones potential for the Me+-I- and Me+-O pair interactions were modified in order to achieve simultaneously the best reproduction of Me-I and Me-O distances and MeI or Me+-glyme binding energies in molecular mechanics geometry optimizations. Resulting parameterization was labeled FF1; the list of modified interactions is shown in Table S4, calculated structural parameters and energies are collected in the Supplementary Information in Tables S2 and S3. The agreement between QC data and FF1 results, although still not perfect, is significantly better than between QC and FF0, except binding energies of Li+ and Cs+ to pentaglyme (CN = 6). In general, the FF1 field overestimates binding of Me+ to the I- ion and underestimates the effect of Me+ interaction with oligoglyme molecule. It turned out that all efforts to further improve the agreement between QC and FF1 energies degrade the agreement between optimized structures of Me+-oligoglyme; therefore the final FF1 parameterization was chosen as a compromise between reproduction of binding energies and the geometries of complexes.

    Molecular dynamics simulations were performed for series of PEO structures with dissolved MeI salt, Me = Li, Na, K, Rb and Cs. Each simulation box contained 6 CH3-terminated PEO chains of 50 repeat units. Amorphous structures constructed in our earlier work on PEO [15] by Polymer Builder and Amorphous Cell from Materials Studio [30] were reused as initial structures. Each structure was loaded by 10 MeI ion pairs, yielding the ratio [Me]/[O] = 1:30, cAForresponding to (PEO)30MeI electrolyte of Reference [2]. Additionally, as a test to check the effect of low weight oligoglymes, structures of 15 MeI pairs in 75 pentaglyme molecules ([Me]/[O] = 1:30) were prepared using Packmol software [31]. The (PEO)30MeI and pentaglyme/MeI samples contained 2132 and 3330 atoms, respectively. The size of the simulation cell depended on the temperature and for (PEO)30MeI was between 27 and 28.4 Å, whereas for pentaglyme/MeI systems it varied between 31.9 and 33.8 Å.

    The goal of this work is to study the ion pairing process in the electrolyte, therefore it is important that the ions are distributed rather uniformly in the initial structures, with cations and anions separated. Otherwise, the ion pairs already present at the start of the simulation may affect the paring dynamics. Therefore, to break the ion pairs in the initial system, a short NVT MD run was performed with the electrostatic interactions switched off and the temperature raised to 500 K. Two different frames from this trajectory were selected to initiate two independent runs for (PEO)30MeI electrolytes; a single trajectory was simulated for each pentaglyme/MeI system.

    Molecular simulations were run in the NpT ensemble, with p = 1 atm and five different temperatures for each system: T = 40, 65, 100, 150 and 200 ℃. The Bussi-Parrinello thermostat and Berendsen barostat were used with 0.1 ps of the coupling time for the temperature bath. Equations of motion were integrated by Beeman algorithm with 1 fs time step. Ewald summation was used for electrostatic interactions. Polarization effects were treated within an iterative procedure used to achieve self-convergence of mutual interactions between induced dipoles. To prevent over-polarization the Thole scheme of short-polarization damping [32] was applied. After 15 ns (for pentaglyme/MeI) or 20 ns (for (PEO)30MeI) of the equilibration stage the MD trajectory was collected in 5 ps intervals for another 40 or 50 ns for pentaglyme and PEO systems, respectively.

    Densities of all systems were calculated as averages over the MD trajectory after the equilibration stage. Results are displayed in Figure 1 and numerical values are collected in the Supplementary Information (Table S5). Within investigated temperature range, density decreases almost linearly with temperature. Density of the electrolyte loaded with MeI salt increases in the order Li < Na < K < Rb < Cs with small differences (up to 0.02 g/cm3) for Li, Na and K and major increase for Cs and Rb. Systems based on pentaglyme have densities about 0.1 g/cm3 lower than corresponding PEO electrolytes. The density of (PEO)30NaI at 40 ℃ is 1.24 g/cm3 and agrees well with the value 1.26 g/cm3 reported in [3], given that the experimental density presumably was measured at lower temperature.

    Figure 1.  Densities of electrolytes averaged over the last 5 ns of the MD trajectory. Solid lines and filled symbols: (PEO)30MeI systems, broken lines and open symbols: pentaglyme/MeI systems.

    Increasing radii of Me+ ions result in increasing distances to I- anions or to oxygen atoms from PEO chains or pentaglyme molecules. Radial distribution functions (RDFs) for Me-O and Me-I atom pairs are displayed in Figures S2 and S3. Position of the first maximum in Me-O RDF increases from Li+ to Cs+: the maximum appears at 2, 2.4, 2.8, 2.95 and 3.15 Å for Li+, Na+, K+, Rb+ and Cs+, respectively. In the Me-I RDF the maximum is located at 2.6, 2.9, 3.35, 3.6 and 3.7 Å for Me+ changing from Li+ to Cs+, respectively. In both cases, peaks in RDFs for heavier cations are lower and wider than for Li+ and Na+.

    Even a short glimpse at the evolution of the structure of the system recorded during MD run reveals that Me+ cations and I- anions initially dispersed in the electrolyte as separated ions, form pairs and then larger ion agammaegates within first few nanoseconds of simulation. Agammaegation proceeds further during the simulation and its speed apparently depends on the cation and temperature. In Figure 2 sample snapshots of the system close to the end of simulation are presented for selected cations and temperatures. At 40 ℃ ion agammaegates are the smallest. Increase of the temperature to 100 or 200 ℃ reduces the number of agammaegates and increases their size. At 200 ℃ the number of agammaegates is the largest in electrolytes with LiI and NaI. On the other hand, at highest temperature all ions in KI, RbI (not shown in Figure 2) and CsI-based systems form a single crystallite.

    Figure 2.  Sample snapshots of the ion aggregates in (PEO)30MeI electrolytes at the end of MD simulation. Polymer chains in the plot have been wrapped into the simulation box.

    To obtain more quantitative assessment of ion agammaegation process, changes in the number of ion clusters during the MD simulation were computed for all systems. An agammaegate was defined as a set of ions such that each ion has at least one other ion of the agammaegate within a threshold distance. With such a definition a single ion separated from all other ions by the distance larger than the threshold value counts as an agammaegate, therefore maximum number of ion clusters in the sample can reach 2×N, where N is the number of MeI ion pairs, i.e., 20 and 30 for (PEO)30MeI and pentaglyme/MeI systems, respectively. Threshold distances depended on the system and were set to the distance at which the Me-I RDF becomes negligibly small above its first maximum, i.e., 3.1, 3.5, 4.0, 4.5 and 4.5 Å for Li+, Na+, K+, Rb+ and Cs+, respectively.

    Mean values of the number of agammaegates Nagamma for (PEO)30MeI electrolytes (averaged over last 5 ns of two trajectories) are collected in Table 1. Changes in the number of ion clusters during MD run for (PEO)30MeI and pentaglyme/MeI at T = 40, 100 and 200 ℃ are displayed in Figures 3 and 4. Plots for two other temperatures are available in the Supplementary Information as Figures S4 and S5 and tabulated data for pentaglyme/MeI are collected in Table S6.

    Table 1.  Average number of ion aggregates and its standard deviation during last 5 ns of MD simulations for (PEO)30MeI electrolytes.
    T, ℃ Li Na K Rb Cs
    40 9.00 ± 0.02 6.00 ± 0.01 5.70 ± 0.29 5.05 ± 0.16 5.04 ± 0.15
    65 6.00 ± 0.02 4.06 ± 0.16 4.51 ± 0.06 2.25 ± 0.27 1.86 ± 0.32
    100 6.00 ± 0.01 2.50 ± 0.01 2.50 ± 0.01 1.03 ± 0.11 1.40 ± 0.20
    150 2.51 ± 0.06 1.66 ± 0.24 1.01 ± 0.01 1.00 ± 0.01 1.01 ± 0.08
    200 3.00 ± 0.01 2.11 ± 0.21 1.00 ± 0.01 1.00 ± 0.01 1.01 ± 0.02

     | Show Table
    DownLoad: CSV
    Figure 3.  Changes in the number of ion aggregates Naggr in the sample during MD simulations of (PEO)30MeI electrolytes at (a) 40 ℃, (b) 100 ℃, (c) 200 ℃. Moving average has been used to smooth the plot.
    Figure 4.  Changes in the number of ion aggregates Naggr in the sample during MD simulations of pentaglyme/MeI electrolytes at (a) 40 ℃, (b) 100 ℃, (c) 200 ℃. Moving average has been used to smooth the plot.

    At T = 40-100 ℃ average number of ion agammaegates in PEO/LiI system is noticeably larger than in other PEO-based electrolytes. At elevated temperatures number of agammaegates decreases and reaches one (single crystallite) in the systems with KI, RbI and CsI, but remains larger than one in electrolytes loaded with LiI and NaI. It may be noted in Figure 3 that at higher temperatures the number of agammaegates remains approximately constant after about 30 ns, while some systematic decrease is still observed at 40 ℃, especially for Me = Rb or Cs.

    Similar trends (decrease of Nagamma with increasing temperature and/or cation radius) are visible for pentaglyme/MeI systems in Figure 4; note that the total number of ions in these systems is larger than in the PEO-based, therefore the same number of agammaegates in PEO or pentaglyme electrolytes indicates higher degree of ion paring in the pentaglyme samples. The changes in the initial part of the trajectory are faster; this observation may be attributed to lower viscosity of the electrolyte based on low-weight solvent compared to PEO systems and faster ions movement in the former. In pentaglyme electrolytes with KI, RbI and CsI all ions precipitated as a single agammaegate even at 100 ℃. On the other hand, number of ion clusters in LiI and NaI electrolytes at T ≥ 100 ℃ is larger than one and seems to be stable after 25 ns; behavior of analogous PEO-based systems is similar. This suggests that at the highest studied temperatures we reached the numbers of agammaegates close to equilibrium, but the length of the trajectories was probably too short to reach this stage at 40 ℃.

    Closer look into the data reveals that in most cases where there is more than one ion cluster in the sample, the agammaegates are electrically neutral (of course this is the sole possibility in structures in which all ions have agammaegated into a single crystallite). Only at lowest temperatures in the electrolytes with LiI and NaI one or two pairs of charged agammaegates appear during the MD run. For low temperatures and light cations also the short events (lasting not longer than the time separation between consecutive frames of the trajectory) of appearing and disappearing pair of charges are more probable than for elevated T and/or higher ions. Ion pairing into stable neutral agammaegates in most systems will significantly reduce conductivity of the electrolyte.

    The number of ions in the sample is constant, therefore the average size of agammaegates is inversely proportional to Nagamma. In order to check the size-distribution of the agammaegates we counted the number of agammaegates of given size at the end of the MD trajectories. Sample data for Li+ and different temperatures or for 65 ℃ and different ions are presented in the Supplementary Information in Figures S6 and S7. The size of agammaegates increases with temperature or with the radius of the cation. It may be noted that only for low temperatures there are some odd-sized (i.e. charged) agammaegates present in the system.

    The difference in the degree of agammaegation for different cations arises most likely from different relative strength of Me+-I- and Me+-O interactions. Calculated binding effects of Me+ ion to the I- anion and to the oligoglyme molecule (Tables S1 and S3) become smaller with increasing cation size. However, the decrease for Me+-O interactions is faster than in the case of cation-anion pairs: the binding effect of the glyme calculated quantum-chemically for the CN = 6 decreases by about 65 kcal/mol when Li+ changes to Cs+, whereas the binding effect of the ion pair decreases only by 41 kcal/mol. Therefore for larger cations formation of ion pairs and agammaegates becomes more favorable. On the other hand, the effect of increasing agammaegation at elevated temperature is related to the entropy. When agammaegates are formed, there are less cation-glyme interactions, therefore the dynamics of the polymer (or the glyme) increases and the agammaegation increases entropy of the system. For larger temperatures the -TΔS contribution to the Gibbs free energy of agammaegation becomes more negative, i.e. more stabilizing.

    To relate structure of the electrolyte and degree of ion pairing to observed transport properties, diffusion coefficients and electrical conductivities were estimated for studied electrolytes based on ion displacements recorded during MD simulations.

    Diffusion coefficient of ion i was calculated using Eq 1 from the slope of the time dependence of its mean square displacement (MSD):

    Di=limt16t|Ri(t)Ri(0)|2 (1)

    Conductivity of the system can be calculated using Eq 2 from the Einstein formula as [33]:

    λ=limte26tVkBTi,jzizj[Ri(t)Ri(0)][Rj(t)Rj(0)] (2)

    In the above formulas t stands for time, V is the volume of the simulation box, kB stands for the Boltzmann’s constant, T is the temperature, e is elementary charge, zi and zj are the charges of ions i and j, Ri(t) is the position of i-th ion at time t and the brackets denote the ensemble average.

    The conductivity is related to the collective ion diffusion coefficient [33] via Eq 3:

    Dcoll=limt16tNi,jzizj[Ri(t)Ri(0)][Rj(t)Rj(0)] (3)

    N is the total number of ions in the system. Collective ion diffusion coefficient Dcoll would reduce to the average of anion and cation diffusion coefficients Davg = (D- + D+)/2 if there is no correlation between movements of different ions, i.e. when the off-diagonal terms in Eq 3 are negligibly small. Ratio Dcoll/Davg may therefore serve as an estimate of the degree to which the cation and anion motions are correlated.

    Accurate estimates of transport properties require long simulation times and sufficient averaging. In the long-time limit the mean square displacements of ions should be proportional to time: MSD ~ tα with the exponent α = 1. This is the normal diffusion regime observed when the particle has no memory of its previous positions. For many systems at shorter times anomalous diffusion with α < 1 occurs before system reaches the normal diffusion limit. This happens in particular for polymer electrolytes, because ions are trapped in local energy minima and therefore their positions are correlated at short time scales. Only in the long time limit the ions are able to overcome energy barriers and their motions follow a random walk.

    In the modeling of transport properties of electrolytes long simulation times are therefore needed not only to enable sufficient averaging over time intervals used to calculate MSD but also to reach the normal diffusion regime in which conditions to apply Eq 1 are fulfilled. For the purpose of estimating diffusion coefficients averaging the data over all ions in the sample improves statistics and reduces the noise. On the other hand, conductivity is a collective property and increasing the number of ions in the sample does not improve statistics for collective diffusion coefficient. Therefore Dcoll and conductivity exhibit substantially larger statistical noise than D+ or D-.

    Within the time scale of MD simulations reported in this work the long time regime of ion movements could be reached only in some samples. Moreover, electrolyte structure undergoes significant changes at the beginning of simulation related to ion agammaegation and this part of the trajectory should not be used in calculations of diffusion. This further limits the length of useable trajectory. Computed estimates of transport properties are therefore subject to significant statistical errors. Nevertheless, selected data are described in this section to present some general trends. Last 20-40 ns of MD trajectories were used to calculate MSDs.

    In Figure 5 MSD of anions and cations are displayed for selected temperatures and two systems: (PEO)30NaI and (PEO)30RbI. In many PEO-based electrolytes anions diffuse faster than metal cations because the latter are coordinated to the oxygen atoms from polymer backbone. This trend of D- exceeding D+ was also observed in experimental studies [2]. In general, this is not the case in our MD simulations. The largest difference between Me+ and I- diffusion was found for (PEO)30NaI at 40 ℃. As readily seen in Figure 4; at 65 ℃ anions in (PEO)30RbI move only a little faster than cations. In other systems MSDs for anions and cations are almost the same, as shown in two examples for T = 200 ℃ in Figure 5. This result is related to the structure of electrolyte: as described in the preceding section, in most samples the ions form neutral agammaegates and practically there are no free ions. Therefore diffusivity of anions and cations is limited by the diffusion of the whole agammaegate or ion pair and is the same for positive and negative ions. In fact, upon strong agammaegation conditions, the estimated values of diffusion coefficients may be viewed as the diffusion coefficients of the agammaegates.

    Figure 5.  Mean square displacements (MSD) of Me+ and I- ions during MD simulations of (PEO)30NaI at (a) 40 ℃ and (b) 200 ℃ or (PEO)30RbI at (c) 65 ℃ and (d) 200 ℃.

    Based on the displacements of ions shown in Figure 5, the diffusion coefficients in (PEO)30NaI were estimated as DNa = 9 × 10⁻⁹ and DI = 1.5 × 10⁻⁸ cm2/s at 40 ℃ and DNa = DI = 6 × 10⁻⁷ cm2/s at 200 ℃. From Figure 12 of Refenerce [3] follows that true diffusivities obtained from experimental data of Na and I ions are less than 10-8 and about 10-7 cm2/s, respectively, at 40 ℃ and about 10-5 and 10-6 cm2/s at 200 ℃. Therefore at both temperatures experimentally determined diffusion coefficient for the anion is about an order of magnitude larger than for the cation, which is not seen in MD-based data for the reason described above.

    Because in almost all studied systems diffusivity of anions and cations is the same, only average mean square displacements are displayed in Figures 6 and 7 to show the temperature dependence of diffusion for (PEO)30MeI electrolytes (plots for selected pentaglyme/MeI systems are available in the Supplementary Information in Figure S8). MSD plots vs. time are approximately linear only for (PEO)30LiI electrolyte or for other cations at low temperatures. For other systems lines bend down or exhibit a noise indicating that the linear regime of normal diffusion had not been reached and/or the averaging over time intervals is still insufficient.

    Figure 6.  Averages of mean square displacement of cations and anions in (PEO)30MeI electrolytes; Me = (a) Li, (b) Na, and (c) K.
    Figure 7.  Averages of mean square displacement of cations and anions in (PEO)30MeI electrolytes; Me = (a) Rb, and (b) Cs.

    Average diffusion coefficients Dav = (D+ + D-)/2 estimated from average MSDs are collected in Table 2; the errors of calculated values are quite large and reach 30-40% for higher temperatures/larger cations. It is clear from Figures 6 and 7 and numerical data from Table 2 that for all PEO/MeI electrolytes the increase of temperature leads to substantial increase of diffusivity. Diffusion coefficients at 200 ℃ are almost two orders of magnitude larger than at 40 ℃. For given temperature, diffusivity decreases with increasing radius of Me+ ion. Lower viscosity of electrolytes with pentaglyme results in increased diffusivity of ions: diffusion coefficients for pentaglyme/MeI typically are about one or two orders of magnitude larger than corresponding (PEO)30MeI system.

    Table 2.  Average ion diffusion coefficients Dav (in cm2/s) estimated from MD simulations for (PEO)30MeI electrolytes.
    T, ℃ Li Na K Rb Cs
    40 1 × 10⁻⁸ 1 × 10⁻⁸ 6 × 10⁻⁹ 9 × 10⁻⁹ 9 × 10⁻⁹
    65 4 × 10⁻⁸ 2 × 10⁻⁸ 2 × 10⁻⁸ 2 × 10⁻⁸ 2 × 10⁻⁸
    100 1 × 10⁻⁷ 7 × 10⁻⁸ 7 × 10⁻⁸ 3 × 10⁻⁸ 5 × 10⁻⁸
    150 2 × 10⁻⁷ 2 × 10⁻⁷ 7 × 10⁻⁸ 7 × 10⁻⁸ 4 × 10⁻⁸
    200 8 × 10⁻⁷ 7 × 10⁻⁷ 2 × 10⁻⁷ 6 × 10⁻⁷ 4 × 10⁻⁷

     | Show Table
    DownLoad: CSV

    For PEO/LiI and PEO/NaI the diffusion coefficients exhibit Arrhenius relationship with changing temperature: Dav ~ Cexp(-Ea/RT) as shown in Figure S9 in Supplementary Information. Fit to the data yields Ea between 7.4 and 7.9 kcal/mol. For heavier cations the fitting was not attempted because of larger uncertainties of diffusion coefficients.

    Collective mean displacements of ions in electrolytes with NaI and RbI are shown in Figure 8; data for different cations in PEO and pentaglyme are presented in Supplementing Information in Figures S10 and S11. Collective displacements are similar for both systems and decrease with temperature. This decrease may seem surprising at the first glimpse, because the MSDs for individual ions increase with temperature. It is the consequence of increasing ion agammaegation: when the ions of opposite charge move together in pairs, their contributions to Dcoll cancel in Eq 3. It is readily seen that the collective ion displacements are reduced by several orders of magnitude with respect to average MSDs shown in Figures 6 and 7; providing additional evidence that motions of ions with different charges are strongly correlated. MSDav/MSDcoll ratio is the largest for highest temperatures suggesting that this correlation increases with temperature. It should be also noted that values of MSDcoll are significantly smaller in pentaglyme electrolytes compared to PEO, and this observation, together with the fact that individual diffusivities are larger in pentaglyme, leads to the conclusion that in pentaglyme the correlation between ion movements becomes extremely strong. With our knowledge on the structure of simulated electrolytes we may attribute this fact to the degree of ion agammaegation which increases with temperature and is generally larger in pentaglyme solutions.

    Figure 8.  Collective mean displacements of ions in (a) PEO/NaI, (b) PEO/RbI, (c) pentaglyme/NaI, and (d) pentaglyme/RbI electrolytes.

    Using the collective ion displacements we calculated conductivities of selected systems shown in Figure 8. For (PEO)30NaI conductivity was estimated as 2.5 × 10⁻⁵, 1.4 × 10⁻⁵ and 1.1 × 10⁻⁶ S/cm at T = 40, 65 and 200 ℃, respectively. Conductivity of (PEO)30RbI is 2.6 ×10⁻⁵ at 65 ℃ and 3.7×10⁻⁶ S/cm at 200 ℃. Note that decrease of the conductivity of electrolytes with temperature is faster than decrease of collective MSDs, because temperature appears in the denominator in the Eq 2.

    Changes in the structure of the electrolyte and the trends observed in ion agammaegation in the results of MD simulations are in general agreement with experimental findings of Ref. [2] that increasing cation size in the series of MeI iodides and high temperatures increase the tendency for salt precipitation in PEO-based electrolytes. Results showed that after few nanoseconds most ions formed ion pairs or larger agammaegates.

    Closer inspection of the statistics of agammaegate size and charge as well as estimates of electrical conductivity reveals, however, significant differences between simulations and experiment. The effect of ion agammaegation seems to be overestimated in molecular dynamics. Except for PEO/LiI and PEO/NaI systems at lowest temperatures all ions are present only in electrically neutral pairs or larger agammaegates. Even in the systems with Li+ and Na+ percentage of free ions is very small and in the (PEO)30NaI system is lower than free-ion fraction reported in [3].

    As a consequence of practically complete pairing of ion charges, calculated diffusion coefficients do not differ between Me+ and I- because all ions move together as a whole agammaegate. Larger diffusivity of I- observed experimentally requires that a fraction of anions is free and moves independently of free cations (which move slower because of their interactions with oxygen atoms from PEO).

    Another difference with respect to the experiment is the fact that conductivities do not depend much on the salt and for all Me cations decrease with increasing temperature. In experiment such conductivity decrease is observed for K+ and heavier cations as the effect of salt precipitation. This feature is qualitatively reproduced in simulations, but for systems with LiI and NaI molecular dynamics does not agree with experimental observation of monotonic conductivity increase with temperature. This disagreement again may be attributed to negligibly low fraction of free ions and too strong agammaegation in MD simulations. Indeed, diffusivities increase with the temperature and it is the very strong correlation between ion movements (resulting from agammaegation into electrically neutral clusters) which reduces collective ion displacement and the conductivity to too low values.

    Origin of this problem may be the force field parameterization. As described in the section discussing the force field, even the improved FF1 overestimates Me+-I- pairing simultaneously underestimating Me+ interactions with polymer. Therefore the tendency of salt ions to agammaegate is too strong and can not be compensated by Me-PEO interactions. Overestimated ion agammaegation reduces strongly the conductivity, leading to the nonlinearity of the MSD curves for individual ions and, in particular, for non-linear collective mean displacements. The natural route to improve the computational description of ion pair formation in PEO loaded with MeI will be therefore an attempt to develop a better force field. It is also desirable that the parameterization (including effects of polarizability) is less computationally expensive and the software enables parallelization making possible simulations of larger systems for longer times. Increasing system size will improve statistics of free ions, pairs and agammaegates affected by finite system size, while long simulation time will help to reduce the noise in calculated mean square displacements and will make possible to observe infrequent events contributing to conductivity such as dissociation of the agammaegate. Faster simulations will make possible additional averaging over several systems, which together with increased length of trajectories will help to reduce the nonlinearity observed in the mean displacement curves. The results obtained in this work suggest that MD with improved parameterization could be capable of proper description of ion agammaegation. Improved analysis of the statistics of ion agammaegates, stability of ion pairs and ratio of free ions would provide additional insights into the ion transport at microscopic level.

    Computational modeling of salt precipitation in a series of solid polymer electrolytes containing alkali metal iodides was performed. Existing parameterization of a polarizable force field for PEO/(lithium salt) was modified on the basis of quantum chemical calculations to improve description of interactions of metal ion with iodide anion and polymer molecule. Analysis of the force field indicated that large polarizability of I- anion is a factor contributing largely to ion pairing process. Molecular dynamics simulations were performed for systems with MeI (Me = Li-Cs) salts and temperature ranging from 40 to 200 ℃.

    Analysis of changes in the structure of the electrolyte during simulation revealed increasing tendency for ion agammaegation and salt precipitation for heavier cations and at elevated temperature in qualitative agreement with experimental data [2] suggesting that molecular dynamics can reproduce interactions between ions and polymer in PEO loaded with iodides. Diffusivities of ions estimated from MD data increase with temperature and in most cases are equal for cations and anions due to ion pairing. Except systems with light cations at low temperatures practically all ions precipitate in the form of electrically neutral agammaegates. For all salts the conductivity decreases with temperature (despite increasing diffusivities) as an effect of strong correlation between movements of oppositely charged ions. Some of these results are in disagreement with experiment; a possible reason of this discrepancy may originate from the deficiencies of the force field.

    Therefore simulations with improved force field, aiming at larger systems and longer simulation times are planned for future studies, in particular for PEO/NaI and PEO/RbI systems for which more detailed analysis of experimental data [2,3] is available.

    This work was supported by the National Science Centre (Poland) grant no. UMO-2016/21/B/ST4/02110.

    Author declares no conflicts of interest in this paper.


    [1] A. G. Chetwynd, A. J. W. Hilton, Regular graphs of high degree are 1-factorizable, Proc. London Math. Soc., 50 (1985), 193–206. https://doi.org/10.1112/plms/s3-50.2.193 doi: 10.1112/plms/s3-50.2.193
    [2] R. Diestel, Graph Theory, Berlin: Springer-Verlag, 2017.
    [3] I. Holyer, The NP-completeness of edge-coloring, SIAM J. Comput., 10 (1981), 718–720. https://doi.org/10.1137/0210055 doi: 10.1137/0210055
    [4] M. M. M. Jaradat, On the Anderson-Lipman conjecture and some related problems, Discrete Math., 297 (2005), 167–173. https://doi.org/10.1016/j.disc.2004.09.012 doi: 10.1016/j.disc.2004.09.012
    [5] B. Mohar, On edge colorability of products of graphs, Publ. Inst. Math., 36 (1984), 13–16.
    [6] C. De Simonea, A. Galluccio, Edge-colouring of joins of regular graphs Ⅰ, J. Comb. Optim., 18 (2009), 417–428. https://doi.org/10.1007/s10878-009-9235-8 doi: 10.1007/s10878-009-9235-8
    [7] C. De Simonea, A. Galluccio, Edge-colouring of joins of regular graphs Ⅱ, J. Comb. Optim., 25 (2013), 78–90. https://doi.org/10.1007/s10878-011-9420-4 doi: 10.1007/s10878-011-9420-4
    [8] C. De Simone, A. Galluccio, Edge-colouring of regular graphs of large degree, Theoret. Comput. Sci., 389 (2007), 91–99. https://doi.org/10.1016/j.tcs.2007.07.046 doi: 10.1016/j.tcs.2007.07.046
    [9] C. De Simonea, C. Picinin de Mello, Edge-colouring of join graphs, Theoret. Comput. Sci., 355 (2006), 364–370. https://doi.org/10.1016/j.tcs.2005.12.010 doi: 10.1016/j.tcs.2005.12.010
    [10] W. Szumny, I. Włoch, A. Włoch, On the existence and on the number of (k,1)-kernels in the lexicographic product of graphs, Discrete Math., 308 (2008), 4616–4624. https://doi.org/10.1016/j.disc.2007.08.078 doi: 10.1016/j.disc.2007.08.078
    [11] D. B. West, Introduction to Graph Theory, 2 Eds., Englewood Cliffs: Prentice-Hall, 2000.
  • This article has been cited by:

    1. Hema Teherpuria, Prabhat K. Jaiswal, Santosh Mogurampelly, On the nature of ion aggregation in EC-LiTFSI electrolytes, 2025, 1463-9076, 10.1039/D4CP04606D
  • Reader Comments
  • © 2024 the Author(s), licensee AIMS Press. This is an open access article distributed under the terms of the Creative Commons Attribution License (http://creativecommons.org/licenses/by/4.0)
通讯作者: 陈斌, bchen63@163.com
  • 1. 

    沈阳化工大学材料科学与工程学院 沈阳 110142

  1. 本站搜索
  2. 百度学术搜索
  3. 万方数据库搜索
  4. CNKI搜索

Metrics

Article views(1021) PDF downloads(46) Cited by(0)

Figures and Tables

Figures(2)

Other Articles By Authors

/

DownLoad:  Full-Size Img  PowerPoint
Return
Return

Catalog