The current ribosome has evolved from the primitive stages of life on Earth. Its function is to build proteins and on the basis of this role, we are looking for a universal common ancestor to the ribosome which could: i) present optimal combinatorial properties, and ii) have left vestiges in the current molecules composing the ribosome (rRNA or r-proteins) or helping in its construction and functioning.
Genomic public databases are used for finding the nucleotide sequences of rRNAs and mRNA of r-proteins and statistical calculations are performed on the occurrence in these genes of some pentamers belonging to the RNA proposed as optimal ribosome ancestor.
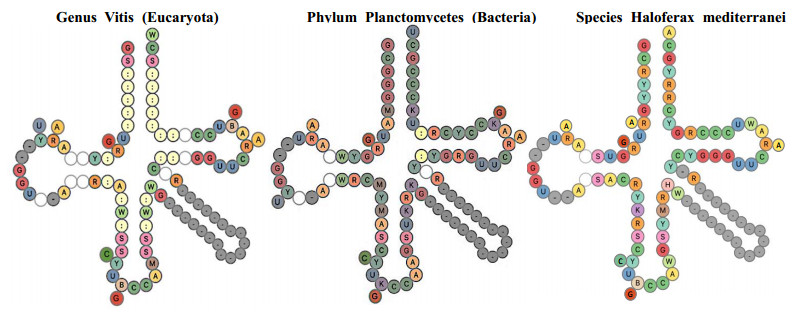
After having exhibited a possible solution to the problem of an RNA capable of catalyzing peptide genesis, traces of this RNA are found in many rRNAs and mRNA of r-proteins, as well as in factors contributing to the construction of the current ribosome.
The existence of an optimal primordial RNA whose function is to facilitate the creation of peptide bonds between amino acids may have contributed to accelerate the emergence of the first vital processes. Its traces should be found in many living species inside structures structurally and functionally close to the ribosome, which is already the case in the species studied in this article.
Citation: Jacques Demongeot, Jules Waku, Olivier Cohen. Combinatorial and frequency properties of the ribosome ancestors[J]. Mathematical Biosciences and Engineering, 2024, 21(1): 884-902. doi: 10.3934/mbe.2024037
The current ribosome has evolved from the primitive stages of life on Earth. Its function is to build proteins and on the basis of this role, we are looking for a universal common ancestor to the ribosome which could: i) present optimal combinatorial properties, and ii) have left vestiges in the current molecules composing the ribosome (rRNA or r-proteins) or helping in its construction and functioning.
Genomic public databases are used for finding the nucleotide sequences of rRNAs and mRNA of r-proteins and statistical calculations are performed on the occurrence in these genes of some pentamers belonging to the RNA proposed as optimal ribosome ancestor.
After having exhibited a possible solution to the problem of an RNA capable of catalyzing peptide genesis, traces of this RNA are found in many rRNAs and mRNA of r-proteins, as well as in factors contributing to the construction of the current ribosome.
The existence of an optimal primordial RNA whose function is to facilitate the creation of peptide bonds between amino acids may have contributed to accelerate the emergence of the first vital processes. Its traces should be found in many living species inside structures structurally and functionally close to the ribosome, which is already the case in the species studied in this article.

| [1] | B. C. Alberts, The function of the hereditary materials: Biological catalyses reflect the cell's evolutionary history, Amer. Zool., 26 (1986), 781–796. |
| [2] |
P. G. Higgs, N. Lehman, The RNA world: Molecular cooperation at the origins of life, Nat. Rev. Genet., 16 (2015), 7–17. https://doi.org/10.1038/nrg3841 doi: 10.1038/nrg3841

|
| [3] | J. Demongeot, Sur la possibilité de considérer le code génétique comme un code à enchaînement, Revue de Biomaths, 62 (1978), 61–66. |
| [4] | J. Demongeot, J. Besson, Code génétique et codes à enchaînement, C. R. Acad. Sc. Série III, 296 (1983), 807–810. |
| [5] |
J. Demongeot, A. Moreira, A circular RNA at the origin of life, J. Theor. Biol., 249 (2007), 314–324. https://doi.org/10.1016/j.jtbi.2007.07.010 doi: 10.1016/j.jtbi.2007.07.010
|
| [6] | J. Demongeot, V. Norris, Emergence of a "Cyclosome" in a primitive network capable of building "infinite" proteins, Life, 9 (2019), 51. https://doi.org/10.3390/life9020051 |
| [7] |
J. Demongeot, H. Seligmann, Evolution of tRNA sub-element accretion from small and large ribosomal RNAs, Biosystems, 193 (2022), 104796. https://doi.org/10.1016/j.biosystems.2022.104796 doi: 10.1016/j.biosystems.2022.104796
|
| [8] |
J. Demongeot, M. Thellier, Primitive oligomeric RNAs at the origins of life on Earth, Int. J. Molecular Sci., 24 (2023), 2274. https://doi.org/10.3390/ijms24032274 doi: 10.3390/ijms24032274
|
| [9] | GtRNAdb. Available from: http://lowelab.ucsc.edu/GtRNAdb/ |
| [10] | tRNA. Available from: http://trna.bioinf.uni-leipzig.de/DataOutput/Result |
| [11] | trNAviz. Available from: http://trna.ucsc.edu/tRNAviz/summary/. |
| [12] | Genscript. Available from: https://www.genscript.com/tools/codon-frequency-table/ |
| [13] | Kinefold. Available from: http://kinefold.curie.fr/cgi-bin/neorequest.pl?batch = 0 & sim = 2 & base = AL-73086 |
| [14] | Vectorbuilder. Available from: https://en.vectorbuilder.com/tool/dna-secondary-structure/ |
| [15] | NCBI. Available from: https://www.ncbi.nlm.nih.gov/nucleotide?cmd = search |
| [16] |
M. Edous, O. Eidous, A simple approximation for normal distribution function, Math. Statist., 6 (2018), 47–49. https://doi.org/10.13189/ms.2018.060401 doi: 10.13189/ms.2018.060401
|
| [17] |
A. Harish, G. Caetano-Anollés, Ribosomal history reveals origins of modern protein synthesis, PLoS One, 7 (2012), e32776. https://doi.org/10.1371/journal.pone doi: 10.1371/journal.pone
|
| [18] | Socscistatistics. Available from: http://www.socscistatistics.com/tests/studentttest/default2.aspx. |
| [19] |
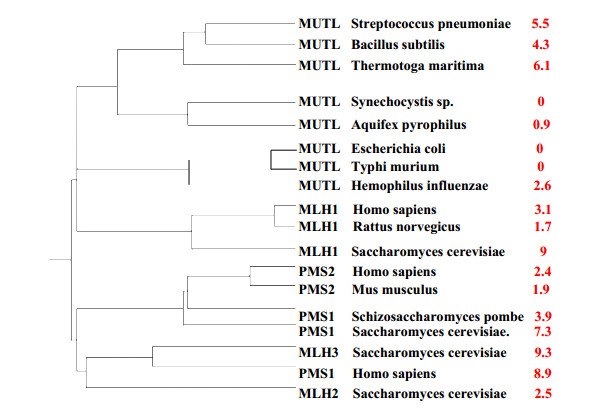
H. Flores-Rozas, R. D. Kolodner, The Saccharomyces cerevisiae MLH3 gene functions in MSH3-dependent suppression of frameshift mutations, Proc. Natl. Acad. Sci USA, 95 (1998), 12404–12409. https://doi.org/10.1073/pnas.95.21.12404 doi: 10.1073/pnas.95.21.12404
|
| [20] |
S. Yangngam, J. Prasopsiri, P. Hatthakarnkul, S. Thongchot, P. Thuwajit, P. Yenchitsomanus, et al., Cellular localization of nucleolin determines the prognosis in cancers: a meta-analysis, J. Mol. Med., 100 (2022), 1145–1157. https://doi.org/10.1007/s00109-022-02228-w doi: 10.1007/s00109-022-02228-w
|
| [21] |
V. Firlej, P. Soyeux, M. Nourieh, E. Huet, F. Semprez, E. Huet, et al., Overexpression of nucleolin and associated genes in prostate cancer, Int. J. Molecular Sci., 23 (2022), 4491. https://doi.org/10.3390/ijms23094491 doi: 10.3390/ijms23094491
|
| [22] |
S. Melnikov, H. S. Kwok, K. Manakongtreecheep, A. van den Elzen, C. C. Thoreen, D. Söll, Archaeal ribosomal proteins possess nuclear localization signal-type motifs: Implications for the origin of the cell nucleus, Mol. Biol. Evol., 37 (2020), 124–133. https://doi.org/10.1093/molbev/msz207 doi: 10.1093/molbev/msz207
|
| [23] |
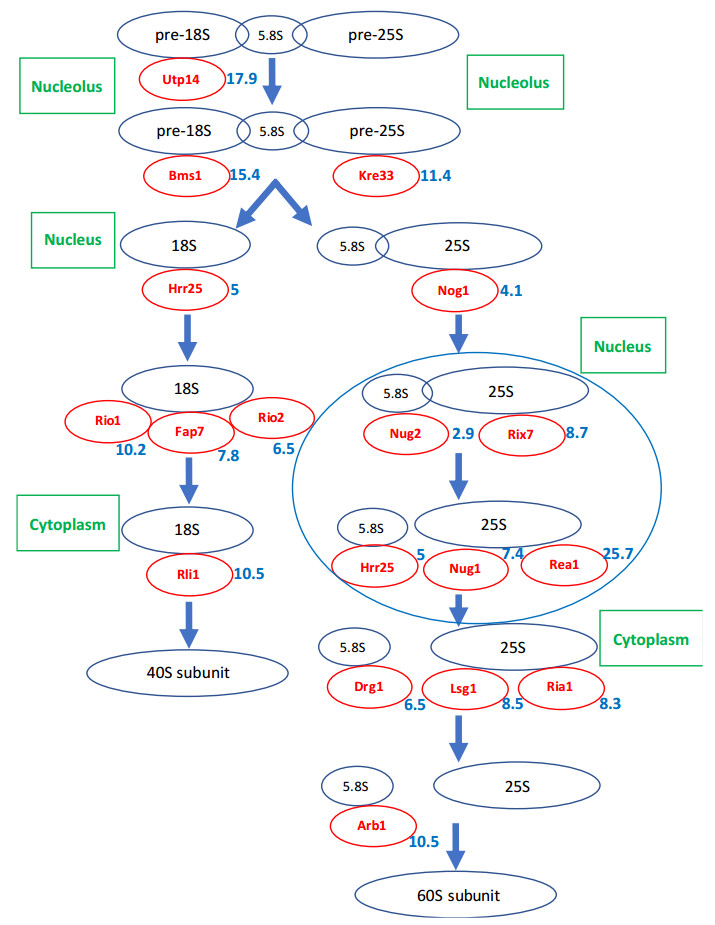
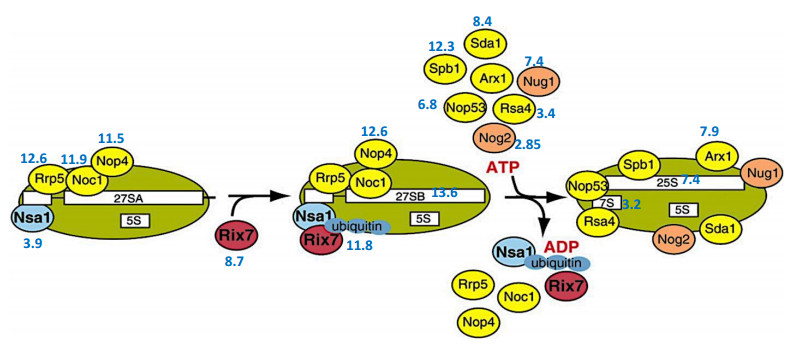
B. S. Strunk, K. Karbstein, Powering through ribosome assembly, RNA, 15 (2009), 2083–2104. https://doi.org/10.1261/rna.1792109 doi: 10.1261/rna.1792109
|
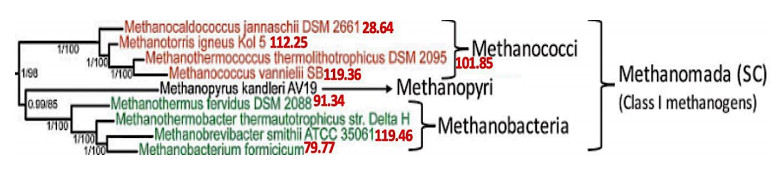
| [24] | P. Adam, G. Borrel, C. Brochier-Armanet, S. Gribaldo, The growing tree of Archaea: New perspectives on their diversity, evolution and ecology, ISME J., 11 (2017), 2407–2425. https://doi.org/10.1038/ismej.2017.122 |
| [25] | G. Wich, L. Sibold, A. Böck, Divergent Evolution of 5S rRNA Genes in Methanococcus, Z. Naturforsch., 42 (1987), 373–380. |
| [26] |
M. Roovers, L. Droogmans, H. Grosjean, Post-transcriptional modifications of conserved nucleotides in the T-Loop of tRNA: A tale of functional convergent evolution, Genes, 12 (2021), 140. https://doi.org/10.3390/genes12020140 doi: 10.3390/genes12020140
|
| [27] |
C. W. Chan, B. Chetnani, A. Mondragón, Structure and function of the T-loop structural motif in noncoding RNAs, RNA, 4 (2013), 507–522. https://doi.org/10.1002/wrna.1175 doi: 10.1002/wrna.1175
|
| [28] |
H. S. Bernhardt, W. P. Tate, Evidence from glycine transfer RNA of a frozen accident at the dawn of the genetic code, Biol. Direct, 3 (2008), 53. https://doi.org/10.1186/1745-6150-3-53 doi: 10.1186/1745-6150-3-53
|
| [29] |
J. T. Staley, G. Caetano-Anollés, Archaea-first and the co-evolutionary diversification of domains of life, Bioessays, 40 (2018), e1800036. https://doi.org/10.1002/bies.201800036 doi: 10.1002/bies.201800036
|
| [30] | J. T. Staley, Domain Cell Theory supports the independent evolution of the Eukarya, Bacteria and Archaea and the Nuclear Compartment Commonality hypothesis, Open Biol., 7 (2017), 170041. https://doi.org/10.1098/rsob.170041 |
| [31] |
G. Caetano-Anollés, A. Nasir, K. Zhou, D. Caetano-Anollés, J. E. Mittenthal, F. J. Sun, K. M. Kim, Archaea: The first domain of diversified life, Archaea, 2014 (2014), 590214. https://doi.org/10.1155/2014/590214 doi: 10.1155/2014/590214
|
| [32] |
K. Tamura, P. R. Schimmel, Peptide synthesis with a template-like RNA guide and aminoacyl phosphate adaptors. Proc. Natl. Acad. Sci. USA, 100 (2003), 8666–8669. https://doi.org/10.1073/pnas.1432909100 doi: 10.1073/pnas.1432909100
|
| [33] |
K. Tamura, P. R. Schimmel, Chiral-selective aminoacylation of an RNA minihelix: Mechanistic features and chiral suppression, Proc. Natl. Acad. Sci. USA, 103 (2006), 13750–13752. https://doi.org/10.1073/pnas.0606070103 doi: 10.1073/pnas.0606070103
|
| [34] |
L. Zhou, D. Ding, J.W. Szostak, The virtual circular genome model for primordial RNA replication, RNA, 27 (2021), 1–11. https://doi.org/10.1261/rna.077693.120 doi: 10.1261/rna.077693.120
|
| [35] |
K. Adamala, J. W. Szostak, Non-enzymatic template-directed RNA synthesis inside model protocells, Science, 342 (2013), 1098–1100. https://doi.org/10.1126/science.1241888 doi: 10.1126/science.1241888
|
| [36] | L. Demetrius, Directionality theory and the origin of life, arXiv, (2023), 2304.14873. https://doi.org/10.48550/arXiv.2304.14873 |
Figures(9) / Tables(9)

Jacques Demongeot, Jules Waku, Olivier Cohen. Combinatorial and frequency properties of the ribosome ancestors[J]. Mathematical Biosciences and Engineering, 2024, 21(1): 884-902. doi: 10.3934/mbe.2024037


 DownLoad: