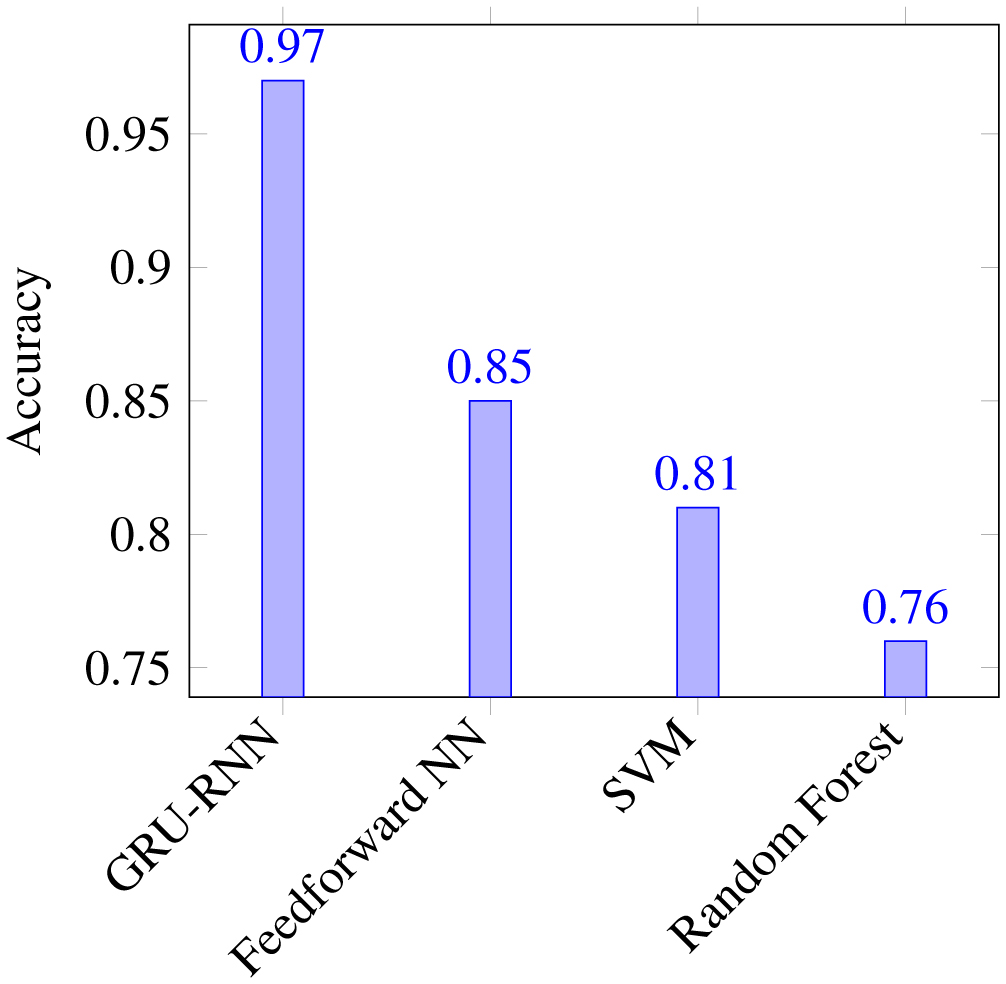
In this paper, we introduce a multi-modal sensor fusion system designed for biomedical engineering, specifically geared toward optimizing physical training by collecting detailed body movement data. This system employs inertial measurement units, flex sensors, electromyography sensors, and Microsoft's Kinect V2 to generate an in-depth analysis of an individual's physical performance. We incorporate a gated recurrent unit- recurrent neural network algorithm to achieve highly accurate body and hand motion estimation, thus surpassing the performance of traditional machine learning algorithms in terms of accuracy, precision, recall, and F1 score. The system's integration with the PICO 4 VR environment creates a rich, interactive experience for physical training. Unlike conventional motion capture systems, our sensor fusion system is not limited to a fixed workspace, allowing users to engage in exercise within a flexible, free-form environment.
Citation: Yi Deng, Zhiguo Wang, Xiaohui Li, Yu Lei, Owen Omalley. Advancing biomedical engineering through a multi-modal sensor fusion system for enhanced physical training[J]. AIMS Bioengineering, 2023, 10(4): 364-383. doi: 10.3934/bioeng.2023022
In this paper, we introduce a multi-modal sensor fusion system designed for biomedical engineering, specifically geared toward optimizing physical training by collecting detailed body movement data. This system employs inertial measurement units, flex sensors, electromyography sensors, and Microsoft's Kinect V2 to generate an in-depth analysis of an individual's physical performance. We incorporate a gated recurrent unit- recurrent neural network algorithm to achieve highly accurate body and hand motion estimation, thus surpassing the performance of traditional machine learning algorithms in terms of accuracy, precision, recall, and F1 score. The system's integration with the PICO 4 VR environment creates a rich, interactive experience for physical training. Unlike conventional motion capture systems, our sensor fusion system is not limited to a fixed workspace, allowing users to engage in exercise within a flexible, free-form environment.

| [1] |
Joubert C, Chainay H (2018) Aging brain: the effect of combined cognitive and physical training on cognition as compared to cognitive and physical training alone–a systematic review. Clin Interv Aging 13: 1267-1301. https://doi.org/10.2147/CIA.S165399 
|
| [2] |
Zouhal H, Ben Abderrahman A, Khodamoradi A, et al. (2020) Effects of physical training on anthropometrics, physical and physiological capacities in individuals with obesity: a systematic review. Obes Rev 21: e13039. https://doi.org/10.1111/obr.13039
|
| [3] |
Pedersen BK (2006) The anti-inflammatory effect of exercise: its role in diabetes and cardiovascular disease control. Essays Biochem 42: 105-117. https://doi.org/10.1042/bse0420105
|
| [4] | Gilani SRM, Feizabad AK (2019) The effects of aerobic exercise training on mental health and self-esteem of type 2 diabetes mellitus patients. Health Psychol Res 7: 6576. https://doi.org/10.4081/hpr.2019.6576 |
| [5] |
Shepherd HA, Evans T, Gupta S, et al. (2021) The impact of COVID-19 on high school student-athlete experiences with physical activity, mental health, and social connection. Int J Environ Res Public Health 18: 3515. https://doi.org/10.3390/ijerph18073515
|
| [6] |
Sjøgaard G, Christensen JR, Justesen JB, et al. (2016) Exercise is more than medicine: The working age population's well-being and productivity. J Sport Health Sci 5: 159-165. https://doi.org/10.1016/j.jshs.2016.04.004
|
| [7] |
McCrone K (2014) Sport and the physical emancipation of English women (RLE Sports Studies): 1870-1914. London: Routledge. https://doi.org/10.4324/9781315772844
|
| [8] |
Latey P (2001) The pilates method: history and philosophy. J Bodyw Mov Ther 5: 275-282. https://doi.org/10.1054/jbmt.2001.0237
|
| [9] |
Hauguel-Moreau M, Naudin C, N'Guyen L, et al. (2020) Smart bracelet to assess physical activity after cardiac surgery: a prospective study. PloS one 15: e0241368. https://doi.org/10.1371/journal.pone.0241368
|
| [10] |
Javaloyes A, Sarabia JM, Lamberts RP, et al. (2019) Training prescription guided by heart-rate variability in cycling. Int J Sports Physiol Perform 14: 23-32. https://doi.org/10.1123/ijspp.2018-0122
|
| [11] |
Shi Y, Li L, Yang J, et al. (2023) Center-based transfer feature learning with classifier adaptation for surface defect recognition. Mech Syst Signal Process 188: 110001. https://doi.org/10.1016/j.ymssp.2022.110001
|
| [12] |
Shi Y, Li H, Fu X, et al. (2023) Self-powered difunctional sensors based on sliding contact-electrification and tribovoltaic effects for pneumatic monitoring and controlling. Nano Energy 110: 108339. https://doi.org/10.1016/j.nanoen.2023.108339
|
| [13] |
Qi W, Aliverti A (2019) A multimodal wearable system for continuous and real-time breathing pattern monitoring during daily activity. IEEE J Biomed Health Inform 24: 2199-2207. https://doi.org/10.1109/JBHI.2019.2963048
|
| [14] | De Pasquale G, Mastrototaro L, Pia L, et al. (2018) Wearable system with embedded force sensors for neurologic rehabilitation trainings. 2018 Symposium on Design, Test, Integration & Packaging of MEMS and MOEMS (DTIP) : 1-4. https://doi.org/10.1109/DTIP.2018.8394187 |
| [15] |
Mendes AS, Silva LA, Blas HSS, et al. (2021) Physical movement helps learning: teaching using tracking objects with depth camera. Trends and Applications in Information Systems and Technologies: Volume 4 9 2021: 183-193. https://doi.org/10.1007/978-3-030-72654-6_18
|
| [16] | Egle F, Kluge F, Schoene D, et al. (2022) Development of an inertial sensor-based exergame for combined cognitive and physical training. 2022 IEEE-EMBS International Conference on Wearable and Implantable Body Sensor Networks (BSN) 2022: 1-4. https://doi.org/10.1109/BSN56160.2022.9928474 |
| [17] |
Batalik L, Dosbaba F, Hartman M, et al. (2020) Benefits and effectiveness of using a wrist heart rate monitor as a telerehabilitation device in cardiac patients: a randomized controlled trial. Medicine 99: e19556. https://doi.org/10.1097/MD.0000000000019556
|
| [18] |
Bo H, Sun Z (2023) Construction of heart rate monitoring platform for college physical training based on wireless network. Wireless Netw 29: 3005-3016. https://doi.org/10.1007/s11276-022-03226-z
|
| [19] |
Su H, Qi W, Schmirander Y, et al. (2022) A human activity-aware shared control solution for medical human–robot interaction. Assem Autom 42: 388-394. https://doi.org/10.1108/aa-12-2021-0174
|
| [20] |
Qi W, Ovur SE, Li Z, et al. (2021) Multi-sensor guided hand gesture recognition for a teleoperated robot using a recurrent neural network. IEEE Robot Autom Lett 6: 6039-6045. https://doi.org/10.1109/LRA.2021.3089999
|
| [21] | Patel AN, Jung TP, Sejnowski TJ (2018) A wearable multi-modal bio-sensing system towards real-world applications. IEEE Trans Biomed Eng 66: 1137-1147. https://doi.org/10.1109/TBME.2018.2868759 |
| [22] |
Weiner P, Neef C, Shibata Y, et al. (2019) An embedded, multi-modal sensor system for scalable robotic and prosthetic hand fingers. Sensors 20: 101. https://doi.org/10.3390/s20010101
|
| [23] |
Marco VR, Kalkkuhl J, Raisch J, et al. (2020) Multi-modal sensor fusion for highly accurate vehicle motion state estimation. Control Eng Pract 100: 104409. https://doi.org/10.1016/j.conengprac.2020.104409
|
| [24] |
Ma R, Hu F (2016) An intelligent thermal sensing system for automatic, quantitative assessment of motion training in lower-limb rehabilitation. IEEE Trans Syst Man Cybern Syst 48: 661-669. https://doi.org/10.1109/TSMC.2016.2636660
|
| [25] |
Torreño N, Munguía-Izquierdo D, Coutts A, et al. (2016) Relationship between external and internal loads of professional soccer players during full matches in official games using global positioning systems and heart-rate technology. Int J Sports Physiol Perform 11: 940-946. https://doi.org/10.1123/ijspp.2015-0252
|
| [26] | Nur L, Suherman A, Subarjah H (2019) The use of global positioning system (GPS) polars to determine motion intensity. J Eng Sci Technol 14: 2132-2139. https://doi.org/10.1123/ijspp.2015-0252 |
| [27] | Drobnjakovic F, Douangpaseuth JB, Gadea C, et al. (2018) Fusing data from inertial measurement units and a 3D camera for body tracking. 2018 IEEE International Instrumentation and Measurement Technology Conference (I2MTC) 2018: 1-6. https://doi.org/10.1109/I2MTC.2018.8409754 |
| [28] |
Zhang X, Elnady AM, Randhawa BK, et al. (2018) Combining mental training and physical training with goal-oriented protocols in stroke rehabilitation: a feasibility case study. Front Hum Neurosci 12: 125. https://doi.org/10.3389/fnhum.2018.00125
|
| [29] |
Ryselis K, Petkus T, Blažauskas T, et al. (2020) Multiple Kinect based system to monitor and analyze key performance indicators of physical training. Hum-Centric Comput Inf Sci 10: 1-22. https://doi.org/10.1186/s13673-020-00256-4
|
| [30] |
Su H, Qi W, Hu Y, et al. (2020) An incremental learning framework for human-like redundancy optimization of anthropomorphic manipulators. IEEE Trans Ind Inform 18: 1864-1872. https://doi.org/10.1109/TII.2020.3036693
|
| [31] |
Qi W, Su H (2022) A cybertwin based multimodal network for ecg patterns monitoring using deep learning. IEEE Trans Ind Inform 18: 6663-6670. https://doi.org/10.1109/TII.2022.3159583
|
| [32] |
Yuan L, Andrews J, Mu H, et al. (2022) Interpretable passive multi-modal sensor fusion for human identification and activity recognition. Sensors 22: 5787. https://doi.org/10.3390/s22155787
|
| [33] | Oskiper T, Chiu HP, Zhu Z, et al. (2010) Multi-modal sensor fusion algorithm for ubiquitous infrastructure-free localization in vision-impaired environments. 2010 IEEE/RSJ International Conference on Intelligent Robots and Systems 2010: 1513-1519. https://doi.org/10.1109/IROS.2010.5649562 |
| [34] | Calvo AF, Holguin GA, Medeiros H (2018) Human activity recognition using multi-modal data fusion. Progress in Pattern Recognition, Image Analysis, Computer Vision, and Applications: 23rd Iberoamerican Congress, CIARP 2018 : 946-953. https://doi.org/10.1007/978-3-030-13469-3_109 |
| [35] |
Tian C, Xu Z, Wang L (2023) Arc fault detection using artificial intelligence: challenges and benefits. Math Biosci Eng 20: 12404-12432. https://doi.org/10.3934/mbe.2023552
|
| [36] |
Lei Y, Su Z, He X, et al. (2023) Immersive virtual reality application for intelligent manufacturing: Applications and art design. Math Biosci Eng 20: 4353-4387. https://doi.org/10.3934/mbe.2023202
|
| [37] |
Qi W, Fan H, Karimi HR, et al. (2023) An adaptive reinforcement learning-based multimodal data fusion framework for human–robot confrontation gaming. Neural Netw 164: 489-496. https://doi.org/10.1016/j.neunet.2023.04.043
|
| [38] |
Xu L, Zhang JQ, Yan Y (2004) A wavelet-based multisensor data fusion algorithm. IEEE Trans Instrum Meas 53: 1539-1545. https://doi.org/10.1109/TIM.2004.834066
|
| [39] |
Wang H, Song L, Liu J, et al. (2021) An efficient intelligent data fusion algorithm for wireless sensor network. Procedia Comput Sci 183: 418-424. https://doi.org/10.1016/j.procs.2021.02.079
|
| [40] |
Zhao J, Lv Y (2023) Output-feedback robust tracking control of uncertain systems via adaptive learning. Int J Control Autom Syst 21: 1108-1118. https://doi.org/10.1007/s12555-021-0882-6
|
| [41] |
Liu Z, Yang D, Wang Y, et al. (2023) EGNN: Graph structure learning based on evolutionary computation helps more in graph neural networks. Appl Soft Comput 135: 110040. https://doi.org/10.1016/j.asoc.2023.110040
|
| [42] |
Wang Y, Liu Z, Xu J, et al. (2022) Heterogeneous network representation learning approach for ethereum identity identification. IEEE Trans Comput Soc Syst 10: 890-899. https://doi.org/10.1109/TCSS.2022.3164719
|
| [43] |
Lei Y, Su Z, Cheng C (2023) Virtual reality in human-robot interaction: Challenges and benefits. ERA 31: 2374-2408. https://doi.org/10.3934/era.2023121
|
Figures(5) / Tables(3)

Yi Deng, Zhiguo Wang, Xiaohui Li, Yu Lei, Owen Omalley. Advancing biomedical engineering through a multi-modal sensor fusion system for enhanced physical training[J]. AIMS Bioengineering, 2023, 10(4): 364-383. doi: 10.3934/bioeng.2023022


 DownLoad: