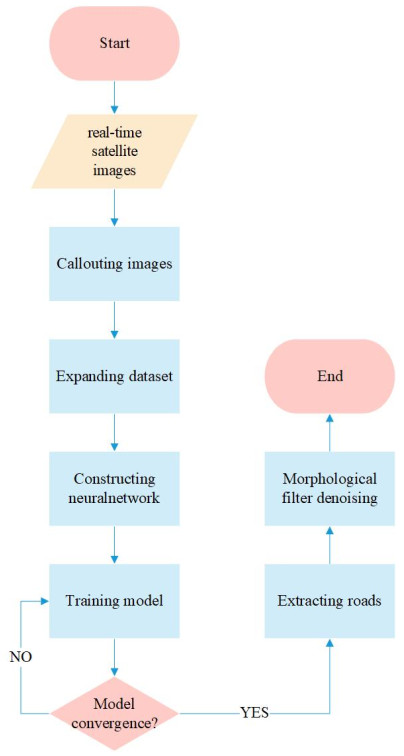
The road network system is the core foundation of a city. Extracting road information from remote sensing images has become an important research direction in the current traffic information industry. The efficient residual factorized convolutional neural network (ERFNet) is a residual convolutional neural network with good application value in the field of biological information, but it has a weak effect on urban road network extraction. To solve this problem, we developed a road network extraction method for remote sensing images by using an improved ERFNet network. First, the design of the network structure is based on an ERFNet; we added the DoubleConv module and increased the number of dilated convolution operations to build the road network extraction model. Second, in the training process, the strategy of dynamically setting the learning rate is adopted and combined with batch normalization and dropout methods to avoid overfitting and enhance the generalization ability of the model. Finally, the morphological filtering method is used to eliminate the image noise, and the ultimate extraction result of the road network is obtained. The experimental results show that the method proposed in this paper has an average F1 score of 93.37% for five test images, which is superior to the ERFNet (91.31%) and U-net (87.34%). The average value of IoU is 77.35%, which is also better than ERFNet (71.08%) and U-net (65.64%).
Citation: Weichi Liu, Gaifang Dong, Mingxin Zou. Satellite road extraction method based on RFDNet neural network[J]. Electronic Research Archive, 2023, 31(8): 4362-4377. doi: 10.3934/era.2023223
The road network system is the core foundation of a city. Extracting road information from remote sensing images has become an important research direction in the current traffic information industry. The efficient residual factorized convolutional neural network (ERFNet) is a residual convolutional neural network with good application value in the field of biological information, but it has a weak effect on urban road network extraction. To solve this problem, we developed a road network extraction method for remote sensing images by using an improved ERFNet network. First, the design of the network structure is based on an ERFNet; we added the DoubleConv module and increased the number of dilated convolution operations to build the road network extraction model. Second, in the training process, the strategy of dynamically setting the learning rate is adopted and combined with batch normalization and dropout methods to avoid overfitting and enhance the generalization ability of the model. Finally, the morphological filtering method is used to eliminate the image noise, and the ultimate extraction result of the road network is obtained. The experimental results show that the method proposed in this paper has an average F1 score of 93.37% for five test images, which is superior to the ERFNet (91.31%) and U-net (87.34%). The average value of IoU is 77.35%, which is also better than ERFNet (71.08%) and U-net (65.64%).

| [1] |
F. Yi, R. Te, Y. Zhao, G. Xu, EUNetMTL: multitask joint learning for road extraction from high-resolution remote sensing images, Remote Sens. Lett., 13 (2022), 258–268. https://doi.org/10.1080/2150704x.2021.2019344 doi: 10.1080/2150704X.2021.2019344

|
| [2] |
Y. Li, H. Liang, G. Sun, Z. Yuan, Y. Zhang, H. Zhang, A land cover background-adaptive framework for large-scale road extraction, Remote Sens., 14 (2022), 5114–5127. https://doi.org/10.3390/rs14205114 doi: 10.3390/rs14205114
|
| [3] |
T. K. Behera, P. K. Sa, M. Nappi, S. Bakshi, Satellite IoT based road extraction from VHR images through superpixel-CNN architecture, Big Data Res., 30 (2022), 100334–100346. https://doi.org/10.1016/j.bdr.2022.100334 doi: 10.1016/j.bdr.2022.100334
|
| [4] |
D. Chang, Q. Wang, J. Yang, W. Xu, Research on road extraction method based on sustainable development goals satellite-1 nighttime light data, Remote Sens., 14 (2022), 6015–6024. https://doi.org/10.3390/rs14236015 doi: 10.3390/rs14236015
|
| [5] |
T. Alshaikhli, W. Liu, Y. Maruyama, Automated method of road extraction from aerial images using a deep convolutional neural network, Appl. Sci. 9 (2019), 4825–4840. https://doi.org/10.3390/app9224825 doi: 10.3390/app9224825
|
| [6] |
X. Chen, Q. Sun, W. Guo, C. Qiu, A. Yu, GA-Net: A geometry prior assisted neural network for road extraction, Int. J. Appl. Earth Obs. Geoinf., 114 (2022), 103004–103015. https://doi.org/10.1016/j.jag.2022.103004 doi: 10.1016/j.jag.2022.103004
|
| [7] |
J. Dai, T. Zhu, Y. Wang, R. Ma, X. Fang, Road extraction from high-resolution satellite images based on multiple descriptors, IEEE J. Sel. Top. Appl. Earth Obs. Remote Sens., 13 (2020), 227–240. https://doi.org/10.1109/jstars.2019.2955277 doi: 10.1109/JSTARS.2019.2955277
|
| [8] |
H. Wang, F. Yu, J. Xie, H. Wang, H. Zheng, Road extraction based on improved Deeplabv3 plus in remote sensing image, ISPRS Int. Arch. Photogramm. Remote Sens. Spatial Inf. Sci., 48 (2022), 67–72. https://doi.org/10.5194/isprs-archives-XLVIII-3-W2-2022-67-2022 doi: 10.5194/isprs-archives-XLVIII-3-W2-2022-67-2022
|
| [9] |
Z. Zhang, X. Sun, Y. Liu, GMR-Net: Road-extraction network based on fusion of local and global information, Remote Sens. 14 (2022), 5476–5494. https://doi.org/10.3390/rs14215476 doi: 10.3390/rs14215476
|
| [10] |
H. Tan, H. Xu, J. Dai, BSIRNet: A road extraction network with bidirectional spatial information reasoning, J. Sens. 2022 (2022), 1–11. https://doi.org/10.1155/2022/6391238 doi: 10.1155/2022/6391238
|
| [11] |
H. Huan, Y. Sheng, Y. Zhang, Y. Liu, Strip attention networks for road extraction, Remote Sens. 14 (2022), 4516–4533. https://doi.org/10.3390/rs14184516 doi: 10.3390/rs14184516
|
| [12] |
F.Sultonov, J. H. Park, S. Yun, D. W. Lim, J. M. Kang, Mixer U-Net: An improved automatic road extraction from UAV imagery, Appl. Sci., 12 (2022), 1953–1968. https://doi.org/10.3390/app12041953 doi: 10.3390/app12041953
|
| [13] |
G. Yuan, J. Li, X. Liu, Z. Yang, Weakly supervised road network extraction for remote sensing image based scribble annotation and adversarial learning, J. King Saud Univ. Comput. Inf. Sci., 34 (2022), 7184–7199. https://doi.org/10.1016/j.jksuci.2022.05.020 doi: 10.1016/j.jksuci.2022.05.020
|
| [14] |
H. Chen, S. Peng, C. Du, J. Li, S. Wu, SW-GAN: Road extraction from remote sensing imagery using semi-weakly supervised adversarial learning, Remote Sens., 14 (2022), 4145–4160. https://doi.org/10.3390/rs14174145 doi: 10.3390/rs14174145
|
| [15] |
K. Geng, X. Sun, Z. Yan, W. Diao, X. Gao, Topological space knowledge distillation for compact road extraction in optical remote sensing images, Remote Sens., 12 (2020), 3175–3195. https://doi.org/10.3390/rs12193175 doi: 10.3390/rs12193175
|
| [16] |
Y. Li, L. Xiang, C. Zhang, F. Jiao, C. Wu, A guided deep learning approach for joint road extraction and intersection detection from RS images and taxi trajectories, IEEE J. Sel. Top. Appl. Earth Obs. Remote Sens., 14 (2021), 8008–8018. https://doi.org/10.1109/jstars.2021.3102320 doi: 10.1109/JSTARS.2021.3102320
|
| [17] |
P. Li, Y. Li, J. Feng, Z. Ma, X. Li, Automatic detection and recognition of road intersections for road extraction from imagery, Int. Arch. Photogramm. Remote Sens. Spatial Inf. Sci., 43 (2020), 113–117. https://doi.org/10.5194/isprs-archives-XLIII-B3-2020-113-2020 doi: 10.5194/isprs-archives-XLIII-B3-2020-113-2020
|
| [18] |
E. Romera, J. M. Álvarez, L. M. Bergasa, R. Arroyo, ERFNet: Efficient residual factorized convnet for real-time semantic segmentation, IEEE Trans. Intell. Transp. Syst., 19 (2017), 263–272. https://doi.org/10.1109/tits.2017.2750080 doi: 10.1109/tits.2017.2750080
|
| [19] |
C. I. Cira, M. Kada, M. Á. Manso-Callejo, R. Alcarria, B. Bordel Sanchez, Improving road surface area extraction via semantic segmentation with conditional generative learning for deep inpainting operations, ISPRS Int. J. Geo-Inf., 11 (2022), 43–61. https://doi.org/10.3390/ijgi11010043 doi: 10.3390/ijgi11010043
|
| [20] |
T. Duan, Y. Liu, J. Li, Z. Lian, Q. Li, DuFNet: Dual flow network of real-time semantic segmentation for unmanned driving application of internet of things, Comp. Model. Eng. Sci., 136 (2023), 223–239. https://doi.org/10.32604/cmes.2023.024742 doi: 10.32604/cmes.2023.024742
|
| [21] |
C. Sun, H. Zhao, L. Mu, F. Xu, L. Lu, Image semantic segmentation for autonomous driving based on improved U-Net. Comp. Model. Eng. Sci., 136 (2023), 787–801. https://doi.org/10.32604/cmes.2023.025119 doi: 10.32604/cmes.2023.025119
|
| [22] |
R. Xu, Y. Zeng, A method for road extraction from high-resolution remote sensing images based on multi-kernel learning, Information, 10 (2019), 385–398. https://doi.org/10.3390/info10120385 doi: 10.3390/info10120385
|
| [23] |
J. Zhang, Y. Li, Y. Si, B. Peng, F. Xiao, S. Luo, et al., A low-grade road extraction method using SDG-DenseNet based on the fusion of optical and SAR images at decision level, Remote Sens., 14 (2022), 2870–2894. https://doi.org/10.3390/rs14122870 doi: 10.3390/rs14122870
|
| [24] |
K. Zhou, Y. Xie, Z. Gao, F. Miao, L. Zhang, FuNet: A novel road extraction network with fusion of location data and remote sensing imagery, ISPRS Int. J. Geo-Inf., 10 (2021), 39–57. https://doi.org/10.3390/ijgi10010039 doi: 10.3390/ijgi10010039
|
| [25] |
G. P. Cardim, E. A. D. Silva, M. A. Dias, I. Bravo, A. Gardel, Statistical evaluation and analysis of road extraction methodologies using a unique dataset from remote sensing, Remote Sens., 10 (2018), 620–636. https://doi.org/10.3390/rs10040620 doi: 10.3390/rs10040620
|


Figures(7) / Tables(4)
Weichi Liu, Gaifang Dong, Mingxin Zou. Satellite road extraction method based on RFDNet neural network[J]. Electronic Research Archive, 2023, 31(8): 4362-4377. doi: 10.3934/era.2023223


 DownLoad: