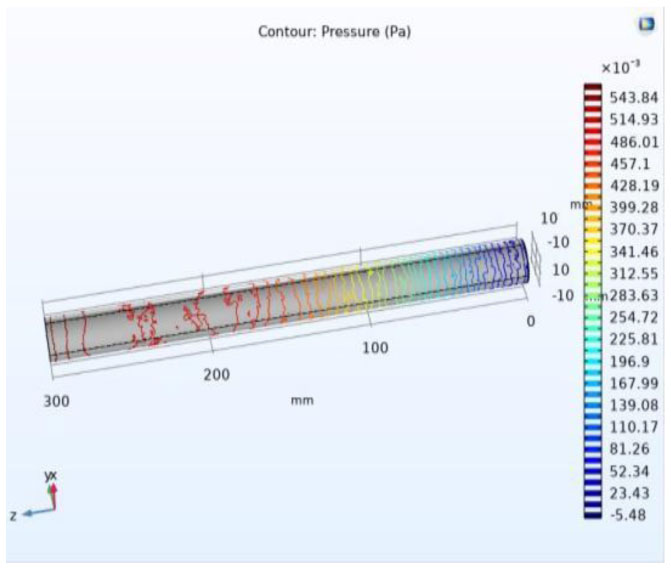
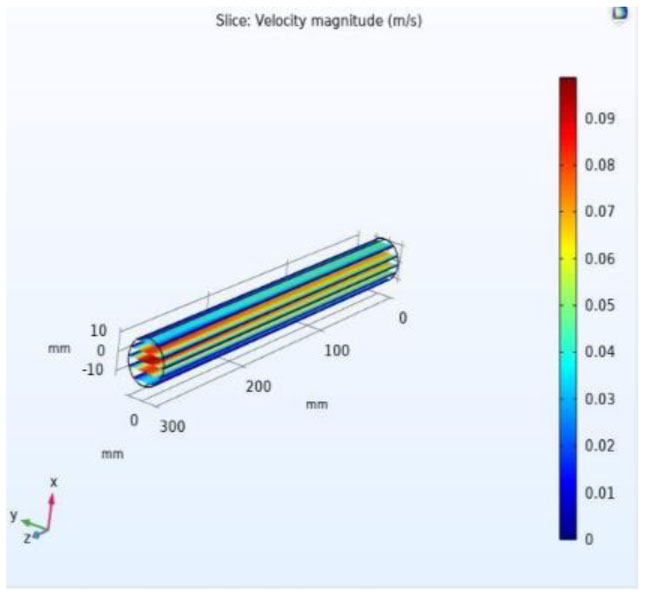
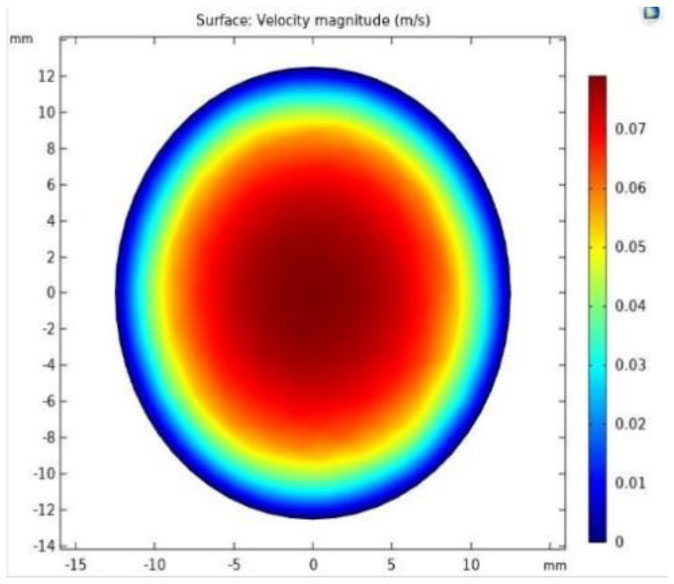
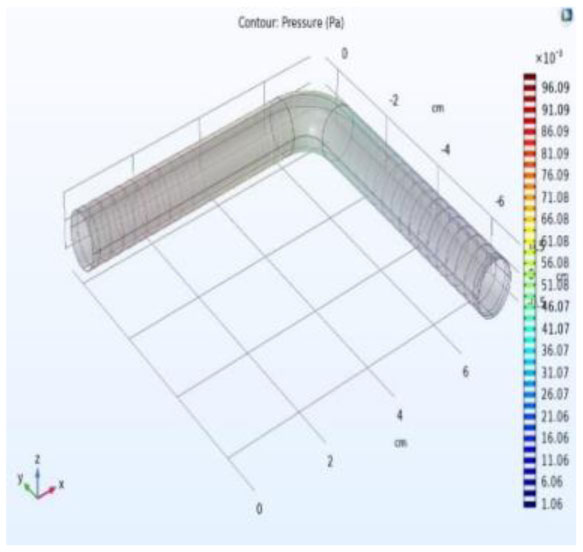
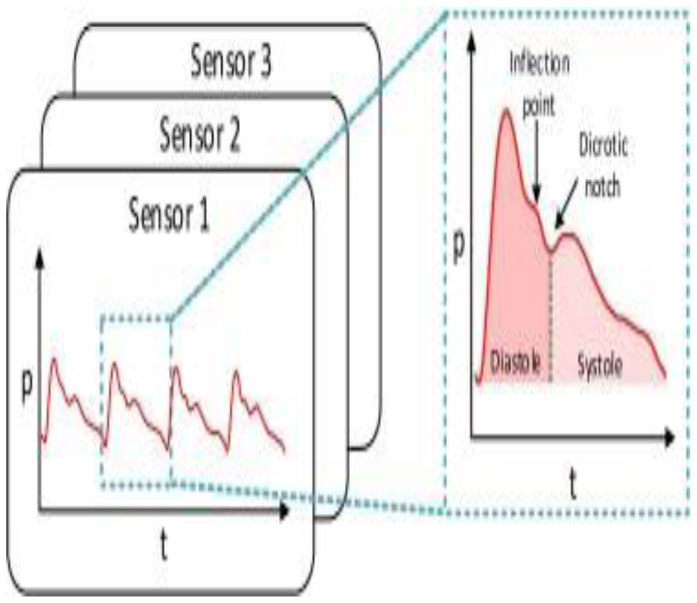
The primary objective of the research article is to describe the functionality of wrist watch which acts as a digital stethoscope to measure health constraints such as heart pulse through blood pressure. The second objective is the detection of blockages of an artery due to fatty, cholesterol-deposited, over a period when the blood is passing through due to stress and exercise, etc. Pressure and velocity are two inputs with their respective results of contrast and expansion of veins at the outputs. The major parameters in detecting the laminar flow are pressure and velocity. These parameters of a vein are analyzed by integrating valves in the vein. The movement of blood laminar flow in the vein is captured by a MEMS-based piezoelectric sensor by its functionality. The proposed design performance accuracy is estimated by modeling of vein's laminar flow when blood is circulating. The coagulation effect of the vein is used to measure heart stroke by placing MEMS along with the stent, as MEMS are tiny in size. The functionality of a digital Stethoscope works on the piezoelectric effect that generates an electrical signal when pressure is applied from the vein. The accuracy, functionality, and performance of the design can be analyzed by COMSOL multi-physics. Applications of MEMS include detection, prevention, and alert during the second heart stroke, and also used in the bionic eye and automotive electronics.
Citation: Vasudeva Reddy Tatiparthi, Madhava Rao, Santosh Kumar, Hindumathi. Detection and analysis of coagulation effect in vein using MEMS laminar flow for the early heart stroke diagnosis[J]. AIMS Bioengineering, 2023, 10(1): 1-12. doi: 10.3934/bioeng.2023001
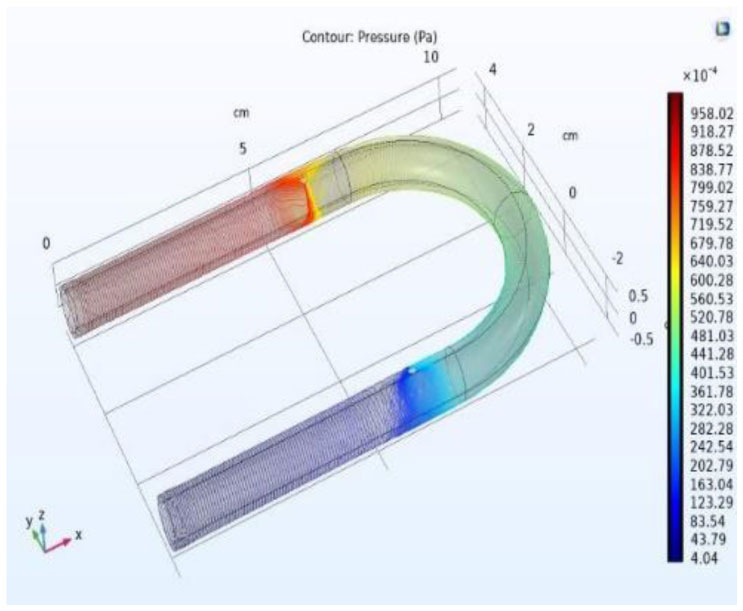
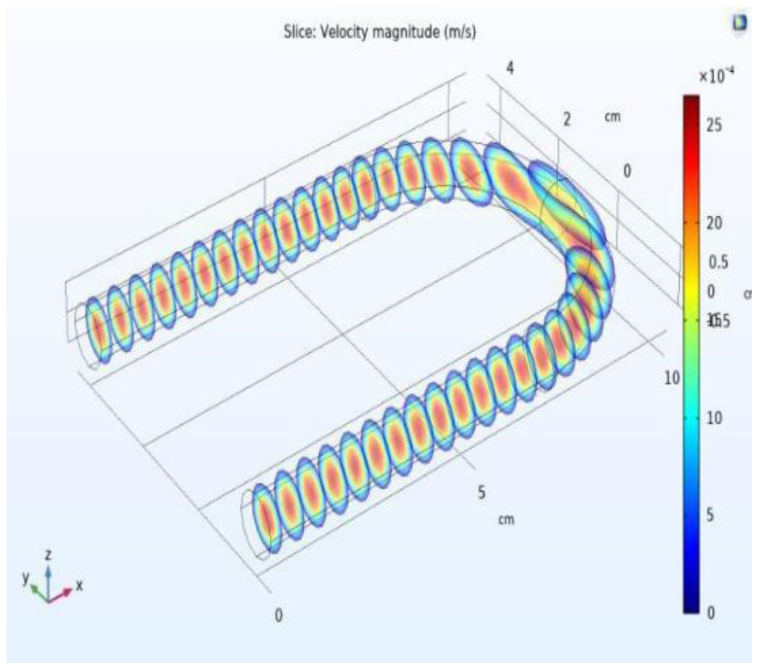
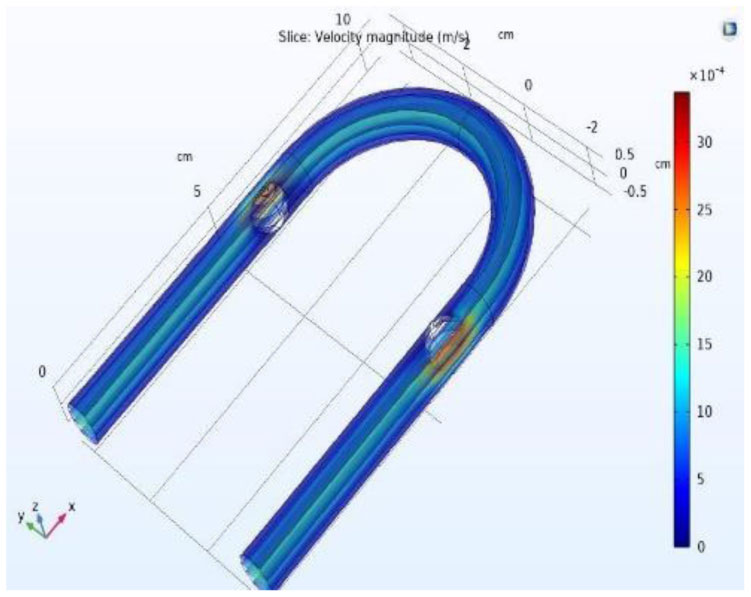
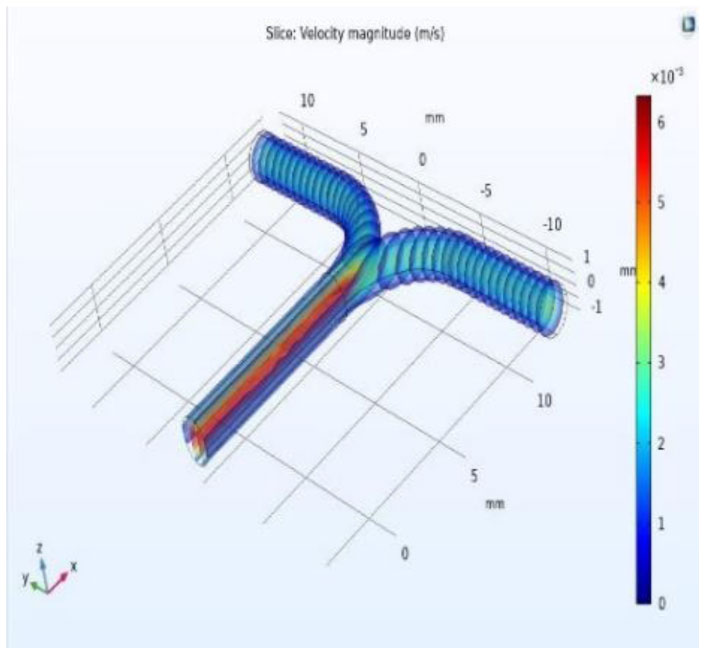
The primary objective of the research article is to describe the functionality of wrist watch which acts as a digital stethoscope to measure health constraints such as heart pulse through blood pressure. The second objective is the detection of blockages of an artery due to fatty, cholesterol-deposited, over a period when the blood is passing through due to stress and exercise, etc. Pressure and velocity are two inputs with their respective results of contrast and expansion of veins at the outputs. The major parameters in detecting the laminar flow are pressure and velocity. These parameters of a vein are analyzed by integrating valves in the vein. The movement of blood laminar flow in the vein is captured by a MEMS-based piezoelectric sensor by its functionality. The proposed design performance accuracy is estimated by modeling of vein's laminar flow when blood is circulating. The coagulation effect of the vein is used to measure heart stroke by placing MEMS along with the stent, as MEMS are tiny in size. The functionality of a digital Stethoscope works on the piezoelectric effect that generates an electrical signal when pressure is applied from the vein. The accuracy, functionality, and performance of the design can be analyzed by COMSOL multi-physics. Applications of MEMS include detection, prevention, and alert during the second heart stroke, and also used in the bionic eye and automotive electronics.

| [1] | Aswal N, Nawal M, Bundle M, et al. (2020) Pressure and velocity measurements in the pipeline for leak detection using COMSOL multiphysics. Int J Recent Technol Eng 9: 1812-1816. https://doi.org/10.35940/ijrte.A2727.059120 |
| [2] | Iersel MV (2019) Analysis of flow patterns and interface behavior in simulations of immiscible liquid-liquid two-phase-flow in microchannels using the conservative level set method [Master Thesis]. Netherlands: Delft University of Technology Faculty of Applied Science. |
| [3] | Nguyen H, Hoang T (2017) Numerical simulation of laminar flow through a pipe using COMSOL multiphysics. Int J Sci Eng Res 8: 290-295. |
| [4] | Zhuang S Modeling and simulation of control valves via COMSOL multiphysics (2017). Available from: https://cn.comsol.com/paper/download/437642/zhuang_paper.pdf |
| [5] |
Raza SS (2017) Analysis of a fully developed laminar flow b/w two parallel plates separated by a distance by using COMSOL multiphysics. J Fundam Appl Sci 9: 618. https://doi.org/10.4314/jfas.v9i1.36 
|
| [6] | Turgay MB (2017) Numerical simulation of fluid flow and heat transfer in a trapezoidal microchannel with COMSOL multiphysics. Int J Comput Method 73: 332-346. https://doi.org/10.1080/10407782.2017.1420302 |
| [7] | Reddy RS, Payal G, Karkulali P, et al. (2016) Pressure and flow variation in gas distribution pipeline for leak detection. Int Conf Ind Technol 2016: 679-683. https://doi.org/10.1109/ICIT.2016.7474831 |
| [8] | Kwon HJ (2013) Use of COMSOL simulation for undergraduate fluid dynamics course. Comput Educ J 23: 63-67. https://doi.org 10.18260/1-2-22167 |
| [9] | Velez C, Ariza LF, Osma JF, et al. (2010) Velocity and pressure analysis for microchannel networks. IEEE ANDESCON 2010: 1-5. https://doi.org 10.1109/ANDESCON.2010.5632209 |

Figures(20) / Tables(2)

Vasudeva Reddy Tatiparthi, Madhava Rao, Santosh Kumar, Hindumathi. Detection and analysis of coagulation effect in vein using MEMS laminar flow for the early heart stroke diagnosis[J]. AIMS Bioengineering, 2023, 10(1): 1-12. doi: 10.3934/bioeng.2023001


 DownLoad: