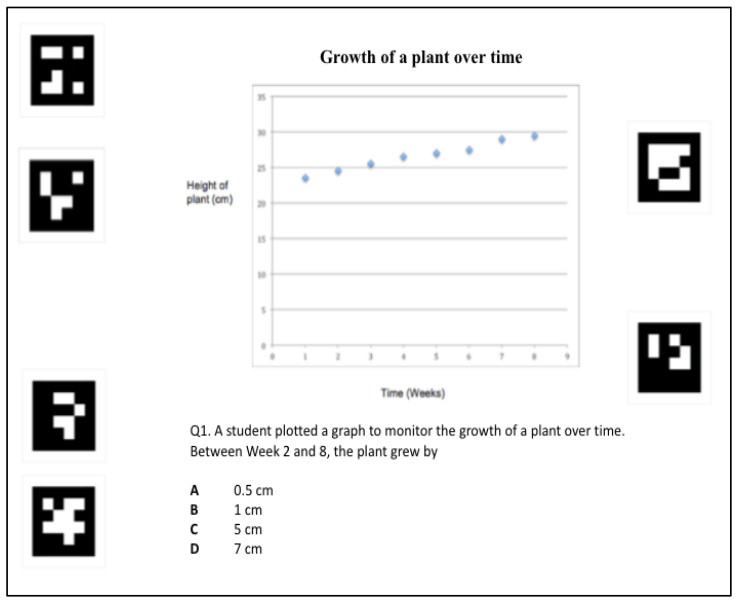
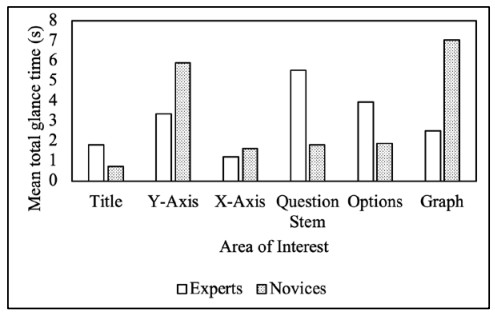
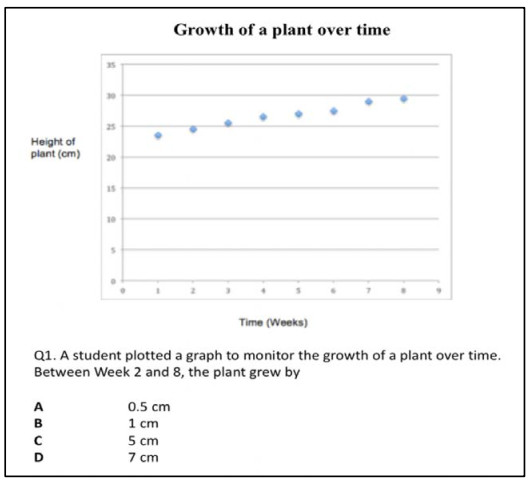
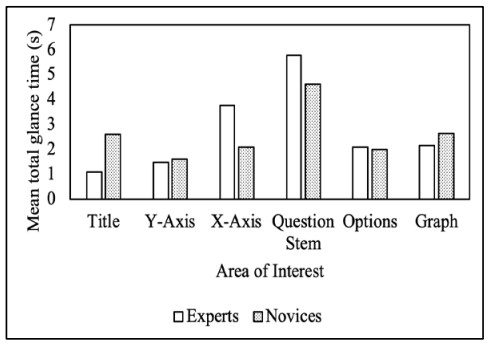
Graphs are highly prevalent as a form of quantitative data in various science, technology, engineering and mathematics fields. Thus, graphical literacy is especially important in understanding today's world and being scientifically literate. However, students often face difficulties in graph interpretation and differ substantially in their graphical literacy. While many teachers are aware of students' difficulties in answering graph items, there is limited knowledge about how students go about attempting graph items. In this exploratory study, we investigated the eye-gaze patterns of experts and novices in graph interpretation of five science inference-based multiple-choice items requiring no prior content knowledge to problem-solve. Experts refer to science university faculty members who are currently teaching science content courses to undergraduate students. Novices refer to university undergraduates majoring in one of the science subjects. Participants' eye-gaze movements were recorded using the Dikablis eye-tracker, and their eye-gaze patterns and total glance time (s) were subsequently analyzed using the software D-Lab 3.0. Experts focused more on the question stem, whereas novices focused more on the graph. Additionally, experts tend to focus on contextual and graph data features initially, before moving to cues such as options. Conversely, novices demonstrated more sporadic search patterns. The findings contribute to the literature that compares how experts and novices' problem-solve graph items that are inference-based. An interesting future study on the eye gaze patterns and accuracy of answers is suggested from a finding. This study also provides a set of heuristics to be adopted in the teaching and learning of graph interpretation. The findings of this study have implications for teachers in the way they scaffold students' approach to answering graphical items. Additionally, students can employ heuristics to answer graphical items more effectively.
Citation: Tang Wee Teo, Zi Qi Peh. An exploratory study on eye-gaze patterns of experts and novices of science inference graph items[J]. STEM Education, 2023, 3(3): 205-229. doi: 10.3934/steme.2023013
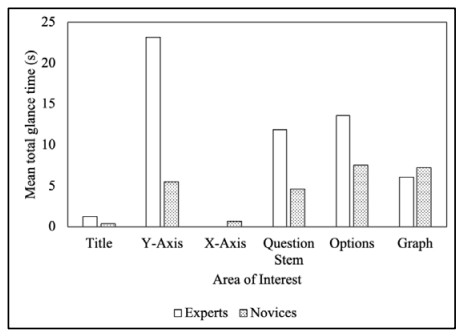
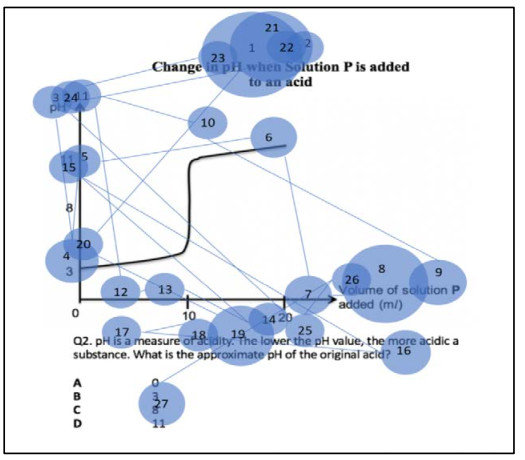
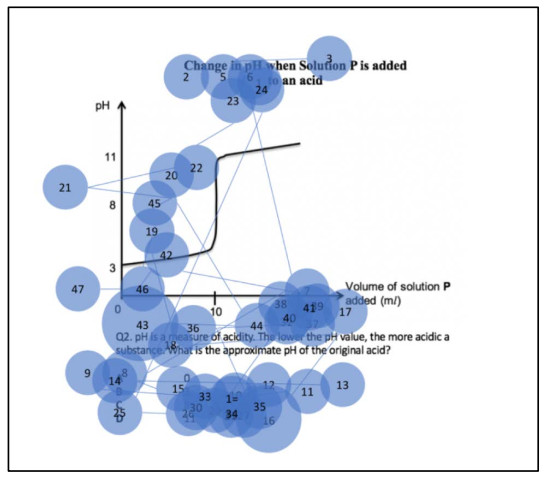
Graphs are highly prevalent as a form of quantitative data in various science, technology, engineering and mathematics fields. Thus, graphical literacy is especially important in understanding today's world and being scientifically literate. However, students often face difficulties in graph interpretation and differ substantially in their graphical literacy. While many teachers are aware of students' difficulties in answering graph items, there is limited knowledge about how students go about attempting graph items. In this exploratory study, we investigated the eye-gaze patterns of experts and novices in graph interpretation of five science inference-based multiple-choice items requiring no prior content knowledge to problem-solve. Experts refer to science university faculty members who are currently teaching science content courses to undergraduate students. Novices refer to university undergraduates majoring in one of the science subjects. Participants' eye-gaze movements were recorded using the Dikablis eye-tracker, and their eye-gaze patterns and total glance time (s) were subsequently analyzed using the software D-Lab 3.0. Experts focused more on the question stem, whereas novices focused more on the graph. Additionally, experts tend to focus on contextual and graph data features initially, before moving to cues such as options. Conversely, novices demonstrated more sporadic search patterns. The findings contribute to the literature that compares how experts and novices' problem-solve graph items that are inference-based. An interesting future study on the eye gaze patterns and accuracy of answers is suggested from a finding. This study also provides a set of heuristics to be adopted in the teaching and learning of graph interpretation. The findings of this study have implications for teachers in the way they scaffold students' approach to answering graphical items. Additionally, students can employ heuristics to answer graphical items more effectively.

| [1] |
Alemdag, E. and Cagiltay, K., A systematic review of eye tracking research on multimedia learning. Computers & Education, 2018,125: 413428. https://doi.org/10.1016/j.compedu.2018.06.023 doi: 10.1016/j.compedu.2018.06.023

|
| [2] |
Angra, A. and Gardner, S.M., Reflecting on graphs: Attributes of graph choice and construction practices in biology. CBE Life Sciences Education, 2017, 16(3). https://doi.org/10.1187/cbe.16-08-0245 doi: 10.1187/cbe.16-08-0245
|
| [3] |
Ashraf, H., Sodergren, M.H., Merali, N., Mylonas, G., Singh, H. and Darzi, A., Eye-tracking technology in medical education: A systematic review. Medical Teacher, 2018, 40(1): 62–29. https://doi.org/10.1080/0142159X.2017.1391373 doi: 10.1080/0142159X.2017.1391373
|
| [4] |
Ariasi, N. and Mason, L., Uncovering the effect of text structure in learning from a science text: An eye-tracking study. Instructional Science, 2011, 39: 581–601. https://doi.org/10.1007/s11251-010-9142-5 doi: 10.1007/s11251-010-9142-5
|
| [5] | Blackwell, A.F., Introduction thinking with diagrams, in Thinking with Diagrams, A.F. Blackwell, Ed. 2001, 1–3. Springer Netherlands. https://doi.org/10.1007/978-94-017-3524-7_1 |
| [6] |
Bowen, G.M. and Roth, W.-M., Data and graph interpretation practices among preservice science teachers. Journal of Research in Science Teaching, 2005, 42(10): 1063–1088. https://doi.org/10.1002/tea.20086 doi: 10.1002/tea.20086
|
| [7] |
Brand-Gruwel, S., Wopereis, I. and Vermetten, Y., Information problem solving by experts and novices: Analysis of a complex cognitive skill. Computers in Human Behavior, 2005, 21(3): 487–508. https://doi.org/10.1016/j.chb.2004.10.005 doi: 10.1016/j.chb.2004.10.005
|
| [8] | Burke, M.C., A mathematician's proposal. Carnegie perspectives. Carnegie Foundation for the Advancement of Teaching, 2007. |
| [9] |
Carpenter, P.A. and Shah, P., A model of the perceptual and conceptual processes in graph comprehension. Journal of Experimental Psychology: Applied, 1998, 4(2): 75–100. https://doi.org/10.1037/1076-898X.4.2.75 doi: 10.1037/1076-898X.4.2.75
|
| [10] |
Chi, M.T.H., Feltovich, P.J. and Glaser, R., Categorization and representation of physics problems by experts and novices. Cognitive Science, 1981, 5(2): 121–152. https://doi.org/10.1207/s15516709cog0502_2. doi: 10.1207/s15516709cog0502_2
|
| [11] | Çil, E. and Kar, H., Pre-service science teachers' interpretations of graphs: A cross-sectional study. Medical Science Educator, 2015, 24(1): 36–44. |
| [12] |
Dale, S., Heuristics and biases: The science of decision-making. Business Information Review, 2015, 32(2): 93–99. https://doi.org/10.1177/0266382115592536 doi: 10.1177/0266382115592536
|
| [13] |
de Koning, B., Tabbers, H., Rikers, R. and Paas, F., Attention guidance in learning from a complex animation: Seeing is understanding? Learning and Instruction, 2010, 20(2): 111–122. https://doi.org/10.1016/j.learninstruc.2009.02.010 doi: 10.1016/j.learninstruc.2009.02.010
|
| [14] |
Dougusoy-Taylan, B. and Cagiltay, K., Cognitive analysis of experts' and novices' concept mapping processes: An eye tracking study. Computers in Human Behavior, 2014, 36: 82–93. https://doi.org/10.1016/j.chb.2014.03.036 doi: 10.1016/j.chb.2014.03.036
|
| [15] |
Ericsson, K.A. and Kintsch, W., Long-term working memory. Psychological Review, 1995,102(2): 211–245. https://doi.org/10.1037/0033-295X.102.2.211 doi: 10.1037/0033-295X.102.2.211
|
| [16] |
Franconeri, S.L., Alvarez, G.A., Cavanagh, P., Flexible cognitive resources: competitive content maps for attention and memory. Trends in Cognitive Sciences, 2013, 17(3): 134–141. https://doi.org/10.1016/j.tics.2013.01.010 doi: 10.1016/j.tics.2013.01.010
|
| [17] |
Gegenfurtner, A., Lehtinen, E. and Säljö, R., Expertise differences in the comprehension of visualizations: A meta-analysis of eye-tracking research in professional domains. Educational Psychology Review, 2011, 23: 523–552. https://doi.org/10.1007/s10648-011-9174-7 doi: 10.1007/s10648-011-9174-7
|
| [18] |
Glazer, N., Challenges with graph interpretation: A review of the literature. Studies in Science Education, 2011, 47(2): 183–210. https://doi.org/10.1080/03057267.2011.605307 doi: 10.1080/03057267.2011.605307
|
| [19] |
Harsh, J.A., Campillo, M., Murray, C., Myers, C., Nguyen, J. and Maltese, A.V., "Seeing" data like an expert: An eye-tracking study using graphical data representations. CBE-Life Sciences Education, 2019, 18(3). https://doi.org/10.1187/cbe.18-06-0102 doi: 10.1187/cbe.18-06-0102
|
| [20] |
Hyönä, J., The use of eye movements in the study of multimedia learning. Learning and Instruction, 2010, 20(2): 172–176. https://doi.org/10.1016/j.learninstruc.2009.02.013 doi: 10.1016/j.learninstruc.2009.02.013
|
| [21] |
Jacobbe, T. and Horton, R.M., Elementary school teachers' comprehension of data displays. Statistics Education Research Journal, 2010, 9(1): 27–45. https://doi.org/10.52041/serj.v9i1.386 doi: 10.52041/serj.v9i1.386
|
| [22] |
Janvier, C., The notion of chronicle as an epistemological obstacle to the concept of function. The Journal of Mathematical Behavior, 1998, 17(1): 79–103. https://doi.org/10.1016/S0732-3123(99)80062-5 doi: 10.1016/S0732-3123(99)80062-5
|
| [23] |
Just, M.A. and Carpenter, P.A., A theory of reading: From eye fixations to comprehension. Psychological Review, 1980, 87(4): 329–354. https://doi.org/10.1037/0033-295X.87.4.329 doi: 10.1037/0033-295X.87.4.329
|
| [24] |
Kehoe, J., Writing multiple-choice test items. Practical Assessment, Research, and Evaluation, 1994, 4. https://doi.org/10.7275/s3cc-7y76 doi: 10.7275/s3cc-7y76
|
| [25] | Kerslake, D., Graphs, in Children's Understanding of Mathematics, K. M. Hart, Ed. 1981,120–136. London: John Murray. |
| [26] |
Klein, P., Lichtenberger, A., Küchemann, S., Becker, S., Kekule, M., Viiri, J., et al., Visual attention while solving the test of understanding graphs in kinematics: An eye-tracking analysis. European Journal of Physics, 2020, 41(2): 025701. https://doi.org/10.1088/1361-6404/ab5f51 doi: 10.1088/1361-6404/ab5f51
|
| [27] |
Kosslyn, S., Understanding charts and graphs. Applied Cognitive Psychology, 1989, 3: 185–226. https://doi.org/10.1002/acp.2350030302 doi: 10.1002/acp.2350030302
|
| [28] |
Li, S., Duffy, M.C., Lajoie, S.P., Zheng, J., Lachapelle, K., Using eye tracking to examine expert-novice differences during simulated surgical training: A case study. Computers in Human Behavior, 2023,144. https://doi.org/10.1016/j.chb.2023.107720 doi: 10.1016/j.chb.2023.107720
|
| [29] |
Lohse, G.L., A cognitive model for understanding graphical perception. Human Computer Interaction, 1993, 8(4): 353–388. https://doi.org/10.1207/s15327051hci0804_3 doi: 10.1207/s15327051hci0804_3
|
| [30] |
Meletiou-Mavrotheris, M. and Lee, C., Investigating college-level introductory statistics students' prior knowledge of graphing. Canadian Journal of Science, Mathematics and Technology Education, 2010, 10(4): 339–355. https://doi.org/10.1080/14926156.2010.524964 doi: 10.1080/14926156.2010.524964
|
| [31] |
Merali. N., Veeramootoo, D., Singh, S., Eye-tracking technology in surgical training. Journal of Investigative Surgery, 2019, 32(7): 587–593. https://doi.org/10.1080/08941939.2017.1404663 doi: 10.1080/08941939.2017.1404663
|
| [32] |
Paivio, A., Dual coding theory: Retrospect and current status. Canadian Journal of Psychology / Revue Canadienne de psychologie, 1991 43(3): 255–287. https://doi.org/10.1037/h0084295 doi: 10.1037/h0084295
|
| [33] |
Patahuddin, S.M. and Lowrie, T., Examining teachers' knowledge of line graph task: A case of travel task. International Journal of Science and Mathematics Education, 2019, 17(4): 781–800. https://doi.org/10.1007/s10763-018-9893-z doi: 10.1007/s10763-018-9893-z
|
| [34] |
Peebles, D. and Cheng, P.C.H., Modeling the effect of task and graphical representation on response latency in a graph reading task. Human Factors, 2003, 45(1): 28–46. https://doi.org/10.1518/hfes.45.1.28.27225 doi: 10.1518/hfes.45.1.28.27225
|
| [35] |
Ratwani, R.M., Trafton, J.G. and Boehm-Davis, D.A., Thinking graphically: Connecting vision and cognition during graph comprehension. Journal of Experimental Psychology: Applied, 2008, 14(1): 36–49. https://doi.org/10.1037/1076-898X.14.1.36 doi: 10.1037/1076-898X.14.1.36
|
| [36] | Rayner, K. and Slattery, T.J., Eye movements and moment-to-moment comprehension processes in reading, in Beyond Decoding: The Behavioral and Biological Foundations of Reading Comprehension, R. K. Wagner, C. Schatschneider, & C. Phythian-Sence, Eds. 2009, 27–45. Guilford Press. |
| [37] | Readence, J., Bean, T. and Baldwin, S., Content Area Literacy: An Integrated Approach, 2004. Kendell/Hunt. |
| [38] |
Ruf, V., Horrer, A., Berndt, M., Hofer, S.I., Fischer, F., Fischer, M.R., et al., A literature review comparing experts' and non-experts' visual processes of graphs during problem-solving and learning. Education Sciences, 2023, 13(2): 216–216. https://doi.org/10.3390/educsci13020216 doi: 10.3390/educsci13020216
|
| [39] |
Schmid, R., Review of the visual display of quantitative information. by E. R. Tufte. Taxon, 1989, 38(3): 451–451. https://doi.org/10.2307/1222290 doi: 10.2307/1222290
|
| [40] |
Shah, P. and Hoeffner, J., Review of graph comprehension research: Implications for instruction. Educational Psychology Review, 2002, 14(1): 47–69. https://doi.org/10.1023/A:1013180410169 doi: 10.1023/A:1013180410169
|
| [41] |
Shah, P., Mayer, R.E. and Hegarty, M., Graphs as aids to knowledge construction: Signaling techniques for guiding the process of graph comprehension. Journal of Educational Psychology, 1999, 91(4): 690–702. https://doi.org/10.1037/0022-0663.91.4.690 doi: 10.1037/0022-0663.91.4.690
|
| [42] |
Sharafi, Z. Soh, Z., Guéhéneuc, Y.G., A systematic literature review on the usage of eye-tracking in software engineering, Information and Software Technology, 2015, 67: 79–107. https://doi.org/10.1016/j.infsof.2015.06.008 doi: 10.1016/j.infsof.2015.06.008
|
| [43] | Shvarts, A. and Abrahamson, D., Coordination dynamics of semiotic mediation: A functional dynamic systems perspective on mathematics teaching/learning. Constructivist Foundations, 2023, 18(2): 220–234. |
| [44] |
Spering, M., Montagnini, A., Do we track what we see? Common versus independent processing for motion perception and smooth pursuit eye movements: A review. Vision Research, 2011, 51(8): 836–852. https://doi.org/10.1016/j.visres.2010.10.017 doi: 10.1016/j.visres.2010.10.017
|
| [45] |
Susac, A., Bubić, A., Martinjak, P., Planinic, M. and Palmovic, M., Graphical representations of data improve student understanding of measurement and uncertainty: An eye-tracking study. Physical Review Physics Education Research, 2017, 13 (2): 020125. https://doi.org/10.1103/PhysRevPhysEducRes.13.020125 doi: 10.1103/PhysRevPhysEducRes.13.020125
|
| [46] | Szyjka, S., Mumba, F., Wise, K. and Wise, K., Confirmatory factor analysis of the questionnaire of attitude toward statistical graphs for use in science education. Journal of Baltic Science Education, 2011, 10(4): 261–276. |
| [47] |
Tan, A.L., Teo, T.W., Choy, B.H. and Ong, Y.S., The S-T-E-M quartet. Innovation and Education, 2019, 1(3): 1–14. https://doi.org/10.1186/s42862-019-0005-x doi: 10.1186/s42862-019-0005-x
|
| [48] |
Teo, T.W. and Goh, W.P.G., Assessing lower track students' learning in science inference skills in Singapore. Asia-Pacific Science Education, 2019, 5(5): 1‒19. https://doi.org/10.1186/s41029-019-0033-z doi: 10.1186/s41029-019-0033-z
|
| [49] | Trafton, J.G., Marshall, S., Mintz, F. and Trickett, S.B., Extracting explicit and implicit information from complex visualizations, in Diagramatic Representation and Inference, M. Hegarty, B. Meyer, & H. Narayanan, Eds. 2002,206–220. Berlin: Springer-Verlag. |
| [50] |
Tsai, M.J., Hou, H.T., Lai, M.L., Liu, W.Y. and Yang, F.Y., Visual attention for solving multiple-choice science problem: An eye-tracking analysis. Computers & Education, 2012, 58(1): 375–385. https://doi.org/10.1016/j.compedu.2011.07.012 doi: 10.1016/j.compedu.2011.07.012
|
| [51] |
Veenman, M.V.J., Van Hout-Wolters, B.H.A.M. and Afflerbach, P., Metacognition and learning: Conceptual and methodological considerations. Metacognition and Learning, 2006, 1: 3–14. https://doi.org/10.1007/s11409-006-6893-0 doi: 10.1007/s11409-006-6893-0
|
| [52] | Yen, M.H., Lee, C.N., Yang, Y.C., Eye movement patterns in solving scientific graph problems. Diagrammatic Representation and Inference: 7th International Conference, Diagrams 2012, Canterbury, UK, July 2-6, 2012. Proceedings 7, 2012,343–345. Springer, Berlin, Heidelberg. https://doi.org/10.1007/978-3-642-31223-6_46 |
| [53] |
Ziv, G., Gaze behavior and visual attention: A review of eye tracking studies in aviation. The International Journal of Aviation Psychology, 2016, 26 (3-4): 75–104. https://doi.org/10.1080/10508414.2017.1313096 doi: 10.1080/10508414.2017.1313096
|
Figures(15) / Tables(4)
Tang Wee Teo, Zi Qi Peh. An exploratory study on eye-gaze patterns of experts and novices of science inference graph items[J]. STEM Education, 2023, 3(3): 205-229. doi: 10.3934/steme.2023013


 DownLoad: