The United States' response to the COVID-19 pandemic has relied heavily on personal mitigation behaviors versus centralized governmental prevention strategies, especially early in the virus's outbreak. This study examines how family structure shapes mitigation, focusing on the intersectional effects of gender, marital status, and the presence of children while accounting for differences in worry about infection from the virus. Using data from a national survey of 10,368 United States adults early in the pandemic (March 2020), survey-weighted logistic regression models show important differences in the likelihood of personal mitigation adoption across family structures. Unmarried women with children were most likely to report personal mitigation behaviors, including washing hands more frequently and avoiding social gatherings. Our findings highlight the differential impacts of the pandemic on those living in specific family circumstances.
Citation: Casey T. Harris, Kevin Fitzpatrick, Michael Niño, Priya Thelapurath, Grant Drawve. Examining disparities in the early adoption of Covid-19 personal mitigation across family structures[J]. AIMS Public Health, 2022, 9(3): 589-605. doi: 10.3934/publichealth.2022041
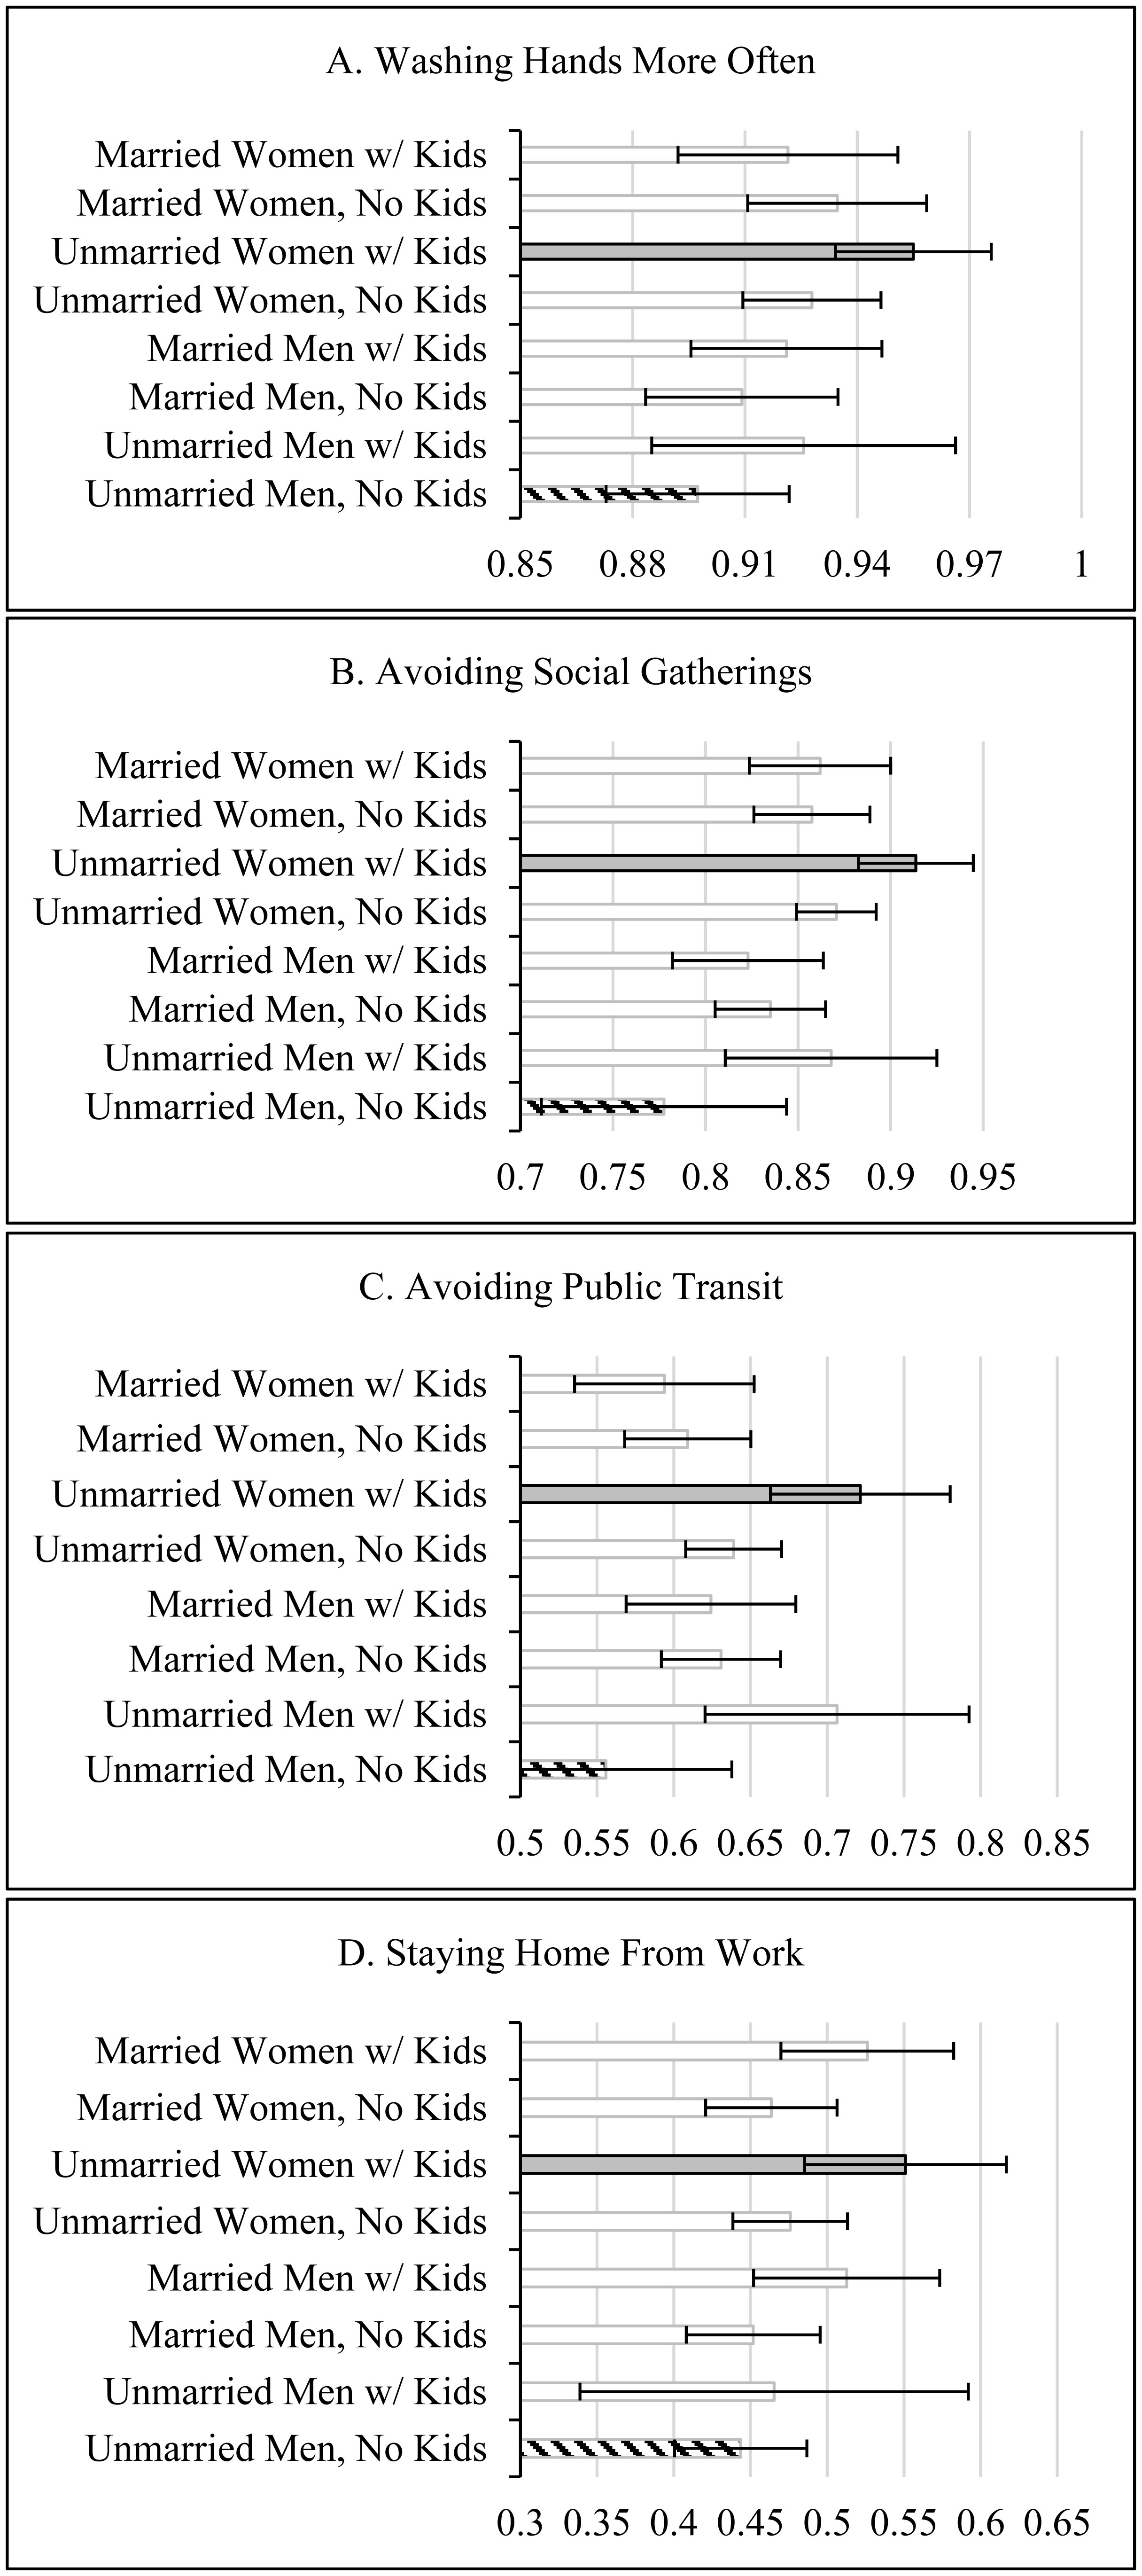
The United States' response to the COVID-19 pandemic has relied heavily on personal mitigation behaviors versus centralized governmental prevention strategies, especially early in the virus's outbreak. This study examines how family structure shapes mitigation, focusing on the intersectional effects of gender, marital status, and the presence of children while accounting for differences in worry about infection from the virus. Using data from a national survey of 10,368 United States adults early in the pandemic (March 2020), survey-weighted logistic regression models show important differences in the likelihood of personal mitigation adoption across family structures. Unmarried women with children were most likely to report personal mitigation behaviors, including washing hands more frequently and avoiding social gatherings. Our findings highlight the differential impacts of the pandemic on those living in specific family circumstances.

| [1] | (2022) Centers for Disease Control and PreventionCOVID Data Tracker. Atlanta, GA: US Department of Health and Human Services. Available from: https://covid.cdc.gov/covid-data-tracker |
| [2] |
Goolsbee A, Syverson C (2021) Fear, lockdown, and diversion: Comparing drivers of pandemic economic decline 2020. J Public Econ 193: 1-8. https://doi.org/10.1016/j.jpubeco.2020.104311 
|
| [3] |
Merow C, Urban MC (2020) Seasonality and uncertainty in global COVID-19 growth rates. Proc Natl Acad Sci USA 117: 27456-27464. https://doi.org/10.1073/pnas.2008590117
|
| [4] | Rutter H, Wolpert M, Greenhalgh T (2020) Managing uncertainty in the Covid-19 era. BMJ 370: 1-2. https://doi.org/10.1136/bmj.m3349 |
| [5] |
Adolph C, Amano K, Bang-Jensen B, et al. (2021) Pandemic Politics: Timing State-Level Social Distancing Responses to COVID-19. J Health Polit Policy Law 46: 211-233. https://doi.org/10.1215/03616878-8802162
|
| [6] | Kruesi K (2020) Governors stress ‘personal responsibility’ over virus orders. NBC News Chicago . Available from: https://www.nbcchicago.com/news/coronavirus/governors-stress-personal-responsibility-over-virus-orders/2299821/ |
| [7] |
Atchison C, Bowman LR, Vrinten C, et al. (2021) Early perceptions and behavioral responses during the COVID-19 pandemic: a cross-sectional survey of UK adults. BMJ Open 11: e043577. https://doi.org/10.1136/bmjopen-2020-043577
|
| [8] |
Haischer MH, Beilfuss R, Hart MR, et al. (2020) Who is wearing a mask? Gender-, age-, and location-related differences during the COVID-19 pandemic. PLOS One 15: e0240785. https://doi.org/10.1371/journal.pone.0240785
|
| [9] |
Hearne BN, Niño MN (2020) Understanding how race, ethnicity, and gender shape mask-wearing adherence during the COVID-19 pandemic: evidence from the COVID impact survey. J Racial Ethn Health Disparities 9: 176-183. https://doi.org/10.1007/s40615-020-00941-1
|
| [10] | Pew Research CenterRepublicans, Democrats Move Even Further Apart in Coronavirus Concerns (2020). Available from: https://www.pewresearch.org/politics/2020/06/25/republicans-democrats-move-even-further-apart-in-coronavirus-concerns/ |
| [11] | Ritter Zacc, Brenan M (2020) New April Guidelines Boost Perceived Efficacy of Face Masks. Gallup News . Available from: https://news.gallup.com/poll/310400/new-april-guidelines-boost-perceived-efficacy-face-masks.aspx |
| [12] |
Bond L, Nolan T (2011) Making sense of perceptions of risk of diseases and vaccinations: a qualitative study combining models of health beliefs, decision-making and risk perception. BMC Public Health 11: 1-14. https://doi.org/10.1186/1471-2458-11-943
|
| [13] |
Giritli NK, Olofsson A (2020) Managing the Covid-19 pandemic through individual responsibility: the consequences of a world risk society and enhanced ethopolitics. J Risk Res 23: 1031-1035. https://doi.org/10.1080/13669877.2020.1756382
|
| [14] |
Liu PL (2021) COVID-19 information on social media and preventive behaviors: Managing the pandemic through personal responsibility. Soc Sci Med 277: 113928. https://doi.org/10.1016/j.socscimed.2021.113928
|
| [15] | Calarco JM, Meanwell E, Anderson E, et al. (2020) “My husband thinks I'm crazy”: COVID-19-related conflict in couples with young children. SocArXiv . https://doi.org/10.31235/osf.io/cpkj6 |
| [16] |
Collins C, Ruppanner L, Landivar LC, et al. (2021) The gendered consequences of a weak infrastructure of care: School reopening plans and -parents' employment during the COVID-19 pandemic. Gender Soc 35: 180-193. https://doi.org/10.1177/08912432211001300
|
| [17] | Landivar L, Ruppanner C, Scarborough WJ, et al. (2020) Early signs indicate that COVID-19 is exacerbating gender inequality in the labor force. Socius 6: 2378023120947997. https://doi.org/10.1177/2378023120947997 |
| [18] |
Hertz R, Mattes J, Shook A (2021) When paid work invades the family: Single mothers in the COVID-19 pandemic. J Fam Issuesp 42: 2019-2045. https://doi.org/10.1177/0192513X20961420
|
| [19] |
Prime H, Wade M, Browne DT (2020) Risk and resilience in family well-being during the COVID-19 pandemic. Am Psychol 5: 631-643. https://doi.org/10.1037/amp0000660
|
| [20] |
Kim SJ, Wendy B (2020) Social vulnerability and racial inequality in COVID-19 deaths in Chicago. Health Educ Behav 47: 509-513. https://doi.org/10.1177/1090198120929677
|
| [21] |
Fitpatrick KM, Spialek M (2020) Hurricane Harvey's Aftermath: Place, Race, and Inequality in Disaster Recovery. New York: New York University Press. https://doi.org/10.18574/nyu/9781479800735.001.0001
|
| [22] |
Klinenberg E (2002) Heat Wave: A Social Autopsy of Disaster in Chicago. Chicago: University of Chicago Press. https://doi.org/10.7208/chicago/9780226026718.001.0001
|
| [23] |
Dwyer JW, Coward RT (1991) A multivariate comparison of the involvement of adult sons versus daughters in the care of impaired parents. J Gerontol 46: S259-S269. https://doi.org/10.1093/geronj/46.5.S259
|
| [24] |
Wiemers EE, Bianchi SM (2015) Competing Demands from Aging Parents and Adult Children in Two Cohorts of American Women. Popul Dev Rev 41: 127-146. https://doi.org/10.1111/j.1728-4457.2015.00029.x
|
| [25] |
Swinkels JC, Broese G, Marjolein I, et al. (2019) Male and female partner-caregivers' burden: Does it get worse over time?. Gerontologist 59: 1103-1111. https://doi.org/10.1093/geront/gny132
|
| [26] |
Davis JL, Buchanan KL, Katz RV, et al. (2012) Gender differences in cancer screening beliefs, behaviors, and willingness to participate: Implications for health promotion. Am J Mens Health 6: 211-217. https://doi.org/10.1177/1557988311425853
|
| [27] |
Vaidya V, Partha G, Karmakar M (2012) Care services in the United States. J Womens Health 21: 140-145. http://doi.org/10.1089/jwh.2011.2876
|
| [28] |
Van der Vegt Isabell, Kleinberg B (2020) Women worry about family, men about the economy: Gender differences in emotional responses to COVID-19. Soc Informatics 12467: 397-409. https://doi.org/10.1007/978-3-030-60975-7_29
|
| [29] |
Byrnes JP, Miller DC, Schafer WD (1999) Gender differences in risk taking: A meta-analysis. Psychol Bull 125: 367-383. https://doi.org/10.1037/0033-2909.125.3.367
|
| [30] | Waite LJ, Maggie G (2000) The Case for Marriage: Why Married People are Happier, Healthier, and Better Off Financially. New York: Doubleday. |
| [31] |
Horn EE, Xu Y, Beam CR, et al. (2013) Accounting for the physical and mental health benefits of entry into marriage: A genetically informed study of selection and causation. J Fam Psychol 27: 30-41. https://doi.org/10.1037/a0029803
|
| [32] |
Gutierrez CM (2018) The institutional determinants of health insurance: Moving away from labor market, marriage, and family attachments under the ACA. Am Sociol Rev 83: 1144-1170. https://doi.org/10.1177/0003122418811112
|
| [33] |
Pandey KR, Yang F, Cagney KA, et al. (2019) The impact of marital status on health care utilization among Medicare beneficiaries. Medicine 98: e14871. https://dx.doi.org/10.1097%2FMD.0000000000014871
|
| [34] |
Nomaguchi KM, Bianchi SM (2004) Exercise time: Gender differences in the effects of marriage, parenthood, and employment. J Marriage Fam 66: 413-430. https://doi.org/10.1111/j.1741-3737.2004.00029.x
|
| [35] |
Werneck AO, Winpenny EM, Foubister C, et al. (2020) Cohabitation and marriage during the transition between adolescence and emerging adulthood: A systematic review of changes in weight-related outcomes, diet and physical activity. Prev Med Rep 20: 101261. https://doi.org/10.1016/j.pmedr.2020.101261
|
| [36] |
Corder K, Winpenny EM, Foubister C, et al. (2020) Becoming a parent: A systematic review and meta-analysis of changes in BMI, diet, and physical activity. Obes Rev 21: e12959. https://doi.org/10.1111/obr.12959
|
| [37] |
Görlitz K, Tamm M (2020) Parenthood, risk attitudes and risky behavior. J Econ Psychol 79: 102189. https://doi.org/10.1016/j.joep.2019.102189
|
| [38] |
Andrews FJ, Swerissen H (2006) Managing the family's health: Preferences and experiences of women with different work and family arrangements. Aust J Prim Health 12: 109-116. https://doi.org/10.1071/PY06053
|
| [39] |
Heck KE, Parker JD (2002) Family structure, socioeconomic status, and access to health care for children. Health Serv Res 37: 171-184. https://doi.org/10.1111/1475-6773.99190
|
| [40] |
Raphael JL, Zhang Y, Liu H, et al. (2010) Parenting stress in US families: implications for pediatric healthcare utilization. Child Care Health Dev 36: 216-224. https://doi.org/10.1111/j.1365-2214.2009.01052.x
|
| [41] |
Dong E, Du H, Gardner L (2020) An interactive web-based dashboard to track COVID-19 in real time. Lancet Infect Dis 20: 533-534. https://doi.org/10.1016/s1473-3099(20)30120-1
|
| [42] |
Uddin S, Imam T, Khushi M, et al. (2021) How did socio-demographic status and personal attributes influence compliance to COVID-19 preventive behaviours during the early outbreak in Japan? Lessons for pandemic management. Per Indiv Differ 175: 110692. https://doi.org/10.1016/j.paid.2021.110692
|
Figures(1) / Tables(3)

Casey T. Harris, Kevin Fitzpatrick, Michael Niño, Priya Thelapurath, Grant Drawve. Examining disparities in the early adoption of Covid-19 personal mitigation across family structures[J]. AIMS Public Health, 2022, 9(3): 589-605. doi: 10.3934/publichealth.2022041


 DownLoad: