Human motion capture (mocap) data is of crucial importance to the realistic character animation, and the missing optical marker problem caused by marker falling off or occlusions often limit its performance in real-world applications. Although great progress has been made in mocap data recovery, it is still a challenging task primarily due to the articulated complexity and long-term dependencies in movements. To tackle these concerns, this paper proposes an efficient mocap data recovery approach by using Relationship-aggregated Graph Network and Temporal Pattern Reasoning (RGN-TPR). The RGN is comprised of two tailored graph encoders, local graph encoder (LGE) and global graph encoder (GGE). By dividing the human skeletal structure into several parts, LGE encodes the high-level semantic node features and their semantic relationships in each local part, while the GGE aggregates the structural relationships between different parts for whole skeletal data representation. Further, TPR utilizes self-attention mechanism to exploit the intra-frame interactions, and employs temporal transformer to capture long-term dependencies, whereby the discriminative spatio-temporal features can be reasonably obtained for efficient motion recovery. Extensive experiments tested on public datasets qualitatively and quantitatively verify the superiorities of the proposed learning framework for mocap data recovery, and show its improved performance with the state-of-the-arts.
Citation: Chuanqin Zheng, Qingshuang Zhuang, Shu-Juan Peng. Efficient motion capture data recovery via relationship-aggregated graph network and temporal pattern reasoning[J]. Mathematical Biosciences and Engineering, 2023, 20(6): 11313-11327. doi: 10.3934/mbe.2023501
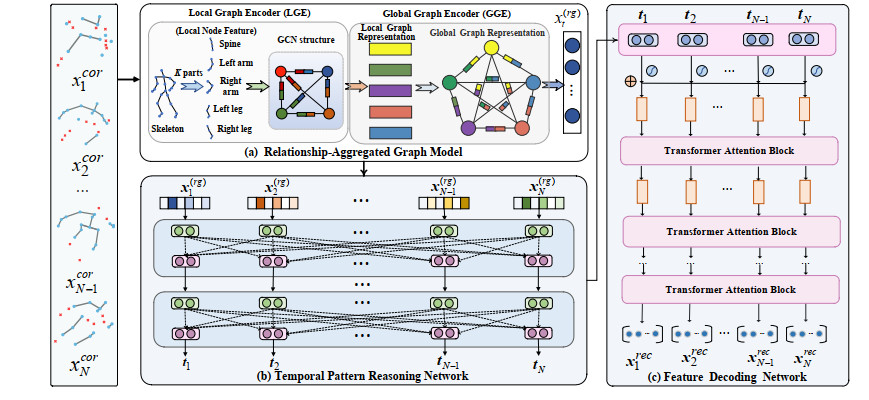
Human motion capture (mocap) data is of crucial importance to the realistic character animation, and the missing optical marker problem caused by marker falling off or occlusions often limit its performance in real-world applications. Although great progress has been made in mocap data recovery, it is still a challenging task primarily due to the articulated complexity and long-term dependencies in movements. To tackle these concerns, this paper proposes an efficient mocap data recovery approach by using Relationship-aggregated Graph Network and Temporal Pattern Reasoning (RGN-TPR). The RGN is comprised of two tailored graph encoders, local graph encoder (LGE) and global graph encoder (GGE). By dividing the human skeletal structure into several parts, LGE encodes the high-level semantic node features and their semantic relationships in each local part, while the GGE aggregates the structural relationships between different parts for whole skeletal data representation. Further, TPR utilizes self-attention mechanism to exploit the intra-frame interactions, and employs temporal transformer to capture long-term dependencies, whereby the discriminative spatio-temporal features can be reasonably obtained for efficient motion recovery. Extensive experiments tested on public datasets qualitatively and quantitatively verify the superiorities of the proposed learning framework for mocap data recovery, and show its improved performance with the state-of-the-arts.

| [1] |
S. P. Zubova, P. Svetlana, K. A. Raetskiy, Modeling the trajectory of motion of a linear dynamic system with multi-point conditions, Math. Biosci. Eng., 29 (2021), 7861–7876. https://doi.org/10.3934/mbe.2021390 doi: 10.3934/mbe.2021390

|
| [2] |
J. H. Zhou, S. Jia, J. B. Chen, M. Chen, Motion and trajectory planning modeling for mobile landing mechanism systems based on improved genetic algorithm, Math. Biosci. Eng., 18 (2021), 231–252. https://doi.org/10.3934/mbe.2021012 doi: 10.3934/mbe.2021012
|
| [3] |
X. Liu, G. F. He, S. J. Peng, Y. M. Cheung, Y. Y. Tang, Efficient human motion retrieval via temporal adjacent bag of words and discriminative neighborhood preserving dictionary learning, IEEE Trans. Hum.-Mach. Syst., 46 (2021), 763–776. https://doi.org/ 10.1109/THMS.2017.2675959 doi: 10.1109/THMS.2017.2675959
|
| [4] |
D. Holden, J. Saito, T. Komura, A deep learning framework for character motion synthesis and editing, ACM Trans. Graphics, 35 (2016), 1–11. https://doi.org/10.1145/2897824.2925975 doi: 10.1145/2897824.2925975
|
| [5] | Q. Cui, H. Sun, Y. Li, Y. Kong, A deep bi-directional attention network for human motion recovery, in Proceedings of the International Joint Conference on Artificial Intelligence, (2019), 701–707. https://doi.org/10.5555/3367032.3367133 |
| [6] |
Z. Yang, Y. D. Yan, H. T. Gan, J. Zhao, Z. W. Ye, A safe semi-supervised graph convolution network, Math. Biosci. Eng., 19 (2022), 12677–12692. https://doi.org/10.3934/mbe.2022592 doi: 10.3934/mbe.2022592
|
| [7] |
H. Yuan, J. Huang, J. Li, Protein-ligand binding affinity prediction model based on graph attention network, Math. Biosci. Eng., 8 (2021), 9148–9162. https:/doi.org/10.3934/mbe.2021451 doi: 10.3934/mbe.2021451
|
| [8] | A. Aristidou, J. Cameron, J. Lasenby, Real-time estimation of missing markers in human motion capture, in Proceedings of International Conference on Bioinformatics and Biomedical Engineering, (2008), 1343–1346. https: /doi.org/10.1109/ICBBE.2008.665 |
| [9] | Q. Wu, P. Boulanger, Real-time estimation of missing markers for reconstruction of human motion, in Proceedings of Symposium on Virtual Reality, (2011), 161–168. https: /doi.org/10.1109/SVR.2011.35 |
| [10] |
M. Burke, J. Lasenby, Estimating missing marker positions using low dimensional kalman smoothing, J. Biomech., 49 (2016), 1854–1858. https://doi.org/10.1016/j.jbiomech.2016.04.016 doi: 10.1016/j.jbiomech.2016.04.016
|
| [11] | R. Y. Lai, P. C. Yuen, K. Lee, Motion capture data completion and denoising by singular value thresholding, in Proceedings of IEEE international conference on eurographics, (2011), 45–48. http://dx.doi.org/10.2312/EG2011/short/045-048 |
| [12] |
C. H. Tan, J. Hou, L. P. Chau, Human motion capture data recovery using trajectory-based matrix completion, Electron. Lett., 49 (2013), 752–754. https://doi.org/10.1049/el.2013.0442 doi: 10.1049/el.2013.0442
|
| [13] |
Y. Feng, J. Xiao, Y. Zhuang, X. Yang, J. J. Zhang, R. Song, Exploiting temporal stability and low-rank structure for motion capture data refinement, Inf. Sci., 277 (2014), 777–793. https://doi.org/10.1016/j.ins.2014.03.013 doi: 10.1016/j.ins.2014.03.013
|
| [14] | S. Peng, G. He, X. Liu, H. Wang, B. Zhong, Motion segmentation based human motion capture data recovery via sparse and low-rank decomposition, J. Comput.-Aided Des. Comput. Graphics, 27 (2015), 721–730. |
| [15] | L. Herda, P. Fua, R. Plankers, R. Boulic, D. Thalmann, Skeleton-based motion capture for robust reconstruction of human motion, in Proceedings Computer Animation, (2000), 77–83. https://doi.org/10.1109/CA.2000.889046 |
| [16] | L. Li, J. McCann, N. S. Pollard, C. Faloutsos, Dynammo: Mining and summarization of coevolving sequences with missing values, in Proceedings of the 15th ACM SIGKDD International Conference on Knowledge Discovery and Data Mining, (2009), 507–516. https://doi.org/10.1145/1557019.1557078 |
| [17] |
J. Xiao, Y. Feng, W. Hu, Predicting missing markers in human motion capture using l1-sparse representation, Comput. Anim. Virtual Worlds, 22 (2011), 221–228. https://doi.org/10.1002/cav.413 doi: 10.1002/cav.413
|
| [18] | L. Ji, R. Liu, D. Zhou, Q. Zhang, X. Wei, Missing data recovery for human mocap data based on a-lstm and ls constraint, in Proceedings of IEEE International Conference on Signal and Image Processing, (2020), 729–734. https://doi.org/10.1109/ICSIP49896.2020.9339359 |
| [19] |
C. Xie, J. Lv, Y. Li, Y. Sang, Cross-correlation conditional restricted boltzmann machines for modeling motion style, Knowledge-Based Syst., 159 (2018), 259–269. https://doi.org/10.1016/j.knosys.2018.06.026 doi: 10.1016/j.knosys.2018.06.026
|
| [20] |
S. K. Tian, N. Dai, L. L. Li, W. W. Li, Y. C. Sun, X. S. Cheng, Three-dimensional mandibular motion trajectory-tracking system based on BP neural network, Math. Biosci. Eng., 17 (2020), 5709–5726. https://doi.org/10.3934/mbe.2020307 doi: 10.3934/mbe.2020307
|
| [21] |
X. Liu, Z. Hu, H. Ling, Y. M. Cheung, MTFH: A matrix tri-factorization hashing framework for efficient cross-modal retrieval, IEEE Trans. Pattern Anal. Mach. Intell., 43 (2021), 964–981. https://doi.org/10.1109/TPAMI.2019.2940446 doi: 10.1109/TPAMI.2019.2940446
|
| [22] |
S. Li, Y. Zhou, H. Zhu, W. Xie, Y. Zhao, X. Liu, Bidirectional recurrent autoencoder for 3d skeleton motion data refinement, Comput. Graphics, 81 (2019), 92–103. https://doi.org/10.1016/j.cag.2019.03.010 doi: 10.1016/j.cag.2019.03.010
|


Figures(4) / Tables(3)

Chuanqin Zheng, Qingshuang Zhuang, Shu-Juan Peng. Efficient motion capture data recovery via relationship-aggregated graph network and temporal pattern reasoning[J]. Mathematical Biosciences and Engineering, 2023, 20(6): 11313-11327. doi: 10.3934/mbe.2023501


 DownLoad: