Ulcerative colitis (UC) is an idiopathic inflammatory disease with an increasing incidence. This study aimed to identify potential UC biomarkers and associated immune infiltration characteristics.
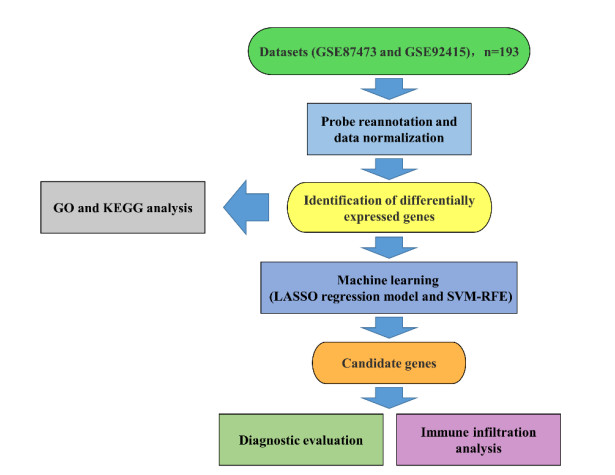
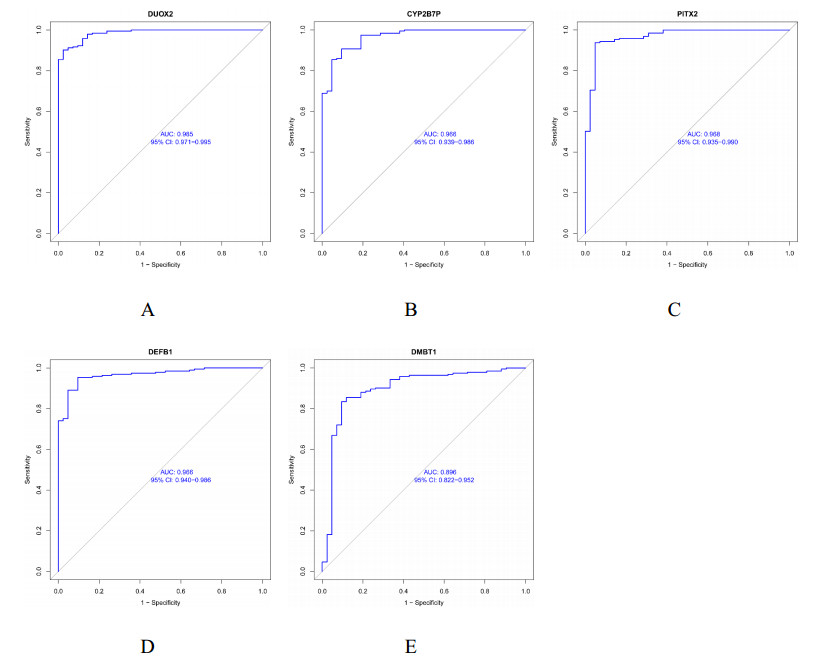
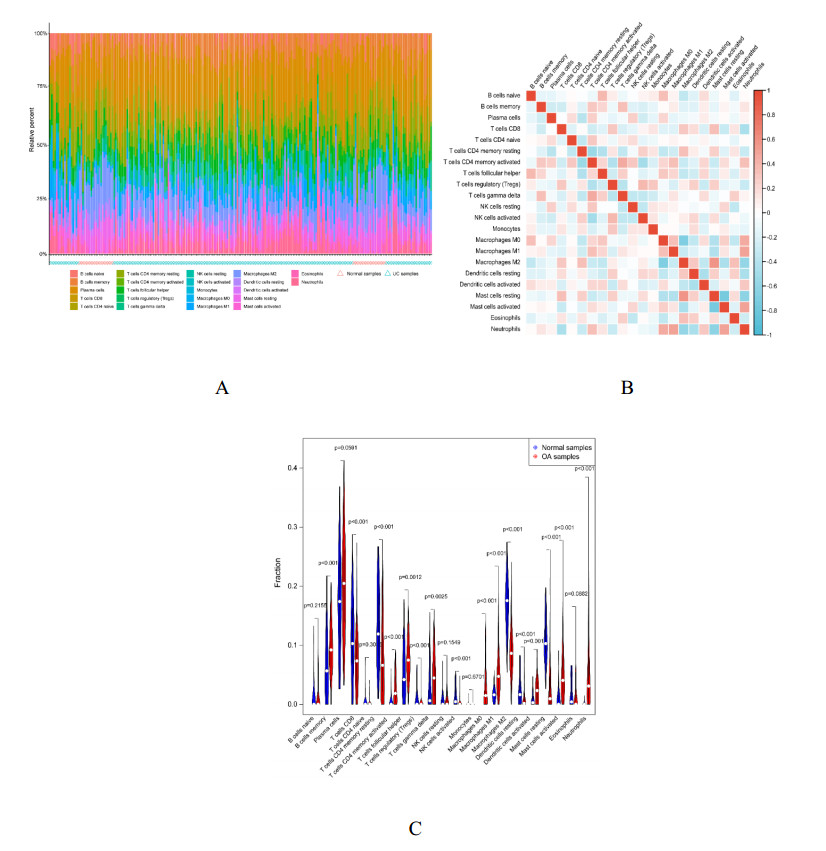
Two datasets (GSE87473 and GSE92415) were merged to obtain 193 UC samples and 42 normal samples. Using R, differentially expressed genes (DEGs) between UC and normal samples were filtered out, and their biological functions were investigated using Gene Ontology and Kyoto Encyclopedia of Genes and Genomes analyses. Promising biomarkers were identified using least absolute shrinkage selector operator regression and support vector machine recursive feature elimination, and their diagnostic efficacy was evaluated through receiver operating characteristic (ROC) curves. Finally, CIBERSORT was used to investigate the immune infiltration characteristics in UC, and the relationship between the identified biomarkers and various immune cells was examined.
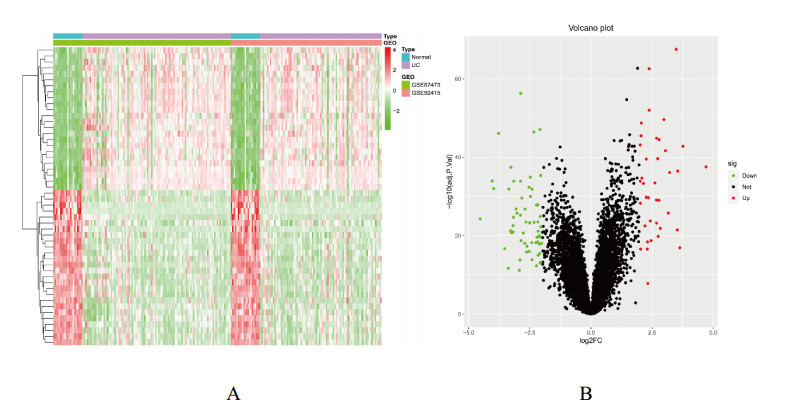
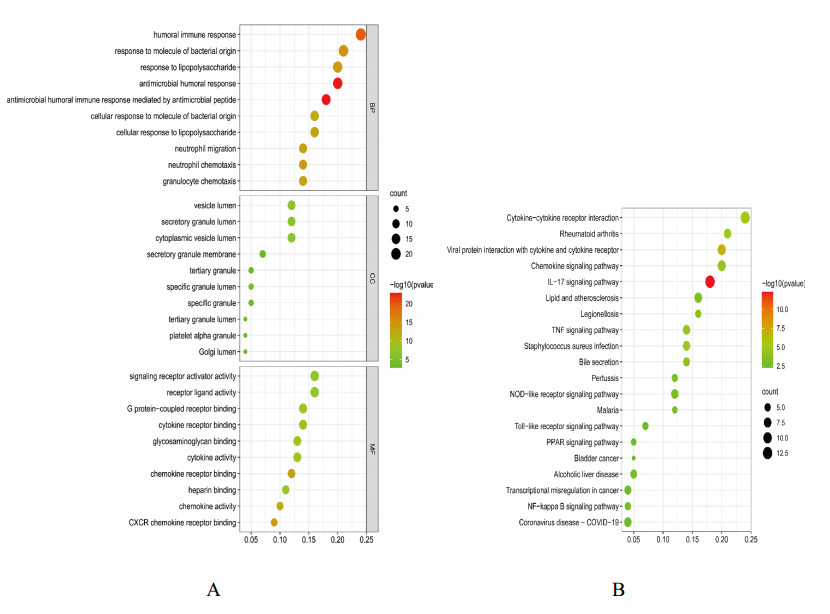
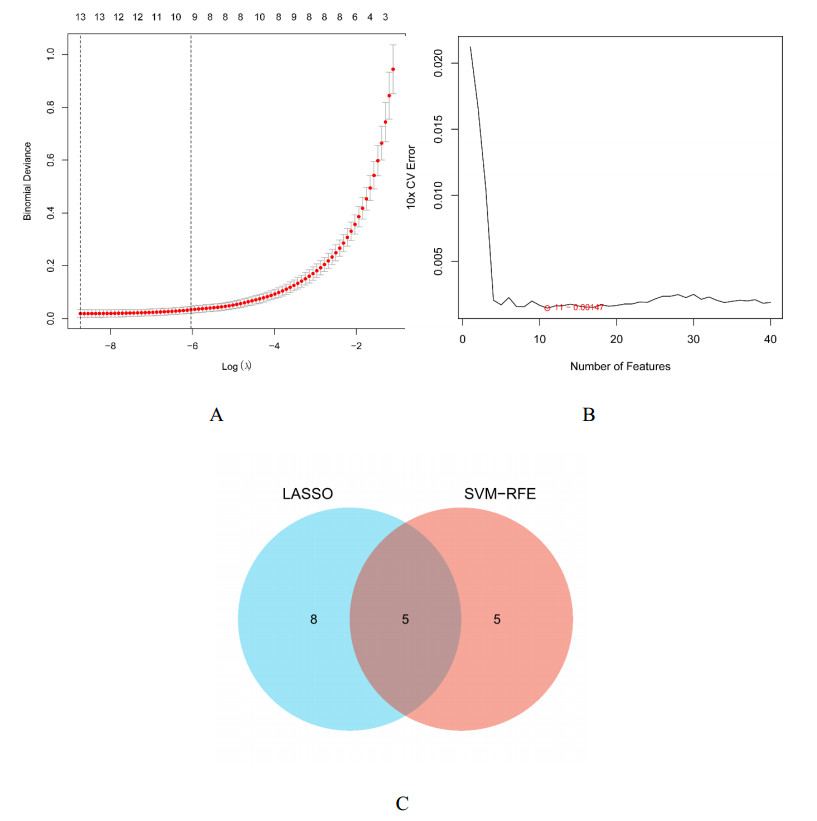
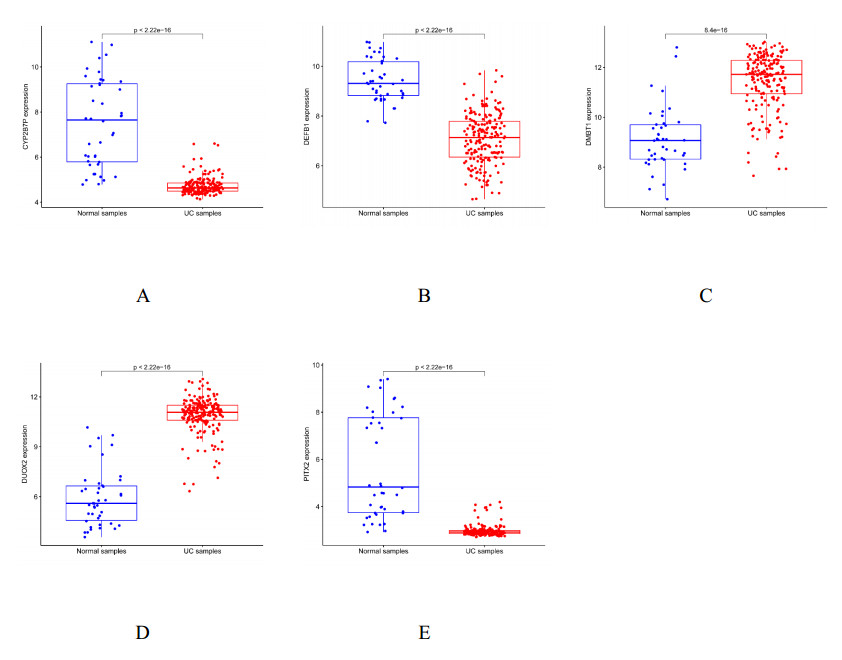
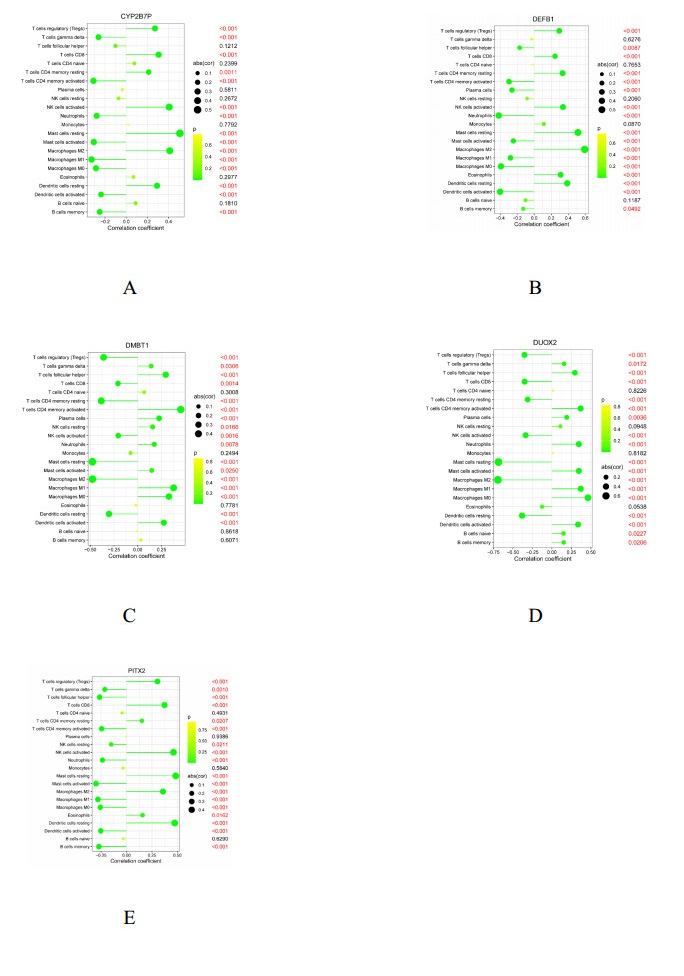
We found 102 DEGs, of which 64 were significantly upregulated, and 38 were significantly downregulated. The DEGs were enriched in pathways associated with interleukin-17, cytokine–cytokine receptor interaction and viral protein interactions with cytokines and cytokine receptors, among others. Using machine learning methods and ROC tests, we confirmed DUOX2, DMBT1, CYP2B7P, PITX2 and DEFB1 to be essential diagnostic genes for UC. Immune cell infiltration analysis revealed that all five diagnostic genes were correlated with regulatory T cells, CD8 T cells, activated and resting memory CD4 T cells, activated natural killer cells, neutrophils, activated and resting mast cells, activated and resting dendritic cells and M0, M1 and M2 macrophages.
DUOX2, DMBT1, CYP2B7P, PITX2 and DEFB1 were identified as prospective biomarkers for UC. A new perspective on understanding the progression of UC may be provided by these biomarkers and their relationship with immune cell infiltration.
Citation: Yuedan Wang, Jinke Huang, Jiaqi Zhang, Fengyun Wang, Xudong Tang. Identifying biomarkers associated with the diagnosis of ulcerative colitis via bioinformatics and machine learning[J]. Mathematical Biosciences and Engineering, 2023, 20(6): 10741-10756. doi: 10.3934/mbe.2023476
Ulcerative colitis (UC) is an idiopathic inflammatory disease with an increasing incidence. This study aimed to identify potential UC biomarkers and associated immune infiltration characteristics.
Two datasets (GSE87473 and GSE92415) were merged to obtain 193 UC samples and 42 normal samples. Using R, differentially expressed genes (DEGs) between UC and normal samples were filtered out, and their biological functions were investigated using Gene Ontology and Kyoto Encyclopedia of Genes and Genomes analyses. Promising biomarkers were identified using least absolute shrinkage selector operator regression and support vector machine recursive feature elimination, and their diagnostic efficacy was evaluated through receiver operating characteristic (ROC) curves. Finally, CIBERSORT was used to investigate the immune infiltration characteristics in UC, and the relationship between the identified biomarkers and various immune cells was examined.
We found 102 DEGs, of which 64 were significantly upregulated, and 38 were significantly downregulated. The DEGs were enriched in pathways associated with interleukin-17, cytokine–cytokine receptor interaction and viral protein interactions with cytokines and cytokine receptors, among others. Using machine learning methods and ROC tests, we confirmed DUOX2, DMBT1, CYP2B7P, PITX2 and DEFB1 to be essential diagnostic genes for UC. Immune cell infiltration analysis revealed that all five diagnostic genes were correlated with regulatory T cells, CD8 T cells, activated and resting memory CD4 T cells, activated natural killer cells, neutrophils, activated and resting mast cells, activated and resting dendritic cells and M0, M1 and M2 macrophages.
DUOX2, DMBT1, CYP2B7P, PITX2 and DEFB1 were identified as prospective biomarkers for UC. A new perspective on understanding the progression of UC may be provided by these biomarkers and their relationship with immune cell infiltration.

| [1] |
R. Ungaro, S. Mehandru, P. B. Allen, L. Peyrin-Biroulet, J. F. Colombel, Ulcerative colitis, Lancet, 389 (2017), 1756–1770. http://doi.org/10.1016/s0140-6736(16)32126-2 doi: 10.1016/s0140-6736(16)32126-2

|
| [2] |
S. C. Ng, H. Y. Shi, N. Hamidi, F. E. Underwood, W. Tang, E. I. Benchimol, et al., Worldwide incidence and prevalence of inflammatory bowel disease in the 21st century: a systematic review of population-based studies, Lancet, 390 (2017), 2769–2778. http://doi.org/10.1016/s0140-6736(17)32448-0 doi: 10.1016/s0140-6736(17)32448-0
|
| [3] |
J. Burisch, H. Vardi, D. Schwartz, M. Friger, G. Kiudelis, J. Kupčinskas, et al., Health-care costs of inflammatory bowel disease in a pan-European, community-based, inception cohort during 5 years of follow-up: a population-based study, Lancet Gastroenterol. Hepatol., 5 (2020), 454–464. http://doi.org/10.1016/s2468-1253(20)30012-1 doi: 10.1016/s2468-1253(20)30012-1
|
| [4] |
M. Gajendran, P. Loganathan, G. Jimenez, A. P. Catinella, N. Ng, C. Umapathy, et al., A comprehensive review and update on ulcerative colitis, Dis. Mon., 65 (2019), 100851. http://doi.org/10.1016/j.disamonth.2019.02.004 doi: 10.1016/j.disamonth.2019.02.004
|
| [5] |
C. Parola, D. Neumeier, S. T. Reddy, Integrating high-throughput screening and sequencing for monoclonal antibody discovery and engineering, Immunology, 153 (2018), 31–41. http://doi.org/10.1111/imm.12838 doi: 10.1111/imm.12838
|
| [6] |
M. A. Dillies, A. Rau, J. Aubert, C. Hennequet-Antier, M. Jeanmougin, N. Servant, et al., A comprehensive evaluation of normalization methods for Illumina high-throughput RNA sequencing data analysis, Briefings Bioinf., 14 (2013), 671–683. http://doi.org/10.1093/bib/bbs046 doi: 10.1093/bib/bbs046
|
| [7] |
A. F. Di Narzo, S. E. Telesco, C. Brodmerkel, C. Argmann, L. A. Peters, K. Li, et al., High-throughput characterization of blood serum proteomics of IBD patients with respect to aging and genetic factors, PLoS Genet., 13 (2017). http://doi.org/10.1371/journal.pgen.1006565 doi: 10.1371/journal.pgen.1006565
|
| [8] |
J. Zhang, X. Wang, L. Xu, Z. Zhang, F. Wang, X. Tang, Investigation of potential genetic biomarkers and molecular mechanism of ulcerative colitis utilizing bioinformatics analysis, Biomed. Res. Int., 2020 (2020). http://doi.org/10.1155/2020/4921387 doi: 10.1155/2020/4921387
|
| [9] |
L. Shi, X. Han, J. X. Li, Y. T. Liao, F. S. Kou, Z. B. Wang, et al., Identification of differentially expressed genes in ulcerative colitis and verification in a colitis mouse model by bioinformatics analyses, World J. Gastroenterol., 26 (2020), 5983–5996. http://doi.org/10.3748/wjg.v26.i39.5983 doi: 10.3748/wjg.v26.i39.5983
|
| [10] |
T. Barrett, D. B. Troup, S. E. Wilhite, P. Ledoux, D. Rudnev, C. Evangelista, et al., NCBI GEO: mining tens of millions of expression profiles--database and tools update, Nucleic Acids Res., 35 (2007), 760–765. http://doi.org/10.1093/nar/gkl887 doi: 10.1093/nar/gkl887
|
| [11] |
B. Verstockt, B. Bressler, H. Martinez-Lozano, D. McGovern, M. S. Silverberg, Time to revisit disease classification in inflammatory bowel disease: Is the current classification of inflammatory bowel disease good enough for optimal clinical management, Gastroenterology, 162 (2022), 1370–1382. http://doi.org/10.1053/j.gastro.2021.12.246 doi: 10.1053/j.gastro.2021.12.246
|
| [12] |
N. Cleveland, J. Torres, D. T. Rubin, What does disease progression look like in ulcerative colitis, and how might it be prevented, Gastroenterology, 162 (2022), 1396–1408. http://doi.org/10.1053/j.gastro.2022.01.023 doi: 10.1053/j.gastro.2022.01.023
|
| [13] |
J. P. Taylor, H. M. Tse, The role of NADPH oxidases in infectious and inflammatory diseases, Redox Biol., 48 (2021), 102159. http://doi.org/10.1016/j.redox.2021.102159 doi: 10.1016/j.redox.2021.102159
|
| [14] |
H. Grasberger, J. Gao, H. Nagao-Kitamoto, S. Kitamoto, M. Zhang, N. Kamada, et al., Increased expression of DUOX2 is an epithelial response to mucosal dysbiosis required for immune homeostasis in mouse intestine, Gastroenterology, 149 (2015), 1849–1859. http://doi.org/10.1053/j.gastro.2015.07.062 doi: 10.1053/j.gastro.2015.07.062
|
| [15] |
H. Müller, A. Schmiedl, C. Weiss, M. Ai, S. Jung, M. Renner, DMBT1 is upregulated in lung epithelial cells after hypoxia and changes surfactant ultrastructure, Pediatr. Pulmonol., 55 (2020), 2964–2969. http://doi.org/10.1002/ppul.25018 doi: 10.1002/ppul.25018
|
| [16] |
A. Nexoe, A. Pedersen, S. von Huth, S. Detlefsen, P. L. Hansen, U. Holmskov, Immunohistochemical localization of deleted in malignant brain tumors 1 in normal human tissues, J. Histochem. Cytochem., 68 (2020), 377–387. http://doi.org/10.1369/0022155420927109 doi: 10.1369/0022155420927109
|
| [17] |
H. Sezutsu, G. Le Goff, R. Feyereisen, Origins of P450 diversity, Phil. Trans. R. Soc. B, 368 (2013). http://doi.org/10.1098/rstb.2012.0428 doi: 10.1098/rstb.2012.0428
|
| [18] |
T. Q. Tran, C. Kioussi, Pitx genes in development and disease, Cell. Mol. Life Sci., 78 (2021), 4921–4938. http://doi.org/10.1007/s00018-021-03833-7 doi: 10.1007/s00018-021-03833-7
|
| [19] |
B. D. Sanketi, N. Zuela-Sopilniak, E. Bundschuh, S. Gopal, S. Hu, J. Long, et al., Pitx2 patterns an accelerator-brake mechanical feedback through latent TGFβ to rotate the gut, Science, 377 (2022). http://doi.org/10.1126/science.abl3921 doi: 10.1126/science.abl3921
|
| [20] |
Y. Zhao, J. Zhao, M. Zhong, Q. Zhang, F. Yan, Y. Feng, et al., The expression and methylation of PITX genes is associated with the prognosis of head and neck squamous cell carcinoma, Front. Genet., 13 (2022). http://doi.org/10.3389/fgene.2022.982241 doi: 10.3389/fgene.2022.982241
|
| [21] |
A. Semaan, B. Uhl, V. Branchi, P. Lingohr, F. Bootz, G. Kristiansen, et al., Significance of PITX2 promoter methylation in colorectal carcinoma prognosis, Clin. Colorectal Cancer Gastrointest. Malig., 17 (2018), 385–393. http://doi.org/10.1016/j.clcc.2018.02.008 doi: 10.1016/j.clcc.2018.02.008
|
| [22] |
J. Wehkamp, J. Harder, M. Weichenthal, O. Mueller, K. R. Herrlinger, K. Fellermann, et al., Inducible and constitutive beta-defensins are differentially expressed in Crohn's disease and ulcerative colitis, Inflammatory Bowel Dis., 9 (2003), 215–223. http://doi.org/10.1097/00054725-200307000-00001 doi: 10.1097/00054725-200307000-00001
|
| [23] |
G. Barbara, M. R. Barbaro, D. Fuschi, M. Palombo, F. Falangone, C. Cremon, et al., Inflammatory and microbiota-related regulation of the intestinal epithelial barrier, Front. Nutr., 8 (2021). http://doi.org/10.3389/fnut.2021.718356 doi: 10.3389/fnut.2021.718356
|
| [24] |
C. Ohnmacht, J. H. Park, S. Cording, J. B. Wing, K. Atarashi, Y. Obata, et al., The microbiota regulates type 2 immunity through RORγt⁺ T cells, Science, 349 (2015), 989–993. http://doi.org/10.1126/science.aac4263 doi: 10.1126/science.aac4263
|
| [25] |
F. Heller, P. Florian, C. Bojarski, J. Richter, M. Christ, B. Hillenbrand, et al., Interleukin-13 is the key effector Th2 cytokine in ulcerative colitis that affects epithelial tight junctions, apoptosis, and cell restitution, Gastroenterology, 129 (2005), 550–564. http://doi.org/10.1016/j.gastro.2005.05.002 doi: 10.1016/j.gastro.2005.05.002
|
| [26] |
N. Kulkarni, H. T. Meitei, S. A. Sonar, P. K. Sharma, V. R. Mujeeb, S. Srivastava, et al., CCR6 signaling inhibits suppressor function of induced-Treg during gut inflammation, J. Autoimmun., 88 (2018), 121–130. http://doi.org/10.1016/j.jaut.2017.10.013 doi: 10.1016/j.jaut.2017.10.013
|
| [27] |
N. Narula, E. Wong, J. F. Colombel, R. Riddell, J. K. Marshall, W. Reinisch, et al., Early change in epithelial neutrophilic infiltrate predicts long-term response to biologics in ulcerative colitis, Clin. Gastroenterol. Hepatol., 20 (2022), 1095–1104. http://doi.org/10.1016/j.cgh.2021.07.005 doi: 10.1016/j.cgh.2021.07.005
|
| [28] |
V. Bittencourt, F. Jones, M. Tosetto, G. A. Doherty, E. J. Ryan, Dysregulation of metabolic pathways in circulating natural killer cells isolated from inflammatory bowel disease patients, J. Crohn's Colitis, 15 (2021), 1316–1325. http://doi.org/10.1093/ecco-jcc/jjab014 doi: 10.1093/ecco-jcc/jjab014
|
| [29] |
C. Smids, C. S. Horjus-Talabur Horje, J. Drylewicz, B. Roosenboom, M. Groenen, E. van Koolwijk, et al., Intestinal T cell profiling in inflammatory bowel disease: Linking T cell subsets to disease activity and disease course, J. Crohn's Colitis, 12 (2018), 465–475. http://doi.org/10.1093/ecco-jcc/jjx160 doi: 10.1093/ecco-jcc/jjx160
|
| [30] |
D. Corridoni, A. Antanaviciute, T. Gupta, D. Fawkner-Corbett, A. Aulicino, M. Jagielowicz, et al., Single-cell atlas of colonic CD8 (+) T cells in ulcerative colitis, Nat. Med., 26 (2020), 1480–1490. http://doi.org/10.1038/s41591-020-1003-4 doi: 10.1038/s41591-020-1003-4
|
| [31] |
M. Raithel, S. Winterkamp, A. Pacurar, P. Ulrich, J. Hochberger, E. G. Hahn, Release of mast cell tryptase from human colorectal mucosa in inflammatory bowel disease, Scand. J. Gastroenterol., 36 (2001), 174–179. https://doi.org/10.1080/00365520119214 doi: 10.1080/00365520119214
|
| [32] |
E. Chen, L. S. Chuang, M. Giri, N. Villaverde, N. Y. Hsu, K. Sabic, et al., Inflamed ulcerative colitis regions associated with MRGPRX2-Mediated mast cell degranulation and cell activation modules, defining a new therapeutic target, Gastroenterology, 160 (2021), 1709–1724. http://doi.org/10.1053/j.gastro.2020.12.076 doi: 10.1053/j.gastro.2020.12.076
|
| [33] |
W. Ip, N. Hoshi, D. S. Shouval, S. Snapper, R. Medzhitov, Anti-inflammatory effect of IL-10 mediated by metabolic reprogramming of macrophages, Science, 356 (2017), 513–519. http://doi.org/10.1126/science.aal3535 doi: 10.1126/science.aal3535
|
| [34] |
W. Wang, L. Zhang, J. Sun, Q. Zhao, J. Shuai, Predicting the potential human lncRNA-miRNA interactions based on graph convolution network with conditional random field, Briefings Bioinf., 23 (2022). http://doi.org/10.1093/bib/bbac463 doi: 10.1093/bib/bbac463
|
| [35] |
H. Liu, G. Ren, H. Chen, Q. Liu, Y. Yang, Q. Zhao, Predicting lncRNA-miRNA interactions based on logistic matrix factorization with neighborhood regularized, Knowledge-Based Syst., 191 (2020), 105261. http://doi.org/10.1016/j.knosys.2019.105261 doi: 10.1016/j.knosys.2019.105261
|
| [36] |
L. Zhang, P. Yang, H. Feng, Q. Zhao, H. Liu, Using network distance analysis to predict lncRNA-miRNA interactions, Interdiscip. Sci.: Comput. Life Sci., 13 (2021), 535–545. http://doi.org/10.1007/s12539-021-00458-z doi: 10.1007/s12539-021-00458-z
|
| [37] |
T. Wang, J. Sun, Q. Zhao, Investigating cardiotoxicity related with hERG channel blockers using molecular fingerprints and graph attention mechanism, Comput. Biol. Med., 153 (2023), 106464. http://doi.org/10.1016/j.compbiomed.2022.106464 doi: 10.1016/j.compbiomed.2022.106464
|
| [38] |
F. Sun, J. Sun, Q. Zhao, A deep learning method for predicting metabolite-disease associations via graph neural network, Briefings Bioinf., 23 (2022). http://doi.org/10.1093/bib/bbac266 doi: 10.1093/bib/bbac266
|
Figures(8)

Yuedan Wang, Jinke Huang, Jiaqi Zhang, Fengyun Wang, Xudong Tang. Identifying biomarkers associated with the diagnosis of ulcerative colitis via bioinformatics and machine learning[J]. Mathematical Biosciences and Engineering, 2023, 20(6): 10741-10756. doi: 10.3934/mbe.2023476


 DownLoad: