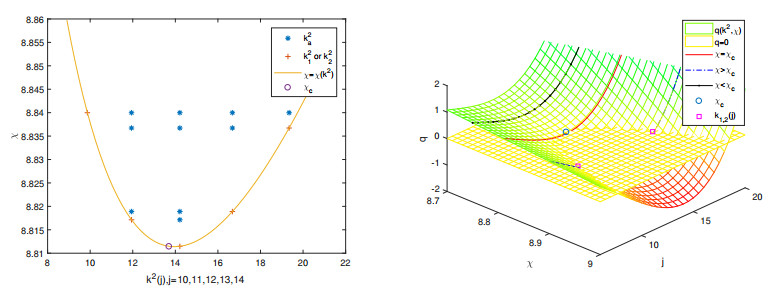
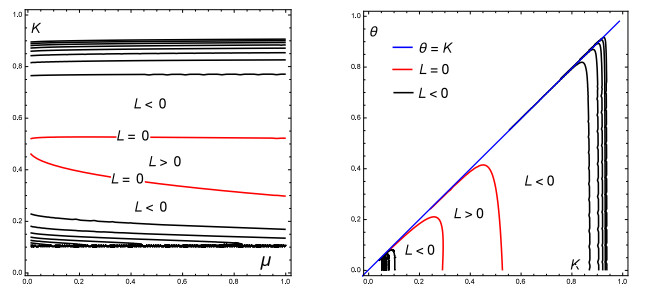
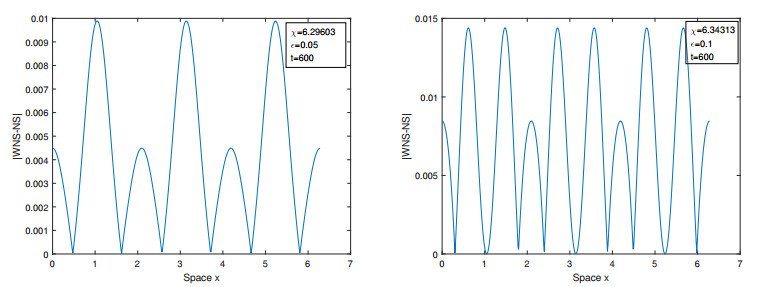
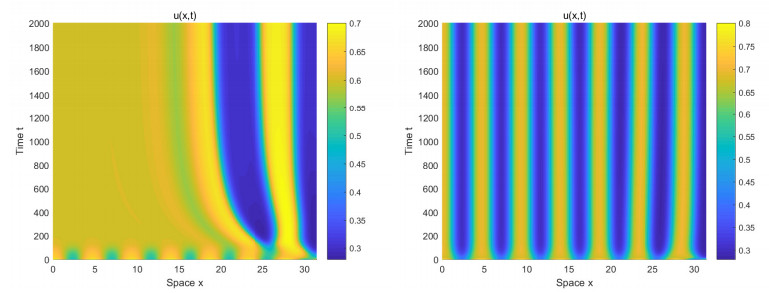
In this paper, the pattern formation of a volume-filling chemotaxis model with bistable source terms was studied. First, it was shown that self-diffusion does not induce Turing patterns, but chemotaxis-driven instability occurs. Then, the asymptotic behavior of the chemotaxis model was analyzed by weakly nonlinear analysis with the method of multiple scales. When the chemotaxis coefficient exceeded a threshold value and there was a single unstable mode, the supercritical and subcritical bifurcation of the model was discussed. The amplitude equations and the asymptotic expressions of the patterns were obtained. When the chemotaxis coefficient was large enough, the two-mode competition behavior of the model with two unstable modes was analyzed, and the corresponding amplitude equations and the asymptotic expressions of the patterns were obtained. Finally, numerical simulations were provided to further illuminate the above analytical results.
Citation: Zuojun Ma. Pattern formation of a volume-filling chemotaxis model with a bistable source[J]. AIMS Mathematics, 2024, 9(11): 30816-30837. doi: 10.3934/math.20241488
In this paper, the pattern formation of a volume-filling chemotaxis model with bistable source terms was studied. First, it was shown that self-diffusion does not induce Turing patterns, but chemotaxis-driven instability occurs. Then, the asymptotic behavior of the chemotaxis model was analyzed by weakly nonlinear analysis with the method of multiple scales. When the chemotaxis coefficient exceeded a threshold value and there was a single unstable mode, the supercritical and subcritical bifurcation of the model was discussed. The amplitude equations and the asymptotic expressions of the patterns were obtained. When the chemotaxis coefficient was large enough, the two-mode competition behavior of the model with two unstable modes was analyzed, and the corresponding amplitude equations and the asymptotic expressions of the patterns were obtained. Finally, numerical simulations were provided to further illuminate the above analytical results.

| [1] |
E. F. Keller, L. A. Segel, Initiation of slime mold aggregation viewed as an instability, J. Theor. Biol., 26 (1970), 399–415. https://doi.org/10.1016/0022-5193(70)90092-5 doi: 10.1016/0022-5193(70)90092-5

|
| [2] | E. F. Keller, L. A. Segel, Model for chemotaxis, J. Theor. Biol., 30 (1971), 225–234. https://doi.org/10.1016/0022-5193(71)90050-6 |
| [3] | D. Horstmann, From 1970 until present: the Keller-Segel model in chemotaxis and its consequences I, Jahresbericht der Deutschen Mathematiker-Vereinigung, 105 (2003), 103–165. |
| [4] |
M. Mimura, T. Tsujikawa, Aggregating pattern dynamics in a chemotaxis modeling includeing growth, Physica A, 230 (1996), 499–549. http://doi.org/10.1016/0378-4371(96)00051-9 doi: 10.1016/0378-4371(96)00051-9
|
| [5] |
T. Hillen, K. J. Painter, Global existence for a parabolic chemotaxis model with prevention of overcrowding, Adv. Appl. Math., 26 (2001), 280–301. http://doi.org/10.1006/aama.2001.0721 doi: 10.1006/aama.2001.0721
|
| [6] | K. J. Painter, T. Hillen, Voluming-filling and quorum-sensing in models for chemosensitive movement, Canadian Applied Mathematics Quarterly, 10 (2002), 501–543. |
| [7] |
T. Hillen, K. J. Painter, A user's guide to PDE models for chemotaxis, J. Math. Biol., 58 (2009), 183–217. https://doi.org/10.1007/s00285-008-0201-3 doi: 10.1007/s00285-008-0201-3
|
| [8] |
Z. A. Wang, T. Hillen, Classical solutions and pattern formation for a volume filling chemotaxis model, Chaos, 17 (2007), 037108. https://doi.org/10.1063/1.2766864 doi: 10.1063/1.2766864
|
| [9] |
J. Jiang, Y. Y. Zhang, On converge to equilibria for a chemotaxis model with volume-filling effect, Asymptotic Anal., 65 (2009), 79–102. https://doi.org/10.3233/asy-2009-0948 doi: 10.3233/asy-2009-0948
|
| [10] |
C. H. Ou, W. Yuan, Traveling wavefronts in a volume-filling chemotaxis model, SIAM. J. Appl. Dyn. Syst., 8 (2009), 390–416. http://doi.org/10.1137/08072797X doi: 10.1137/08072797X
|
| [11] |
M. J. Ma, C. H. Ou, Z. A. Wang, Stationary solutions of a volume-filling chemotaxis model with logistic growth and their stability, SIAM. J. Appl. Math., 72 (2012), 740–766. http://doi.org/10.1137/110843964 doi: 10.1137/110843964
|
| [12] |
X. F. Wang, Q. Xu, Spiky and transition layer steady states of chemotaxis systems via global bifurcation and Helly's compactness theorem, J. Math. Biol., 66 (2013), 1241–1266. http://doi.org/10.1007/s00285-012-0533-x doi: 10.1007/s00285-012-0533-x
|
| [13] |
M. J. Ma, Z. A. Wang, Global bifurcation and stablility of steady states for a reaction-diffusion-chemotaxis model with volume-filling effect, Nonlinearity, 28 (2015), 2639–2660. http://doi.org/10.1088/0951-7715/28/8/2639 doi: 10.1088/0951-7715/28/8/2639
|
| [14] |
M. J. Ma, Z. A. Wang, Patterns in a generalized volume-filling chemotaxis model with cell proliferation, Anal. Appl., 15 (2017), 83–106. http://doi.org/10.1142/s0219530515500220 doi: 10.1142/s0219530515500220
|
| [15] |
M. J. Ma, M. Y. Gao, C. P. Tong, Y. Z. Han, Chemotaxis-driven pattern formation for a reaction-diffusion-chemotaixs model with volume-filling effect, Comput. Math. Appl., 72 (2016), 1320–1340. http://doi.org/10.1016/j.camwa.2016.06.039 doi: 10.1016/j.camwa.2016.06.039
|
| [16] |
Y. Z. Han, Z. F. Li, J. C. Tao, M. J. Ma, Pattern formation for a volume-filling chemotaxis model with logistic growth, J. Math. Anal. Appl., 418 (2017), 885–907. http://doi.org/10.1016/j.jmaa.2016.11.040 doi: 10.1016/j.jmaa.2016.11.040
|
| [17] |
M. J. Ma, M. Y. Gao, R. Carretero-Gonzalez, Pattern formation for a two-dimensional reaction-diffusion model with chemotaxis, J. Math. Anal. Appl., 475 (2019), 1883–1909. http://doi.org/10.1016/j.jmaa.2019.03.060 doi: 10.1016/j.jmaa.2019.03.060
|
| [18] | S. Lynch, Dynamical systems with applications using Maple$^TM$, Boston, MA: Birkhäuser, 2010. https://doi.org/10.1007/978-0-8176-4605-9 |

Figures(8)

Zuojun Ma. Pattern formation of a volume-filling chemotaxis model with a bistable source[J]. AIMS Mathematics, 2024, 9(11): 30816-30837. doi: 10.3934/math.20241488


 DownLoad: