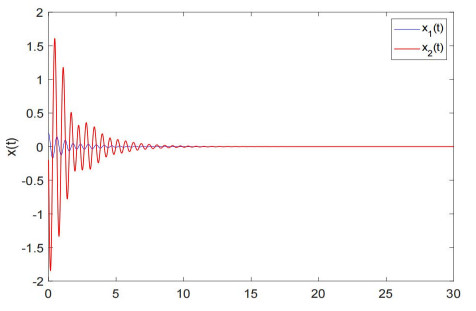
This paper researches the problem of stability analysis for distributed time-delay systems. A newly augmented Lyapunov-Krasovskii functional (LKF) is first introduced via a generalized delay partitioning approach. Then, a less conservative stability criterion is derived by introducing a novel Jensen inequality to estimate the integral terms in the derivative of LKF. The stability condition is given in terms of linear matrix inequality. Finally, the merits of the obtained stability criterion is shown by a well-known example.
Citation: Zerong Ren, Junkang Tian. Improved stability criterion for distributed time-delay systems via a generalized delay partitioning approach[J]. AIMS Mathematics, 2022, 7(7): 13402-13409. doi: 10.3934/math.2022740
This paper researches the problem of stability analysis for distributed time-delay systems. A newly augmented Lyapunov-Krasovskii functional (LKF) is first introduced via a generalized delay partitioning approach. Then, a less conservative stability criterion is derived by introducing a novel Jensen inequality to estimate the integral terms in the derivative of LKF. The stability condition is given in terms of linear matrix inequality. Finally, the merits of the obtained stability criterion is shown by a well-known example.

| [1] |
L. Jin, C. K. Zhang, Y. He, L. Jiang, M. Wu, Delay-dependent stability analysis of multi-area load frequency control with enhanced accuracy and computation efficiency, IEEE Trans. Power Syst., 34 (2019), 3687–3696. https://doi.org/10.1109/TPWRS.2019.2902373 doi: 10.1109/TPWRS.2019.2902373

|
| [2] |
C. K. Zhang, Y. He, L. Jiang, M. Wu, H. B. Zeng, Delay-variation-dependent stability of delayed discrete-time systems, IEEE Trans. Automat. Contr., 61 (2016), 2663–2669. https://doi.org/10.1109/TAC.2015.2503047 doi: 10.1109/TAC.2015.2503047
|
| [3] |
Z. G. Feng, J. Lam, Stability and dissipativity analysis of distributed delay cellular neural networks, IEEE Trans. Neural Netw., 22 (2011), 976–981. https://doi.org/10.1109/TNN.2011.2128341 doi: 10.1109/TNN.2011.2128341
|
| [4] |
Y. He, M. Wu, J. H. She, Delay-dependent stability criteria for linear systems with multiple time delays, IEE Proc. Contr. Theory Appl., 153 (2006), 447–452. https://doi.org/10.1049/ip-cta:20045279 doi: 10.1049/ip-cta:20045279
|
| [5] |
K. Ramakrishnan, G. Ray, Improved results on delay-dependent stability of LFC systems with multiple time-delays, J. Control Autom. Electr. Syst., 26 (2015), 235–240. https://doi.org/10.1007/s40313-015-0171-9 doi: 10.1007/s40313-015-0171-9
|
| [6] |
L. M. Ding, Y. He, M. Wu, Z. M. Zhang, A novel delay partitioning method for stability analysis of interval time-varying delay systems, J. Franklin Inst., 354 (2017), 1209–1219. https://doi.org/10.1016/j.jfranklin.2016.11.022 doi: 10.1016/j.jfranklin.2016.11.022
|
| [7] |
Y. B. Huang, Y. He, J. Q. An, M. Wu, Polynomial-type Lyapunov-Krasovskii functional and Jacobi-Bessel inequality: Further results on stability analysis of time-delay systems, IEEE Trans. Automat. Contr., 66 (2021), 2905–2912. https://doi.org/10.1109/tac.2020.3013930 doi: 10.1109/tac.2020.3013930
|
| [8] |
F. Long, C. K. Zhang, L. Jiang, Y. He, M. Wu, Stability analysis of systems with time-varying delay via improved Lyapunov-Krasovskii functionals, IEEE Trans. Syst. Man Cybern. Syst., 51 (2021), 2457–2466. https://doi.org/10.1109/tsmc.2019.2914367 doi: 10.1109/tsmc.2019.2914367
|
| [9] |
Y. He, Q. G. Wang, C. Lin, M. Wu, Augmented Lyapunov functional and delay-dependent stability criteria for neutral systems, Int. J. Robust Nonlinear Control, 15 (2005), 923–933. https://doi.org/10.1002/rnc.1039 doi: 10.1002/rnc.1039
|
| [10] |
X. M. Zhang, Q. L. Han, A. Seuret, F. Gouaisbaut, An improved reciprocally convex inequality and an augmented Lyapunov-Krasovskii functional for stability of linear systems with time-varying delay, Automatica, 84 (2017), 221–226. https://doi.org/10.1016/j.automatica.2017.04.048 doi: 10.1016/j.automatica.2017.04.048
|
| [11] |
T. H. Lee, J. H. Park, A novel Lyapunov functional for stability of time-varying delay systems via matrix-refined-function, Automatica, 80 (2017), 239–242. https://doi.org/10.1016/j.automatica.2017.02.004 doi: 10.1016/j.automatica.2017.02.004
|
| [12] | K. Q. Gu, V. L. Kharitonov, J. Chen, Stability of time-delay systems, Boston: Birkhäuser, 2003. https://doi.org/10.1007/978-1-4612-0039-0 |
| [13] |
L. V. Hien, H. Trinh, Refined Jensen-based inequality approach to stability analysis of time-delay systems, IET Control Theory Appl., 9 (2015), 2188–2194. https://doi.org/10.1049/iet-cta.2014.0962 doi: 10.1049/iet-cta.2014.0962
|
| [14] |
J. H. Kim, Further improvement of Jensen inequality and application to stability of time-delayed systems, Automatica, 64 (2016), 121–125. https://doi.org/10.1016/j.automatica.2015.08.025 doi: 10.1016/j.automatica.2015.08.025
|
| [15] |
A. Seuret, F. Gouaisbaut, Wirtinger-based integral inequality: Application to time-delay systems, Automatica, 49 (2013), 2860–2866. https://doi.org/10.1016/j.automatica.2013.05.030 doi: 10.1016/j.automatica.2013.05.030
|
| [16] |
O. M. Kwon, M. J. Park, J. H. Park, S. M. Lee, E. J. Cha, Improved results on stability of linear systems with time-varying delays via Wirtinger-based integral inequality, J. Franklin Inst., 351 (2014), 5386–5398. https://doi.org/10.1016/j.jfranklin.2014.09.021 doi: 10.1016/j.jfranklin.2014.09.021
|
| [17] |
H. B. Zeng, Y. He, M. Mu, J. H. She, Free-matrix-based integral inequality for stability analysis of systems with time-varying delay, IEEE Trans. Automat. Contr., 60 (2015), 2768–2772. https://doi.org/10.1109/TAC.2015.2404271 doi: 10.1109/TAC.2015.2404271
|
| [18] |
A. Seuret, F. Gouaisbaut, Stability of linear systems with time-varying delays using Bessel-Legendre inequalities, IEEE Trans. Automat. Contr., 63 (2018), 225–232. https://doi.org/10.1109/TAC.2017.2730485 doi: 10.1109/TAC.2017.2730485
|
| [19] |
P. Park, W. I. Lee, S. Y. Lee, Auxiliary function-based integral inequalities for quadratic functions and their applications to time-delay systems, J. Franklin Inst., 352 (2015), 1378–1396. https://doi.org/10.1016/j.jfranklin.2015.01.004 doi: 10.1016/j.jfranklin.2015.01.004
|
| [20] |
H. B. Zeng, Y. He, M. Wu, J. H. She, New results on stability analysis for systems with discrete distributed delay, Automatica, 60 (2015), 189–192. https://doi.org/10.1016/j.automatica.2015.07.017 doi: 10.1016/j.automatica.2015.07.017
|
| [21] |
N. Zhao, C. Lin, B. Chen, Q. G. Wang, A new double integral inequality and application to stability test for time-delay systems, Appl. Math. Lett., 65 (2017), 26–31. https://doi.org/10.1016/j.aml.2016.09.019 doi: 10.1016/j.aml.2016.09.019
|
| [22] |
J. K. Tian, Z. R. Ren, S. M. Zhong, A new integral inequality and application to stability of time-delay systems, Appl. Math. Lett., 101 (2010), 106058. https://doi.org/10.1016/j.aml.2019.106058 doi: 10.1016/j.aml.2019.106058
|
| [23] |
L. Jin, Y. He, L. Jiang, A novel integral inequality and its application to stability analysis of linear system with multiple time delays, Appl. Math. Lett., 124 (2022), 107648. https://doi.org/10.1016/j.aml.2021.107648 doi: 10.1016/j.aml.2021.107648
|
| [24] |
C. K. Zhang, Y. He, L. Jiang, M. Wu, H. B. Zeng, Stability analysis of systems with time-varying delay via relaxed integral inequalities, Syst. Control Lett., 92 (2016), 52–61. https://doi.org/10.1016/j.sysconle.2016.03.002 doi: 10.1016/j.sysconle.2016.03.002
|
| [25] |
K. Liu, A. Seuret, Y. Q. Xia, Stability analysis of systems with time-varying delays via the second-order Bessel-Legendre inequality, Automatica, 76 (2017), 138–142. https://doi.org/10.1016/j.automatica.2016.11.001 doi: 10.1016/j.automatica.2016.11.001
|
Figures(1) / Tables(1)

Zerong Ren, Junkang Tian. Improved stability criterion for distributed time-delay systems via a generalized delay partitioning approach[J]. AIMS Mathematics, 2022, 7(7): 13402-13409. doi: 10.3934/math.2022740


 DownLoad: