
End of 2019, the world has experienced a virus known as COVID-19, which almost changed everything in our daily and social lives. Every day, experts in medicine, economics, finance, and many different fields inform the community through the media or social networks about the virus, the effects, and changes in our "new life". The virus is highly transmittable and shows different mutated forms. Therefore, to describe this attractive event, many mathematical models and studies have been applied to work on the infections and transmission risks of COVID-19. However, another discussion in the community besides the virus's transmission effect isthe fear of getting infected and dying from the corona. People who have never heard about this virus before 2019 face uncertain and different information about the virus from the media, social networks, and health organizations. This paper proposes a mathematical model of FDEs with a strong Allee effect about the novel coronavirus COVID-19, including the community's fear effect spread through the media and different networks. The primary target is to emphasize the psychological pressure during and after the lockdown. Using the Routh-Hurwitz Criteria, we analyze the local stability of two critical points: disease-free and co-existing. In the end, we use MATLAB 2019 to implement simulation studies that support the theoretical findings.
Citation: Ali Yousef. A fractional-order model of COVID-19 with a strong Allee effect considering the fear effect spread by social networks to the community and the existence of the silent spreaders during the pandemic stage[J]. AIMS Mathematics, 2022, 7(6): 10052-10078. doi: 10.3934/math.2022560
[1] | Fumiaki Uchiumi, Yoko Ogino, Akira Sato, Sei-ichi Tanuma . Insights into the development of effective materials to suppress replication of severe acute respiratory syndrome coronavirus 2 (SARS-CoV-2). AIMS Bioengineering, 2020, 7(3): 124-129. doi: 10.3934/bioeng.2020012 |
[2] | Júlia Novaes Matias, Gyovanna Sorrentino dos Santos Campanari, Gabriela Achete de Souza, Vinícius Marinho Lima, Ricardo José Tofano, Claudia Rucco Penteado Detregiachi, Sandra M. Barbalho . Metabolic syndrome and COVID-19. AIMS Bioengineering, 2020, 7(4): 242-253. doi: 10.3934/bioeng.2020021 |
[3] | Kranthi Kumar Lella, Alphonse PJA . A literature review on COVID-19 disease diagnosis from respiratory sound data. AIMS Bioengineering, 2021, 8(2): 140-153. doi: 10.3934/bioeng.2021013 |
[4] | Cong Toai Truong, Kim Hieu Huynh, Van Tu Duong, Huy Hung Nguyen, Le An Pham, Tan Tien Nguyen . Model-free volume and pressure cycled control of automatic bag valve mask ventilator. AIMS Bioengineering, 2021, 8(3): 192-207. doi: 10.3934/bioeng.2021017 |
[5] | Sarbaz H. A. Khoshnaw, Azhi Sabir Mohammed . Computational simulations of the effects of social distancing interventions on the COVID-19 pandemic. AIMS Bioengineering, 2022, 9(3): 239-251. doi: 10.3934/bioeng.2022016 |
[6] | Mariem Jelassi, Kayode Oshinubi, Mustapha Rachdi, Jacques Demongeot . Epidemic dynamics on social interaction networks. AIMS Bioengineering, 2022, 9(4): 348-361. doi: 10.3934/bioeng.2022025 |
[7] | Prasantha Bharathi Dhandapani, Dumitru Baleanu, Jayakumar Thippan, Vinoth Sivakumar . On stiff, fuzzy IRD-14 day average transmission model of COVID-19 pandemic disease. AIMS Bioengineering, 2020, 7(4): 208-223. doi: 10.3934/bioeng.2020018 |
[8] | Kayode Oshinubi, Augustina Amakor, Olumuyiwa James Peter, Mustapha Rachdi, Jacques Demongeot . Approach to COVID-19 time series data using deep learning and spectral analysis methods. AIMS Bioengineering, 2022, 9(1): 1-21. doi: 10.3934/bioeng.2022001 |
[9] | Ayub Ahmed, Bashdar Salam, Mahmud Mohammad, Ali Akgül, Sarbaz H. A. Khoshnaw . Analysis coronavirus disease (COVID-19) model using numerical approaches and logistic model. AIMS Bioengineering, 2020, 7(3): 130-146. doi: 10.3934/bioeng.2020013 |
[10] | Rogério Leone Buchaim . Bioengineering applied to Covid-19 pandemic: from bench to bedside. AIMS Bioengineering, 2021, 8(1): 14-15. doi: 10.3934/bioeng.2021002 |
End of 2019, the world has experienced a virus known as COVID-19, which almost changed everything in our daily and social lives. Every day, experts in medicine, economics, finance, and many different fields inform the community through the media or social networks about the virus, the effects, and changes in our "new life". The virus is highly transmittable and shows different mutated forms. Therefore, to describe this attractive event, many mathematical models and studies have been applied to work on the infections and transmission risks of COVID-19. However, another discussion in the community besides the virus's transmission effect isthe fear of getting infected and dying from the corona. People who have never heard about this virus before 2019 face uncertain and different information about the virus from the media, social networks, and health organizations. This paper proposes a mathematical model of FDEs with a strong Allee effect about the novel coronavirus COVID-19, including the community's fear effect spread through the media and different networks. The primary target is to emphasize the psychological pressure during and after the lockdown. Using the Routh-Hurwitz Criteria, we analyze the local stability of two critical points: disease-free and co-existing. In the end, we use MATLAB 2019 to implement simulation studies that support the theoretical findings.
The Venice Lagoon, a wetland spanning approximately 550 km2, is in Northeastern Italy along the Adriatic coast. Figure 1 shows a schematized map of the Venice lagoon. The city of Venice and its islands occupy merely 8% of this area (yellow areas in Figure 1). Three inlets of different sizes and depths between the lagoon and Adriatic Sea allow tide flowing in and out. While the average water depth is about one meter, subject to tidal fluctuations, the lagoon's bottom topography is diverse, featuring tidal flats, dredged channels, and shallow regions (green, blue, and white areas in Figure 1, respectively).
The daily tidal movements within the lagoon consistently affect Venice, progressively eroding the city's fragile balance at an accelerating rate. Environmental deterioration is worsening due to the increasing frequency of flooding in the historic centre, driven by a combination of factors: rising sea levels caused by climate change, natural land subsidence, and localized anthropogenic subsidence, particularly between 1946 and 1970 (yearly distribution of tides higher than 1.1 m is reported in Simonini [1]). The widening gap between sea levels and the elevation of Venice's islands has led to a significant loss of land elevation. Since the early 20th century, the city has subsided by about 26 cm, further highlighting its vulnerability to these environmental pressures. This complex interaction of natural and human-induced factors continues to present significant challenges for the preservation and long-term sustainability of this unique urban ecosystem [2].
The delicate balance between the city, its lagoon, and the surrounding environment is under constant threat from climate change, natural land subsidence, and human-induced geological changes. To safeguard this UNESCO World Heritage site, in 1973, Italy embarked on an unprecedented journey to safeguard one of its most treasured jewels. The Special Law for Venice, a groundbreaking piece of legislation, set in motion a comprehensive strategy to protect this floating city and its surrounding lagoon from the relentless forces of nature. This plan encompasses four key pillars:
- coastal fortification: the shoreline undergoes a transformation through extensive beach nourishment programs and strategic reconfiguration of breakwaters. These measures serve as the first line of defence against coastal erosion and sea storms;
- tilting gate system: at the heart of Venice's flood protection lies the tilting gate system - a network of futuristic mobile barriers. These engineering marvels, installed at the lagoon's three entrances, stand ready to rise from the depths, creating an impenetrable wall against encroaching high tides;
- ecological renaissance: recognizing the lagoon's vital role as a living ecosystem, the plan prioritizes the rejuvenation of salt marshes and wetlands. This initiative not only preserves biodiversity but also harnesses nature's own defences against flooding;
- urban adaptation: within the city itself, a subtle yet crucial transformation is underway. Quaysides are being elevated, and public spaces in low-lying areas are being ingeniously redesigned to coexist with rising water levels.
The geological tapestry beneath Venice presents a unique challenge to these interventions. The geological and geotechnical surveys have revealed the major characteristic of the lagoon's soil composition: the predominant element is silt, intricately mixed with varying proportions of clay and sand. Despite the apparent chaos in the complex and layered soil arrangement, the fundamental mineralogical properties remain relatively consistent throughout. This uniformity is attributed to the shared geological origins and the common depositional environment of the Venetian lagoon.
Within this complex geological framework, the accurate quantification of soil stiffness parameters is crucial for developing resilient engineering solutions [3,4,5]. The heterogeneous nature of the lagoon sediments necessitates a comprehensive approach for stiffness characterization, encompassing local behaviour across stress states and loading conditions.
In this paper, a comprehensive analysis of selected test sites considered representative of lagoon subsoil stratigraphy is presented to provide a complete characterization of the principal geotechnical properties of the Venetian lagoon sediments. The tests sites, namely the Malamocco Test Site (MTS) [6,7], the Treporti Test Site (TTS) [8], and the La Grisa Test Site (LGTS) [9], are critically examined to provide (ⅰ) a general overview of the geological and geotechnical characterization and (ⅱ) insights in the estimation of the stiffness of the upper soils of the Venice lagoon.
The Venetian Plain, encompassing the Venice Lagoon at its core, is the result of complex geological processes. Sediments eroded from the ancient Alpine orogeny were transported via fluvial systems, gradually infilling the extensive basin that would eventually host one of the world's most unique urban environments.
During the Pliocene epoch, the paleogeography differed significantly from the present [1]. The sea level was substantially higher, resulting in the submergence of the Venetian Plain beneath marine waters. The Pleistocene epoch was characterized by cyclical glacial-interglacial periods. During the peak of the last Wiscontsinian glaciation, the coastline regressed approximately 200 kilometres from its current position, exposing large tract of land that is now submerged beneath the Adriatic Sea. The starting of deglaciation about 15,000 years Before Present (BP) initiated a sea advancement, until reaching a maximum between 7,000 and 5,000 years BP, with sea levels slightly surpassing those we observe today. The Venice lagoon formed during this Flandrian transgression, approximately 6,000 years BP, as seawater inundated a pre-existing freshwater basin.
Given this geological background, the subsurface stratigraphy of the Venetian lagoon exhibits remarkable complexity. The upper 100 m below mean sea level (m.s.l.) comprise a heterogeneous sequence of sands, silts, and silty clays, deposited during the tumultuous Wiscontsinian glaciations [10]. The Holocene epoch, our current geological age, has contributed to the most recent layers, forming deposits up to 15 m thick near the surface.
The mineralogical compositions of these sediments include a sand fraction dominated by carbonates, primarily a mixture of calcite and dolomite crystals, derived from distant mountains. Quartz, feldspar, muscovite, and chlorite add to this mineral mixture. The clay fraction is predominantly composed by illite, kaolinite, and chlorite, indicating the occurrence of complex weathering processes. This mineralogical assemblage reflects the sedimentary provenance and diagenetic history of the region [2].
Stratigraphic and sedimentological analyses of numerous sediment cores taken from the Pleistocene alluvial deposits have revealed a layer of overconsolidated, stiff silty clay. This layer, commonly known as "caranto" (from the Latin word: caris, meaning stone), is at depths of 3–8 m, with a maximum thickness of 2–3 m (Figure 2). The "caranto" is characterized as a paleosol composed of fine alluvial sediments with calcium carbonate nodules of biological origin. This ancient soil layer shows evidence of alteration due to exposure to air, with oxidation marks indicating fluctuations in the water table. The presence of calcareous nodules suggests calcic pedogenetic horizons (i.e., very stiff materials floating in the caranto).
Researchers have conducted radiometric and pollen analyses on samples from above, below, and within the caranto layer. These researchers have uncovered a significant stratigraphic gap spanning approximately 17,500 to 7,500 years BP, encompassing the Lateglacial period and part of the Holocene [11]. During this extended timeframe, the Venetian plain experienced a pause in sediment accumulation. As a result, the existing alluvial sediments were exposed to atmospheric conditions, leading to their alteration and the subsequent formation of a soil layer. This process has played a crucial role in shaping the unique geological characteristics of the Venice lagoon area.
The morphology of the Venice lagoon is a result of extensive human intervention and recent environmental changes. Since the 12th century, when the first Venetian settlers established themselves on the islands, major engineering efforts have focused on maintaining efficient sea-lagoon connections and preserving the city's insular nature.
To prevent the lagoon from sediment filling, Venetians undertook significant hydrological modifications, redirecting major rivers into extensive canals around the lagoon's periphery. These human-induced changes have led to a persistent decrease in sediment balance, resulting in a significant reduction of marshes and wetlands.
The MTS is at the Malamocco inlet (Figure 1) and described in detail by Cola & Simonini [2]. Within a confined area, a comprehensive suite of geotechnical investigations was conducted, including borings, piezocone tests (CPTU), dilatometer tests (DMT), self-boring pressuremeter tests (SBPM), and cross-hole tests (CHT). Additionally, a borehole was drilled to facilitate a detailed mineralogical classification of the soil.
The extensive laboratory testing program at the MTS, elaborated in Cola & Simonini [2], revealed the highly heterogeneous nature of Venice's soils. The determination of basic mechanical properties required a substantial number of tests. Moreover, the high silt content and low-structured nature of the sediments made them extremely sensitive to stress relief and disturbance during sampling leading to curves relating the void ratio to the logarithm of effective stress without any clear yielding zone except a few of more plastic samples, as pointed out by Biscontin et al. [7], thus affecting the evaluation of stress history and hindering reliable mechanical characterization of the stress-strain-time behaviour.
Figure 3 illustrates the basic soil properties as a function of depth. According to the Unified Soil Classification System (USCS), the Venetian soils were categorized into medium to fine sand (SP-SM), silt (ML), and very silty clay (CL). The key findings include:
- predominance of silty and sandy fractions, with soil classes distributed approximately as follows: 35% SP-SM, 20% ML, 40% CL, and 5% medium plasticity clays and organic soils (CH, OH, and Pt). Notably, 65% of the analysed samples contained over 50% silt.
- sands exhibited relative uniformity, while finer materials showed more gradation. The coefficient of non-uniformity (U) increased as the mean particle diameter (D50) decreased.
- Atterberg limits revealed average values of liquid limit (LL) = 36.9% and plasticity index (PI) = 14.7%.
- the in situ void ratio e0 ranged between 0.7 and 1.0 from 19 m to 36 m below m.s.l.. At greater depths, it decreased to 0.6–0.75, with higher values attributed to sediments with high organic content.
To estimate the preconsolidation stress (σ'p) and consequently the overconsolidation Ratio (OCR) on clayey silts samples the results of several oedometric tests was analysed. However, the reliability of these results was compromised by the gradual transition into the virgin compression regime, which introduced significant uncertainty in estimating the yielding stress. This uncertainty affected most samples, with only a few of the more plastic silty-clay specimens providing more dependable results.
Figure 3 illustrates a clear trend of decreasing OCR with depth, determined through the classical Casagrande's method applied to oedometric curves provided by the more plastic specimens. The upper layers exhibit higher OCR values, primarily attributed to the presence of caranto. As depth increases, the OCR values diminish, with the deeper strata showing only slight overconsolidation, typically ranging between 1.2 and 3.7.
Attempts have been made to relate soil mechanical properties to the grading characteristics of cohesionless soils. For instance, Miura et al. [12] proposed separately examining the influence of variations in D50 or U on the overall mechanical behaviour. A key characteristic of the grading of Venetian soils is the relative uniformity of sands, while finer materials exhibit greater grading and a wider range in the grain-size distribution curve. This can be observed by examining the variation of U as a function of D50: coarser materials have lower U values, and the range of U increases as D50 decreases. This trend in the grading of coarse materials is supported by fractal-based studies by McDowell & Bolton [13], who demonstrated the inverse relationship between D50 and U in crushed sands, expressed mathematically.
Based on these observations, all available D50 and U data from the MTS investigation were plotted against depth in Figure 4. Notably, despite oscillations of approximately two orders of magnitude in both quantities, the D50 and U profiles generally exhibit opposite trends with depth: As D50 decreases, U increases, and vice versa.
Given that all Venetian sediments originate from a common parent material, specifically siliceous-calcareous sand, through crushing and sedimentation, at least down to the very silty clay fraction, it was developed by Cola and Simonini [2] an improved correlation between mechanical properties and grading characteristics through a specific grain-size index, Igs, defined as:
IGS=D50/D0U | (1) |
where D0 is a reference diameter equal to 1 mm. This parameter accounts for the coupled and opposite variations of D50 and U in a single parameter. Some significant mechanical parameters, such as confined one-dimensional stiffness, have been related to IGS [2].
As far as compressional soil behaviour is concerned, Figure 5a [7] reports typical compression curves of CL, ML, and SP-SM, determined from oedometric compression tests.
The curves have been elaborated in terms of constrained stiffness M as a function of vertical effective stress σ′v [14]:
Mp′ref=C⋅(σ′vp′ref)m | (2) |
where C and m are two experimental constants and p'ref a reference stress (p'ref = 100 kPa).
Figure 5b shows the trend of M as a function of σ′v/p′ref for SM-SP, ML and CL materials. The parameters C, m fitting the data for the three classes of soil are C = 300, m = 0.34 for SM-SP, C = 90, m = 0.54 for ML and C = 10, m = 0.95 for CL, respectively.
The experimental constants C and m were related to IGS through the following equations:
C = (270±30)+ 56⋅logIGS | (3) |
m = (0.30±0.10)−0.07⋅logIGS | (4) |
Given its (indirect) dependency with soil stiffness, IGS may represent a valid parameter to be used when characterizing other highly heterogeneous soil layers with the same mineralogical origin. In the following, it will be used to calculate the stiffness of different soil layers in the lagoon. The calculated values will be validated against the stiffness values deducted from other test sites measurements in the lagoon.
To investigate the site mechanical properties, an extensive research program was conducted from 2002 to 2008 [8,15,16]. The object of this study was a large-scale site load test involving the construction and subsequent removal of a full-scale, earth-reinforced cylindrical embankment on a typical lagoon soil profile. The project encompassed several stages, beginning with thorough site and laboratory investigations, and the installation of a sophisticated monitoring system. This was followed by the embankment's construction, accompanied by continuous monitoring of ground displacements and pore pressure variations. The observation period extended for nearly four years after the embankment's completion, culminating in its staged removal while closely tracking ground displacements during unloading.
The test site was strategically located near the village of Treporti in the northeastern part of the Venetian lagoon (Figure 1). This location was chosen for its soil profile, representative of the broader lagoon area. The TTS was investigated through boreholes and geotechnical laboratory testing as well as through piezocone tests CPTU [17] and dilatometer tests (DMT) [18] including some true-interval seismic testing installed on CTPU/DMT pushing bars.
Basic soil properties determined from laboratory tests are depicted on Figure 6. Features to note are:
- the distribution of soil types extends up to approximately 60 m, with the following proportions: SM-SP 22%, ML 32%, CL 37%, and CH-Pt 9%;
- the sands in both the upper and deeper layers are relatively uniform, while the finer materials exhibit more variation. The coarser the materials, the lower the coefficient of uniformity (U) with IGS values falling within the same range observed at MTS (see Figure 4).
- with the exception of organic soils, the Atterberg limits of the cohesive fraction are similar to those determined at MTS.
- the saturated unit weight (γsat) shows significant fluctuations with depth and is somewhat lower than the values measured at MTS. The void ratio (e0) is slightly higher, ranging approximately from 0.8 to 1.1, with higher values corresponding to layers containing organic material laminations.
As far as primary loading and unloading-reloading (Cc, Cr), secondary compression (Cαε) indexes, and vertical and horizontal consolidation coefficients (cv, ch) are concerned, Figure 7 depicts the determinations provided by the laboratory test and in-situ tests.
The relevant variation with depth of the coefficient of consolidation (several orders of magnitude) is characterized by much higher ch with respect to cv. The estimate of ch from CPTU and DMT dissipation tests prove once more the relevant soil heterogeneity and the very high capacity of draining water of these silty soils.
The TTS was equipped with a comprehensive instrumentation system to monitor key geotechnical parameters. This setup included devices for measuring surface vertical displacements, such as settlement plates, benchmarks, and a GPS receiver at the embankment's centre. Deep vertical displacements were tracked using borehole rod extensometers, while vertical strains along four verticals were measured with special multiple micrometres. Horizontal displacements were monitored via inclinometers. To assess pore water pressure in fine-grained soils, both Casagrande and vibrating wire piezometers were employed. This extensive array of instruments enabled a thorough and continuous assessment of soil behaviour throughout the study, providing valuable data on the complex interactions between the embankment and the underlying the lagoon soil. A cross section of the soil profile and monitoring system is given in Figure 8.
The bank construction began in September, 2002 and was completed in March, 2003. It was realized using 13 geogrid-reinforced sand layers reaching a total height of 6.5 m. The vertical stress transmitted to the soil was 106 kPa. It was removed in April, 2008 and monitoring was continued to the end of 2009. The final outcome of the sand bank is provided in Figure 9.
The subsoil's high drainage capacity, clearly shown in Figure 7, led to rapid primary consolidation, occurring simultaneously with embankment construction. Piezometer readings showed that pore pressure variations were primarily influenced by daily tidal fluctuations in the adjacent channel rather than the increasing bank load. The rapid dissipation of excess pore pressures indicates a highly permeable soil structure, which is crucial for accurate settlement predictions and stability assessments in the Venetian lagoon environment.
Sliding Deformeter (SD) n. 3 (S3, along with S1, S2, and S4) measured local vertical strains in 1 m thick layers throughout the loading-unloading sequence. Figure 10 shows the progression of vertical displacement measured at the centre of the embankment using S3 and the GPS. The total settlement upon completion of the embankment was 38.1 cm, followed by an additional 12.4 cm of settlement under constant load, resulting in a total of 50.5 cm. After the embankment was removed, a settlement recovery of less than 3.0 cm was observed, which highlights the significant irrecoverable strain that occurs during the compression of these silty-based soils. Maximum horizontal displacements below the bank perimeter (about 50 mm) were an order of magnitude lower than maximum vertical settlements during construction, indicating predominantly vertical deformation. This approached a one-dimensional compression condition beneath the bank centre.
Figures 11a and 11b illustrate the local and total vertical strains with depth, highlighting significant contributions from the thin silty clay layer at ≈1–2 m depth and the silt layer between 8 and 20 m. Strain decreased with depth, becoming negligible below 35 m.
Figure 12 presents typical field compression curves, plotting vertical strain, εv, against estimated vertical stress increments for each 1 m layer measured by S3. The curves reveal stiffer soil behaviour at initial stress increments, followed by a softer response beyond a threshold stress, more pronounced in silt than in sand. Post-construction, the deformation process exhibited significant creep, followed by a very stiff unloading response. Creep behaviour was deeply investigated; in addition to the estimate from laboratory tests shown in Figure 7, the field trial provided a deeper insight on secondary compression, as discussed in detail by Tonni and Simonini [17] and Tonni et al. [19].
This analysis provided crucial insights into the complex mechanical behaviour of Venetian lagoon soils under varying load conditions, essential for accurate geotechnical modelling and design in this unique environment. Since the strain in the ground developed primarily in the vertical direction, the curves shown in Figure 12 were interpreted as field large odometer (with a thickness of 1 m) curves, with the threshold stress considered to be the preconsolidation stress. However, as mentioned, these field large odometers are not true odometers, since the stress paths during loading cross above and below the one-dimensional compression condition. This data enabled the estimation of OCR by comparing this site preconsolidation stress σ'vy with the vertical effective one σ'v0. The soils had OCR values ranging from 1.5 to 2.5 for the Holocenic soils and less than 1.3 for the Pleistocene ones.
The SD settlement measurements enabled the estimation of key mechanical soil properties, circumventing both scale effects and stress relief issues associated with sampling. This approach was particularly valuable for assessing the mechanical response of silts, which are notably sensitive to disturbance. Additionally, it enabled for the direct measurement of sand stiffness, a parameter often challenging to accurately determine through conventional laboratory testing. In-situ data from full-scale loading provided more representative and reliable soil characterization, enhancing the accuracy of geotechnical analyses for the complex Venetian lagoon subsoil.
In fact, in situ normalized stiffness (M/σ'v)site, being M = (Δσ'v/Δεv) site, was plotted by Simonini et al. [2] for the central S3 against the normalized against the current vertical stress (σ'v/σ'vy)site induced by the increasing embankment load. Figure 13 focuses on the silty layer, which contributed most significantly to total settlement. A sharp variation in the (M/σ'v)site trend is evident at the preconsolidation stress, delineating overconsolidated (OC) and normally consolidated (NC) behaviour. These field data are compared with normalized constrained modulus (M/σ'v)lab from laboratory odometric tests. Notably, field data intersect the laboratory trend, showing significantly higher stiffness before yielding stress and lower values beyond (σ'v/σ'vy)lab. This discrepancy likely stems from disturbance and stress relief during sampling, highlighting the value of in-situ measurements for accurate soil characterization in the Venetian lagoon context.
Given the accuracy of in situ measurements from the TTS, the method developed for MTS by Cola and Simonini [2] is applied to TTS and the results compared against initial tangent stiffness (Mi‑site) and secant stiffness at maximum load (Msec-max load) calculated from the measurements reported in Figure 12.
To validate the methodology developed for evaluating soil stiffness at MTS, Equations (2), (3) and (4) are used to estimate one-dimensional stiffness using the grain size index IGS also for the TTS. Stiffness is calculated for all layers, and the comparison between field-derived and calculated values demonstrates a satisfactory agreement with field-derived secant stiffness at maximum load (Figure 14).
To investigate the consolidation processes and stiffness characteristics of natural salt marshes, experimental tests were conducted at the La Grisa salt marsh test site [9]. The test site is in the southern part of the lagoon as shown in Figure 1; a plan view of the testing system is provided in Figure 15.
We utilized eight 500-liter polyethylene tanks arranged in two rows on the marsh surface. These tanks, placed on reinforced geotextile and wooden pallets, were filled with seawater from a nearby lagoon canal. The setup ensured uniform load distribution and minimized buoyancy effects during high tides. The total load of 40 kN, spread over 4.0 m², enabled the assumption of nearly one-dimensional strain conditions in the central area. This configuration accounted for local heterogeneities in marsh deposits, including effects of halophytic vegetation.
A monitoring system measured vertical displacements and groundwater pore-pressure at various depths and locations. Five sensors were strategically placed (Figure 16): Three at the load centre (C0 at surface, C10 at 0.1 m, and C50 at 0.5 m depth), one at the edge, and one at an intermediate position. The other two were inserted into the soil at the edge of the loaded area (E10) and in an intermediate position (M10) at 0.1 m depth. This arrangement captured the soil deformation profile, with maximum values expected at the centre. A local benchmark network provided independent verification of surface movements.
The soil below the tanks, reported in Figure 17, is characterized by the presence of a sequence of upper silty deposits passing upward to organic clays, intermediate alternating yellowish and greyish sandy to silty deposits and deeper deposits formed by clay, peaty clay, and peat with reed and shell fragments. Grain size distributions are in the range of those typical of the lagoon silts. The shallowest part is characterized by an increasing organic content.
Figure 18 illustrates the loading sequence and vertical displacements recorded by various sensors. The initial loading phase of 5.6 kPa, maintained for 24 hours, resulted in a maximum surface settlement of 10.2 mm at C0 and 1.1 mm at C50. After unloading, a clear rebound was observed. Following a 24-hour zero-load period, the load was increased to 11.3 kPa for 72 hours. This led to further settlements, with C0 recording a total of 32 mm and C10 measuring 18 mm from the experiment's start. It is important to note that the measurements from C0, the shallowest sensor, may be disturbed by the presence of organic materials and vegetation. Accounting for this, the stiffness values calculated for the uppermost 10 cm of soil, may be larger than that at long term.
On the basis of the above measurements and assuming nearly vertical deformation along the centreline below the tanks, it is possible to calculate the vertical secant stiffness in the soil from the surface down to 0.50 m for the loading increment from 0.0 to 5.6 kPa and from 5.6 to 11.3 kPa. The results of the calculation are plotted in Figure 19, together with the stiffness evaluated from traditional odometric tests, performed for three samples taken at depths of 0.20, 0.65, and 0.80 m.
For the sake of comparison, an evaluation of M using equations (2), (3), and (4) is reported on the same graph. It is interesting to note that, also for this test site, the stiffness calculation using the grain size index IGS is relatively good. Moreover, it can be noted that range of stiffness measured using the odometric cell (dotted area in Figure 19) is well above the measured via the field tests. This could be due to the effect of friction at the interface soil-steel circular ring of the odometer cell, that may lead to a stiffer vertical response at very low stress levels.
These results demonstrate that, notwithstanding the stratigraphic variations and differing in situ test regimes, the methodology developed for the MTS exhibits applicability to the LGTS due to the shared geological characteristics of the soil.
The study reveals that Venetian subsoil primarily consists of non-plastic silt irregularly mixed with clay and sand. This soil, derived from the degradation of original sands, interacts mainly through mechanical than electrochemical forces. Venetian clays, except for some surface organic layers, are low-activity materials predominantly mixed with silt and sand. This characteristic has enabled a unified approach to describe its mechanical behaviour, enabling approximate estimates of properties like one-dimensional stiffness based on grain size distribution.
The experimental sites at Malamocco, Treporti, and La Grisa provided a unique opportunity to understand these poorly structured soils, highly sensitive to stress relief during sampling. Accurate assessments of current stiffness, which is crucial for estimating settlements in heterogeneous soil profiles, were possible only through large-scale load tests at Treporti and La Grisa (for low stress level). These tests were essential for a precise mechanical characterization of the highly heterogeneous Venetian silts and in establishing and validating a common simplified methodology to calculate soil stiffness.
The authors declare they have not used Artificial Intelligence (AI) tools in the creation of this article.
The authors would like to thank the Magistrato alle Acque Venezia and Consorzio Venezia Nuova for providing economical funding to study Venetian soils through the Malamocco and Treporti Test Sites.
The authors declare no conflict of interest.
[1] | A. R. Fehr, S. Perlman, Coronaviruses: an overview of their replication and pathogenesis, In: Coronaviruses, New York, NY: Humana Press, 1–23. https://doi.org/10.1007/978-1-4939-2438-7_1 |
[2] |
P. C. Woo, S. K. Lau, Y. Huang, K. Y. Yuen, Coronavirus diversity, phylogeny, interspecies jumping, Exp. Biol. Med. (Maywood), 234 (2009), 1117–1127. https://doi.org/10.3181/0903-MR-94 doi: 10.3181/0903-MR-94
![]() |
[3] |
S. Su, G. Wong, W. Shi, J. Liu, A. C. K. Lai, J. Zhou, et al., Epidemiology, genetic recombination, and pathogenesis of Coronaviruses, Trends Microbiol., 24 (2016), 490–502. https://doi.org/10.1016/j.tim.2016.03.003 doi: 10.1016/j.tim.2016.03.003
![]() |
[4] |
D. Forni, R. Cagliari, M. Clerici, M. Sironi, Molecular evolution of human coronavirus genomes, Trends Microbiol., 25 (2017), 35–48. https://doi.org/10.1016/j.tim.2016.09.001 doi: 10.1016/j.tim.2016.09.001
![]() |
[5] |
N. Al-Asuoad, L. Rong, S. Alaswad, M. Shiller, Mathematical model and simulations of MERS outbreak: predictions and implications for control measures, Biomath, 5 (2016), 1612141. http://doi.org/10.11145/j.biomath.2016.12.141 doi: 10.11145/j.biomath.2016.12.141
![]() |
[6] |
N. Masood, S. S. Malik, M. N. Raja, S. Mubarik, C. Yu, Unraveling the epidemiology, geographical distribution, and genomic evolution of potentially lethal coronaviruses (SARS, MERS, and SARS CoV-2), Front. Cell. Infect. Microbiol., 10 (2020), 499. https://doi.org/10.3389/fcimb.2020.00499 doi: 10.3389/fcimb.2020.00499
![]() |
[7] |
S. Krishnamoorthy, B. Swain, R. S. Verma, S. S. Gunthe, SARS-CoV, MERS-CoV, and 2019-nCoV viruses: an overview of origin, evolution, and genetic variations, VirusDis., 31 (2020), 411–423. https://doi.org/10.1007/s13337-020-00632-9 doi: 10.1007/s13337-020-00632-9
![]() |
[8] |
A. Bawazir, N. Yenugachati, O. B. Da'ar, H. Jradi, Epidemiological trends, characteristics, and distribution of COVID-19: lessons from SARS and MERS outbreaks and way forward, J. Infect. Dis. Epidemiol., 6 (2020), 127. https://doi.org/10.23937/2474-3658/1510127 doi: 10.23937/2474-3658/1510127
![]() |
[9] |
F. Wu, S. Zhao, B. Yu, Y.-M. Chen, W. Wang, Z.-G. Song, et al., A new coronavirus associated with human respiratory disease in China, Nature, 579 (2020), 265–269. https://doi.org/10.1038/s41586-020-2008-3 doi: 10.1038/s41586-020-2008-3
![]() |
[10] | World Health Organization, Novel Coronavirus (2019-nCoV) Situation Reports. Available from: https://www.who.int/emergencies/diseases/novel-coronavirus-2019/situation-reports/. |
[11] |
G. Bonaccorsi, F. Pierri, M. Cinelli, A. Flori, A. Galeazzi, F. Porcelli, et al., Economic and social consequences of human mobility restrictions under COVID-19, PNAS, 117 (2020), 15530–15535. https://doi.org/10.1073/pnas.2007658117 doi: 10.1073/pnas.2007658117
![]() |
[12] |
S. K. Samal, Population dynamics with multiple Allee effects induced by fear factors — A mathematical study on prey-predator interactions, Appl. Math. Model., 64 (2018), 1–14. https://doi.org/10.1016/j.apm.2018.07.021 doi: 10.1016/j.apm.2018.07.021
![]() |
[13] |
M. Di Giuseppe, S. Zilcha-Mano, T. A. Prout, J. C. Perry, G. Orrù, C. Conversano, Psychological impact of Coronavirus Disease 2019 among Italians during the first week of lockdown, Front. Psychiatry, 11 (2020), 576597. https://doi.org/10.3389/fpsyt.2020.576597 doi: 10.3389/fpsyt.2020.576597
![]() |
[14] |
M. Luo, L. Guo, M. Yu, W. Jiang, H. Wang, The psychological and mental impact of Coronavirus Disease 2019 (COVID-19) on medical staff and the general public — A systematic review and meta-analysis, Psychiatry Res., 291 (2020), 113190. https://doi.org/10.1016/j.psychres.2020.113190 doi: 10.1016/j.psychres.2020.113190
![]() |
[15] |
Y. Wang, S. Ma, C. Yang, Z. Cai, S. Hu, B. Zhang, et al., Acute psychological effects of Coronavirus Disease 2019 outbreak among healthcare workers in China: a cross-sectional study, Transl. Psychiatry, 10 (2020), 348. https://doi.org/10.1038/s41398-020-01031-w doi: 10.1038/s41398-020-01031-w
![]() |
[16] |
N. Umm Min Allah, S. Arshad, H. Mahmood, H. Abbas, The psychological impact of coronavirus outbreak in Pakistan, Asia-Pac. Psychiatry, 12 (2020), e12409. https://doi.org/10.1111/appy.12409 doi: 10.1111/appy.12409
![]() |
[17] |
X. Liu, D. Xiao, Complex dynamic behaviors of a discrete-time predator-prey system, Chaos Solution. Fract., 32 (2007), 80–94. https://doi.org/10.1016/j.chaos.2005.10.081 doi: 10.1016/j.chaos.2005.10.081
![]() |
[18] |
F. Bozkurt, A. Yousef, T. Abdeljawad, Analysis of the outbreak of the novel coronavirus Covid-19 dynamic model with control mechanisms, Results Phys., 19 (2020), 103586. https://doi.org/10.1016/j.rinp.2020.103586 doi: 10.1016/j.rinp.2020.103586
![]() |
[19] |
Y. Huang, Z. Zhu, Z. Li, Modeling the Allee effect and fear effect in a predator-prey system incorporating a prey refuge, Adv. Differ. Equ., 2020 (2020), 321. https://doi.org/10.1186/s13662-020-02727-5 doi: 10.1186/s13662-020-02727-5
![]() |
[20] |
M. D. Johnson, B. Pell, A dynamical framework for modeling fear of infection and frustration with social distancing in Covid-19 spread, Math. Biosci. Eng., 17 (2020), 7892–7915. https://doi.org/10.3934/mbe.2020401 doi: 10.3934/mbe.2020401
![]() |
[21] |
K. Al-Khaled, M. Alquran, An approximate solution for a fractional-order model of generalized Harry Dym equation, Math. Sci., 8 (2014), 125–130. https://doi.org/10.1007/s40096-015-0137-x doi: 10.1007/s40096-015-0137-x
![]() |
[22] |
R. L. Bagley, R. A. Calico, Fractional order state equations for the control of viscoelastically damped structures, J. Guid. Control Dyn., 14 (1991), 304–311. https://doi.org/10.2514/3.20641 doi: 10.2514/3.20641
![]() |
[23] |
M. Ichise, Y. Nagayanagi, T. Kojima, An analog simulation of non-integer order transfer functions for analysis of electrode process, Journal of Electroanalytical Chemistry and Interfacial Electrochemistry, 33 (1971), 253–265. https://doi.org/10.1016/S0022-0728(71)80115-8 doi: 10.1016/S0022-0728(71)80115-8
![]() |
[24] |
W. M. Ahmad, J. C. Sprott, Chaos in fractional order autonomous non-linear systems, Chaos Solution. Fract., 16 (2003), 339–351. https://doi.org/10.1016/S0960-0779(02)00438-1 doi: 10.1016/S0960-0779(02)00438-1
![]() |
[25] |
F. Bozkurt, Stability analysis of a fractional-order differential equation system of a GBM-IS interaction depending on the density, Appl. Math. Inform. Sci., 8 (2014), 1021–1028. https://doi.org/10.12785/amis/080310 doi: 10.12785/amis/080310
![]() |
[26] |
T. Jin, H. Xia, S. Gao, Reliability analysis of the uncertain fractional-order dynamic system with state constraint, Math. Method. Appl. Sci., 45 (2022), 2615–2637. https://doi.org/10.1002/mma.7943 doi: 10.1002/mma.7943
![]() |
[27] |
T. Jin, S. Gao, H. Xia, H. Ding, Reliability analysis for the fractional-order circuit system subject to the uncertain random fractional-order model with caputo type, J. Adv. Res., 32 (2021), 15–26. https://doi.org/10.1016/j.jare.2021.04.008 doi: 10.1016/j.jare.2021.04.008
![]() |
[28] |
M. S. Abdo, T. Abdeljawad, K. D. Kuche, M. A. Alqudah, S. M. Ali, M. B. Jeelani, On non-linear pantograph fractional differential equations with Atangana-Baleanu-caputo derivative, Adv. Differ. Equ., 2021 (2021), 65. https://doi.org/10.1186/s13662-021-03229-8 doi: 10.1186/s13662-021-03229-8
![]() |
[29] |
M. D. Kassim, T. Abdeljawad, W. Shatanawi, S. M. Ali, M. S. Abdo, A qualitative study on generalized caputo fractional integro-differential equations, Adv. Differ. Equ., 2021 (2021), 375. https://doi.org/10.1186/s13662-021-03530-6 doi: 10.1186/s13662-021-03530-6
![]() |
[30] |
D. Qian, C. Li, R. P. Agarwal, P. J. Y.Wang, Stability analysis of a fractional differential system with Riemann-Liouville derivatives, Math. Comput. Model., 52 (2010), 862–874. https://doi.org/10.1016/j.mcm.2010.05.016 doi: 10.1016/j.mcm.2010.05.016
![]() |
[31] |
A. N. Chatterjee, F. Al Basir, A model for SARS-CoV-2 infection with treatment, Comput. Math. Method. Med., 2020 (2020), 1352982. https://doi.org/10.1155/2020/1352982 doi: 10.1155/2020/1352982
![]() |
[32] |
J. Mondal, P. Samui, A. N. Chatterjee, Optimal control strategies of non-pharmaceutical interventions for COVID-19 control, J. Interdiscip. Math., 24 (2021), 125–153. https://doi.org/10.1080/09720502.2020.1833459 doi: 10.1080/09720502.2020.1833459
![]() |
[33] |
A. N. Chatterjee, F. Al Basir, M. A. Almuqrin, J. Mondal, I. Khan, SARS-CoV-2 infection with lytic and non-lytic immune responses: A fractional order optimal control theoretical study, Results Phys., 26 (2021), 104260. https://doi.org/10.1016/j.rinp.2021.104260 doi: 10.1016/j.rinp.2021.104260
![]() |
[34] | J. Mondal, P. Samui, A. N. Chatterjee, Dynamical demeanour of SARS-CoV-2 virus undergoing immune response mechanism in COVID-19 pandemic, Eur. Phys. J. Spec. Top., 2022, in press. https://doi.org/10.1140/epjs/s11734-022-00437-5 |
[35] |
A. N. Chatterjee, B. Ahmad, A fractional-order differential equation model of COVID-19 infection of epithelial cells, Chaos Soliton. Fract., 147 (2021), 110952. https://doi.org/10.1016/j.chaos.2021.110952 doi: 10.1016/j.chaos.2021.110952
![]() |
[36] |
I. Qwusu-Mensah, L. Kinyemi, B. Oduro, O. S. Iyiola, A fractional-order approach to modeling and simulations of the novel COVID-19, Adv. Differ. Equ., 2020 (2020), 683. https://doi.org/10.1186/s13662-020-03141-7 doi: 10.1186/s13662-020-03141-7
![]() |
[37] |
A. Yousef, F. Bozkurt, Bifurcation and stability analysis of a system of fractional-order differential equations for a plant-herbivore model with Allee Effect, Mathematics, 7 (2019), 454. https://doi.org/10.3390/math7050454 doi: 10.3390/math7050454
![]() |
[38] |
M. Mandal, S. Jana, S. K. Nandi, T. K. Kar, Modelling, and control of the fractional-order epidemic model with fear effect, Energ. Ecol. Environ., 5 (2020), 421–432. https://doi.org/10.1007/s40974-020-00192-0 doi: 10.1007/s40974-020-00192-0
![]() |
[39] | N. Ozdemir, E. Ucar, Investigating of an immune system-cancer mathematical model with Mittag-Leffler kernel, AIMS Mathematics, 5 (2020), 1519–1531. https://doi.org/ 10.3934/math.2020104 |
[40] |
W. M. Ahmad, J. C. Sprott, Chaos in fractional order autonomous non-linear systems, Chaos Solution. Fract., 16 (2003), 339–351. https://doi.org/10.1016/S0960-0779(02)00438-1 doi: 10.1016/S0960-0779(02)00438-1
![]() |
[41] | A. Yousef, F. Bozkurt, T. Abdeljawad, Qualitative analysis of a fractional pandemic spread model of the novel coronavirus (COVID-19), Comput. Mater. Con., 66 (2021), 843–869. https://dou.org/10.32604/cmc.2020.012060 |
[42] |
K. H. Elliott, G. S. Bettini, D. R. Norris, Fear creates and Allee effect: experimental evidence from seasonal populations, Proc. R. Soc. B, 284 (2017), 20170878. https://doi.org/10.1098/rspb.2017.0878 doi: 10.1098/rspb.2017.0878
![]() |
[43] |
S. K. Sasmal, Population dynamics with multiple Allee effects included by a fear factors-A mathematical study on prey-predator interactions, Appl. Math. Model., 64 (2018), 1–14. https://doi.org/10.1016/j.apm.2018.07.021 doi: 10.1016/j.apm.2018.07.021
![]() |
[44] | Harward Medical School, Silent Spreaders?, by MEH News and Public Affairs, 2020. Available from: https://hms.harvard.edu/news/silent-spreaders. |
[45] |
L. Li, J. G. Liu, A generalized definition of Caputo derivatives and its application to fractional ODEs, SIAM J. Math. Anal., 50 (2016), 2867–2900. https://doi.org/10.1137/17M1160318 doi: 10.1137/17M1160318
![]() |
[46] | A. A. Kilbas, H. M. Srivastava, J. J. Trujillo, Theory, and applications of fractional differential equations, Elsevier, 2006. |
[47] |
Z. M. Odibat, N. T. Shawagfeh, Generalized Taylor's formula, Appl. Math. Comput., 186 (2007), 286–293. https://doi.org/10.1016/j.amc.2006.07.102 doi: 10.1016/j.amc.2006.07.102
![]() |
[48] |
W. Lin, Global existence theory and chaos control of fractional differential equations, J. Math. Anal. Appl., 332 (2007), 709–726. https://doi.org/10.1016/j.jmaa.2006.10.040 doi: 10.1016/j.jmaa.2006.10.040
![]() |
[49] |
N. Ozalp, E. Demirci, A fractional-order SEIR model with vertical transmission, Math. Comput. Model., 54 (2011), 1–6. https://doi.org/10.1016/j.mcm.2010.12.051 doi: 10.1016/j.mcm.2010.12.051
![]() |
[50] | D. Matignon, Stability results for fractional-order differential equations with applications to control processing, Comput. Eng. Sys. Appl., 2 (1996), 963–968. |
[51] | Q. S. Zeng, G. Y. Cao, X. J. Zhu, The asymptotic stability on sequential fractional-order systems, J. Shanghai Jiaotong Univ., 39 (2005), 346–348. |
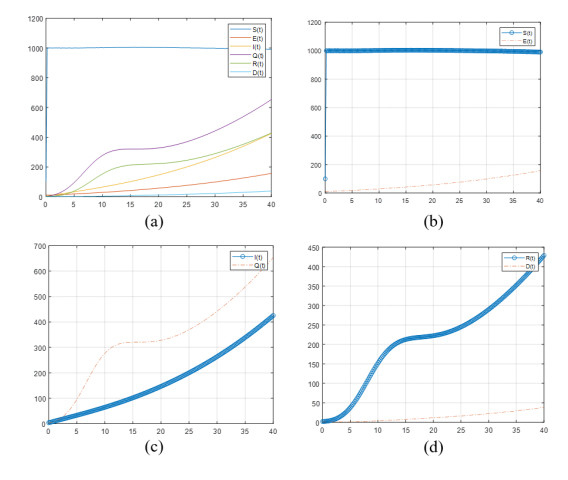
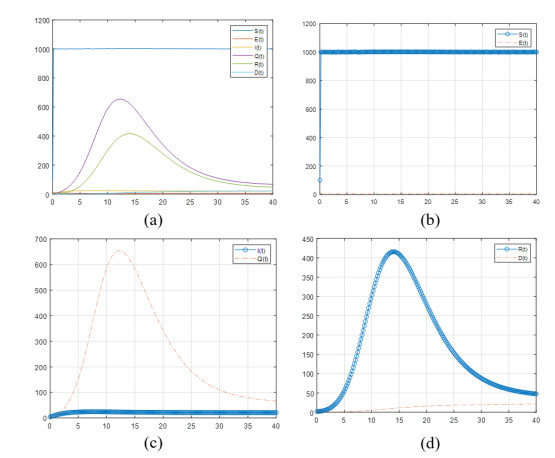
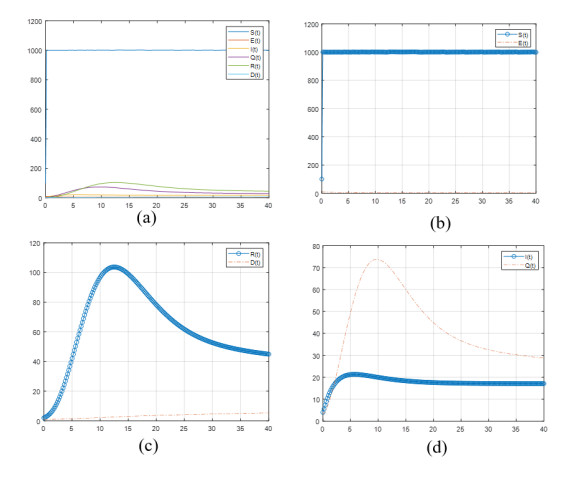
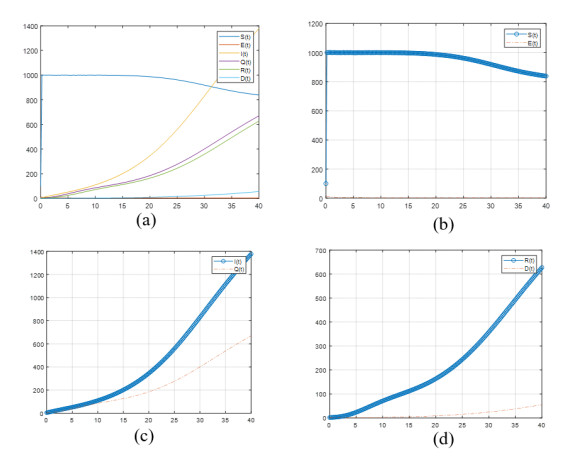