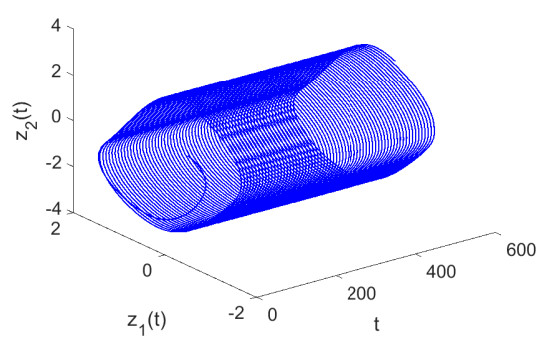
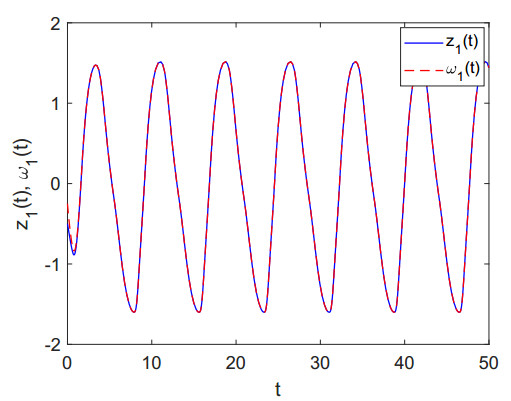
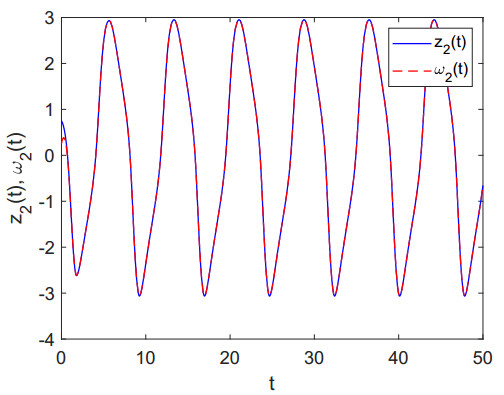
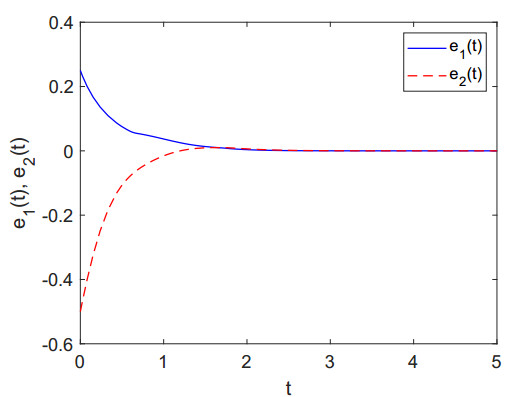
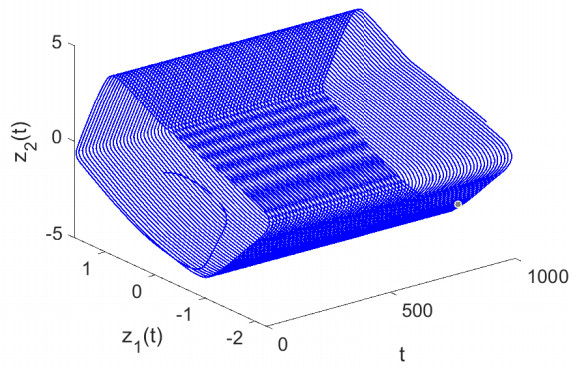
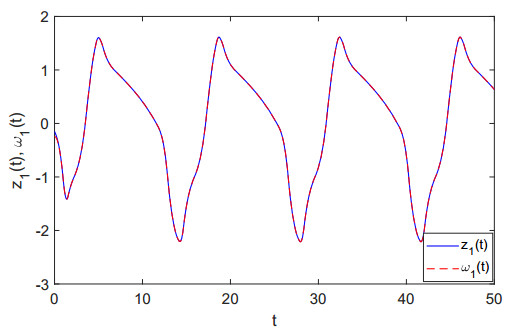
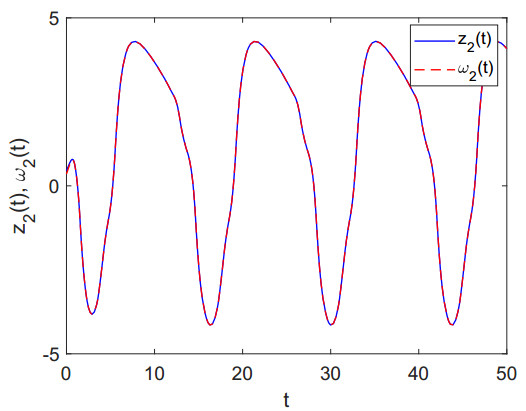
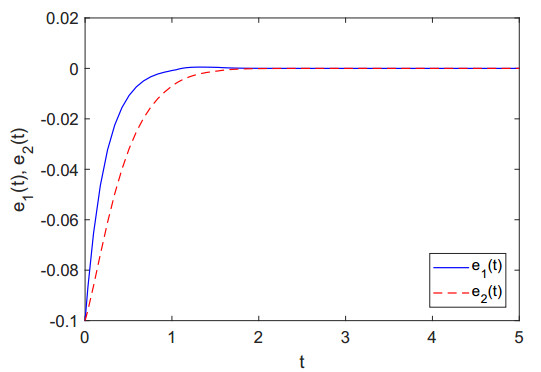
In this article, finite-time and fixed-time synchronizations (FFTS) of fuzzy cellular neural networks (FCNNs) with interaction and proportional delay terms have been investigated. The synchronizations of FCNNs are achieved with the help of p-norm based on the inequalities defined in Lemmas 2.1 and 2.2. The analysis of the method with some useful criteria is also used during the study of FFTS. Under the Lyapunov stability theory, FFTS of fuzzy-based CNNs with interaction and proportional delay terms can be achieved using controllers. Moreover, the upper bound of the settling time of FFTS is obtained. In view of settling points, the theoretical results on the considered neural network models of this article are more general as compared to the fixed time synchronization (FTS). The effectiveness and reliability of the theoretical results are shown through two numerical examples for different particular cases.
Citation: Ankit Kumar, Subir Das, Vijay K. Yadav, Rajeev, Jinde Cao, Chuangxia Huang. Synchronizations of fuzzy cellular neural networks with proportional time-delay[J]. AIMS Mathematics, 2021, 6(10): 10620-10641. doi: 10.3934/math.2021617
In this article, finite-time and fixed-time synchronizations (FFTS) of fuzzy cellular neural networks (FCNNs) with interaction and proportional delay terms have been investigated. The synchronizations of FCNNs are achieved with the help of p-norm based on the inequalities defined in Lemmas 2.1 and 2.2. The analysis of the method with some useful criteria is also used during the study of FFTS. Under the Lyapunov stability theory, FFTS of fuzzy-based CNNs with interaction and proportional delay terms can be achieved using controllers. Moreover, the upper bound of the settling time of FFTS is obtained. In view of settling points, the theoretical results on the considered neural network models of this article are more general as compared to the fixed time synchronization (FTS). The effectiveness and reliability of the theoretical results are shown through two numerical examples for different particular cases.

| [1] |
L. Chua, L. Yang, Cellular neural networks: Theory, IEEE Trans. Circuits Syst., 35 (1988), 1257–1272. doi: 10.1109/31.7600

|
| [2] |
T. Roska, L. Chua, Cellular neural networks with non-linear and delay-type template elements and non-uniform grids, Int. J. Circ. Theor. App., 20 (1992), 469–481. doi: 10.1002/cta.4490200504
|
| [3] |
H. Harrer, J. Nossek, Discrete-time cellular neural networks, Int. J. Circ. Theor. App., 20 (1992), 453–467. doi: 10.1002/cta.4490200503
|
| [4] |
T. Yang, L. Yang, The global stability of fuzzy cellular neural network, IEEE Trans. Circuits Syst. I, 43 (1996), 880–883. doi: 10.1109/81.538999
|
| [5] | K. Ratnavelu, M. Manikandan, P. Balasubramaniam, Synchronization of fuzzy bidirectional associative memory neural networks with various time delays, Appl. Math. Comput., 270 (2015), 582–605. |
| [6] | U. Kumar, S. Das, C. Huang, J. Cao, Fixed time synchronization of quaternion-valued neural networks with time varying delay, P. Roy. Soc. A-Math. Phy., 476 (2020), 20200324. |
| [7] |
R. Kumar, S. Das, Exponential stability of inertial bam neural network with time-varying impulses and mixed time-varying delays via matrix measure approach, Commun. Nonlinear Sci., 81 (2020), 105016. doi: 10.1016/j.cnsns.2019.105016
|
| [8] |
L. Duan, H. Wei, L. Huang, Finite-time synchronization of delayed fuzzy cellular neural networks with discontinuous activations, Fuzzy Set. Syst., 361 (2019), 56–70. doi: 10.1016/j.fss.2018.04.017
|
| [9] |
R. Tang, X. Yang, X. Wan, Finite-time cluster synchronization for a class of fuzzy cellular neural networks via non-chattering quantized controllers, Neural Networks, 113 (2019), 79–90. doi: 10.1016/j.neunet.2018.11.010
|
| [10] |
A. Abdurahman, H. Jiang, Z. Teng, Finite-time synchronization for fuzzy cellular neural networks with time-varying delays, Fuzzy Set. Syst., 297 (2016), 96–111. doi: 10.1016/j.fss.2015.07.009
|
| [11] |
P. Mani, R. Rajan, L. Shanmugam, Y. Joo, Adaptive control for fractional order induced chaotic fuzzy cellular neural networks and its application to image encryption, Inform. Sciences, 491 (2019), 74–89. doi: 10.1016/j.ins.2019.04.007
|
| [12] |
D. Xu, T. Wang, M. Liu, Finite-time synchronization of fuzzy cellular neural networks with stochastic perturbations and mixed delays, Circ. Syst. Signal Pr., 40 (2021), 3244–3265. doi: 10.1007/s00034-020-01631-3
|
| [13] |
L. Li, W. Wang, L. Huang, J. Wu, Some weak flocking models and its application to target tracking, J. Math. Anal. Appl., 480 (2019), 123404. doi: 10.1016/j.jmaa.2019.123404
|
| [14] |
J. Zhang, C. Huang, Dynamics analysis on a class of delayed neural networks involving inertial terms, Adv. Differ. Equ., 2020 (2020), 1–12. doi: 10.1186/s13662-019-2438-0
|
| [15] |
Q. Cao, X. Guo, Anti-periodic dynamics on high-order inertial hopfield neural networks involving time-varying delays, AIMS Mathematics, 5 (2020), 5402–5421. doi: 10.3934/math.2020347
|
| [16] |
C. Huang, Y. Tan, Global behavior of a reaction-diffusion model with time delay and Dirichlet condition, J. Differ. Equations, 271 (2021), 186–215. doi: 10.1016/j.jde.2020.08.008
|
| [17] |
C. Huang, X. Zhao, J. Cao, F. Alsaadi, Global dynamics of neoclassical growth model with multiple pairs of variable delays, Nonlinearity, 33 (2020), 6819–6834. doi: 10.1088/1361-6544/abab4e
|
| [18] |
C. Huang, H. Zhang, L. Huang, Almost periodicity analysis for a delayed Nicholson's blowflies model with nonlinear density-dependent mortality term, Commun. Pur. Appl. Anal., 18 (2019), 3337–3349. doi: 10.3934/cpaa.2019150
|
| [19] |
J. Wang, X. Chen, L. Huang, The number and stability of limit cycles for planar piecewise linear systems of node-saddle type, J. Math. Anal. Appl., 469 (2019), 405–427. doi: 10.1016/j.jmaa.2018.09.024
|
| [20] |
J. Wang, C. Huang, L. Huang, Discontinuity-induced limit cycles in a general planar piecewise linear system of saddle-focus type, Nonlinear Anal. Hybri., 33 (2019), 162–178. doi: 10.1016/j.nahs.2019.03.004
|
| [21] |
L. Pecora, T. Carroll, Synchronization in chaotic systems, Phys. rev. lett., 64 (1990), 821–824. doi: 10.1103/PhysRevLett.64.821
|
| [22] |
Y. Kao, H. Li, Asymptotic multistability and local s-asymptotic $\omega$-periodicity for the nonautonomous fractional-order neural networks with impulses, Sci. China Inform. Sci., 64 (2021), 1–13. doi: 10.1007/s11431-020-1559-2
|
| [23] | Y. Kao, Y. Li, J. Park, X. Chen, Mittag-leffler synchronization of delayed fractional memristor neural networks via adaptive control, IEEE T. Neur. Net. Lear., 32 (2020), 2279–2284. |
| [24] | H. Li, Y. Kao, H. Bao, Y. Chen, Uniform stability of complex-valued neural networks of fractional order with linear impulses and fixed time delays, IEEE T. Neur. Net. Lear., 2021, DOI: 10.1109/TNNLS.2021.3070136. |
| [25] | Y. Cao, Y. Kao, J. Park, H. Bao, Global mittag-leffler stability of the delayed fractional-coupled reaction-diffusion system on networks without strong connectedness, IEEE T. Neur. Net. Lear., 2021, DOI: 10.1109/TNNLS.2021.3080830. |
| [26] |
C. Huang, X. Long, J. Cao, Stability of antiperiodic recurrent neural networks with multiproportional delays, Math. Method. Appl. Sci., 43 (2020), 6093–6102. doi: 10.1002/mma.6350
|
| [27] |
Q. Wang, Y. Fang, H. Li, L. Su, B. Dai, Anti-periodic solutions for high-order hopfield neural networks with impulses, Neurocomputing, 138 (2014), 339–346. doi: 10.1016/j.neucom.2014.01.028
|
| [28] |
C. Huang, L. Yang, J. Cao, Asymptotic behavior for a class of population dynamics, AIMS Mathematics, 5 (2020), 3378–3390. doi: 10.3934/math.2020218
|
| [29] |
W. Perruquetti, T. Floquet, E. Moulay, Finite-time observers: application to secure communication, IEEE T. Automat. Contr., 53 (2008), 356–360. doi: 10.1109/TAC.2007.914264
|
| [30] |
H. Wang, J. Ye, Z. Miao, E. Jonckheere, Robust finite-time chaos synchronization of time-delay chaotic systems and its application in secure communication, T. I. Meas. Control, 40 (2018), 1177–1187. doi: 10.1177/0142331216678311
|
| [31] |
B. Vaseghi, M. Pourmina, S. Mobayen, Finite-time chaos synchronization and its application in wireless sensor networks, T. I. Meas. Control, 40 (2018), 3788–3799. doi: 10.1177/0142331217731617
|
| [32] | A. Polyakov, Nonlinear feedback design for fixed-time stabilization of linear control systems, IEEE T. Automat. Contr., 57 (2011), 2106–2110. |
| [33] |
Z. Xu, C. Li, Y. Han, Leader-following fixed-time quantized consensus of multi-agent systems via impulsive control, J. Frank. I., 356 (2019), 441–456. doi: 10.1016/j.jfranklin.2018.10.009
|
| [34] |
C. Chen, L. Li, H. Peng, Y. Yang, Fixed-time synchronization of inertial memristor-based neural networks with discrete delay, Neural Networks, 109 (2019), 81–89. doi: 10.1016/j.neunet.2018.10.011
|
| [35] |
X. Yang, J. Lam, D. Ho, Z. Feng, Fixed-time synchronization of complex networks with impulsive effects via nonchattering control, IEEE T. Automat. Contr., 62 (2017), 5511–5521. doi: 10.1109/TAC.2017.2691303
|
| [36] | G. Kamenkov, On stability of motion over a finite interval of time, J. Appl. Math. Mech., 17 (1953), 529–540. |
| [37] |
A. Muralidharan, R. Pedarsani, P. Varaiya, Analysis of fixed-time control, Transport. Res. B-Meth., 73 (2015), 81–90. doi: 10.1016/j.trb.2014.12.002
|
| [38] |
Y. Ma, T. Houghton, A. Cruden, D. Infield, Modeling the benefits of vehicle-to-grid technology to a power system, IEEE T. Power Syst., 27 (2012), 1012–1020. doi: 10.1109/TPWRS.2011.2178043
|
| [39] | A. Polyakov, Nonlinear feedback design for fixed-time stabilization of linear control systems, IEEE T. Automat. Contr., 57 (2011), 2106–2110. |
| [40] |
M. Zheng, L. Li, H. Peng, J. Xiao, Y. Yang, Y. Zhang, et al. Fixed-time synchronization of memristor-based fuzzy cellular neural network with time-varying delay, J. Franklin. I., 355 (2018), 6780–6809. doi: 10.1016/j.jfranklin.2018.06.041
|
| [41] |
Y. Liu, Y. Sun, Fixed-time synchronization of fuzzy cellular neural networks with time-varying delays and discontinuous activations, IEEE Access, 8 (2020), 65801–65811. doi: 10.1109/ACCESS.2020.2985212
|
| [42] |
Y. Sun, Y. Liu, Fixed-time synchronization of delayed fractional-order memristor-based fuzzy cellular neural networks, IEEE Access, 8 (2020), 165951–165962. doi: 10.1109/ACCESS.2020.3022928
|
| [43] |
W. Cui, Z. Wang, W. Jin, Fixed-time synchronization of markovian jump fuzzy cellular neural networks with stochastic disturbance and time-varying delays, Fuzzy Set. Syst., 411 (2021), 68–84. doi: 10.1016/j.fss.2020.05.007
|
| [44] |
W. Ding, M. Han, Synchronization of delayed fuzzy cellular neural networks based on adaptive control, Phy. Lett. A, 372 (2008), 4674–4681. doi: 10.1016/j.physleta.2008.04.053
|
| [45] |
X. Feng, F. Zhang, W. Wang, Global exponential synchronization of delayed fuzzy cellular neural networks with impulsive effects, Chaos, Soliton. Fract., 44 (2011), 9–16. doi: 10.1016/j.chaos.2010.10.003
|
| [46] |
Q. Xiao, Z. Zeng, Scale-limited lagrange stability and finite-time synchronization for memristive recurrent neural networks on time scales, IEEE T. Cybernetics, 47 (2017), 2984–2994. doi: 10.1109/TCYB.2017.2676978
|
| [47] | X. Liu, J. Cao, W. Yu, Q. Song, Nonsmooth finite-time synchronization of switched coupled neural networks, IEEE T. Cybernetics, 46 (2015), 2360–2371. |
| [48] | X. Liu, H. Su, M. Chen, A switching approach to designing finite-time synchronization controllers of coupled neural networks, IEEE T. Neur. Net. Lear., 27 (2015), 471–482. |
| [49] |
X. Yang, D. Ho, J. Lu, Q. Song, Finite-time cluster synchronization of t–s fuzzy complex networks with discontinuous subsystems and random coupling delays, IEEE T. Fuzzy Syst., 23 (2015), 2302–2316. doi: 10.1109/TFUZZ.2015.2417973
|
| [50] |
M. Zheng, L. Li, H. Peng, J. Xiao, Y. Yang, H. Zhao, Finite-time stability analysis for neutral-type neural networks with hybrid time-varying delays without using Lyapunov method, Neurocomputing, 238 (2017), 67–75. doi: 10.1016/j.neucom.2017.01.037
|
| [51] |
M. Zheng, L. Li, H. Peng, J. Xiao, Y. Yang, H. Zhao, Finite-time stability and synchronization for memristor-based fractional-order cohen-grossberg neural network, Eur. Phys. J. B, 89 (2016), 204. doi: 10.1140/epjb/e2016-70337-6
|
| [52] |
A. Polyakov, D. Efimov, W. Perruquetti, Finite-time and fixed-time stabilization: Implicit lyapunov function approach, Automatica, 51 (2015), 332–340. doi: 10.1016/j.automatica.2014.10.082
|
| [53] |
Y. Wan, J. Cao, G. Wen, W. Yu, Robust fixed-time synchronization of delayed cohen–grossberg neural networks, Neural Networks, 73 (2016), 86–94. doi: 10.1016/j.neunet.2015.10.009
|
| [54] | X. Liu, T. Chen, Finite-time and fixed-time cluster synchronization with or without pinning control, IEEE T. Cybernetics, 48 (2016), 240–252. |
| [55] |
W. Ma, C. Li, Y. Wu, Y. Wu, Synchronization of fractional fuzzy cellular neural networks with interactions, Chaos, 27 (2017), 103106. doi: 10.1063/1.5006194
|
| [56] |
W. Sun, Y. Wu, J. Zhang, S. Qin, Inner and outer synchronization between two coupled networks with interactions, J. Franklin I., 352 (2015), 3166–3177. doi: 10.1016/j.jfranklin.2014.08.004
|
| [57] |
Y. Liu, X. Wan, E. Wu, X. Yang, F. Alsaadi, T. Hayat, Finite-time synchronization of markovian neural networks with proportional delays and discontinuous activations, Nonlinear Anal-Model., 23 (2018), 515–532. doi: 10.15388/NA.2018.4.4
|
| [58] |
W. Wang, Finite-time synchronization for a class of fuzzy cellular neural networks with time-varying coefficients and proportional delays, Fuzzy Set. Syst., 338 (2018), 40–49. doi: 10.1016/j.fss.2017.04.005
|
| [59] | C. Huang, H. Yang, J. Cao, Weighted Pseudo Almost Periodicity of Multi-Proportional Delayed Shunting Inhibitory Cellular Neural Networks with $D$ operator, Discrete Cont. Dyn. S, 14 (2021), 1259–1272. |
| [60] | Y. Chen, C. Qiao, M. Hamdi, D. Tsang, Proportional differentiation: A scalable qos approach, IEEE Commun. Mag., 41 (2003), 52–58. |
| [61] |
A. Abdurahman, H. Jiang, Z. Teng, Finite-time synchronization for memristor-based neural networks with time-varying delays, Neural Networks, 69 (2015), 20–28. doi: 10.1016/j.neunet.2015.04.015
|
| [62] |
Q. Zhu, X. Li, Exponential and almost sure exponential stability of stochastic fuzzy delayed cohen-grossberg neural networks, Fuzzy Set. Syst., 203 (2012), 74–94. doi: 10.1016/j.fss.2012.01.005
|
| [63] |
F. Kong, Q. Zhu, Finite-time and fixed-time synchronization criteria for discontinuous fuzzy neural networks of neutral-type in hale's form, IEEE Access, 7 (2019), 99842–99855. doi: 10.1109/ACCESS.2019.2930678
|
| [64] | A. Chen, J. Cao, Existence and attractivity of almost periodic solutions for cellular neural networks with distributed delays and variable coefficients, Appl. Math. Comput., 134 (2003), 125–140. |
Figures(8)

Ankit Kumar, Subir Das, Vijay K. Yadav, Rajeev, Jinde Cao, Chuangxia Huang. Synchronizations of fuzzy cellular neural networks with proportional time-delay[J]. AIMS Mathematics, 2021, 6(10): 10620-10641. doi: 10.3934/math.2021617


 DownLoad: